Crop hail insurance is one of the most popular agreements between agricultural entrepreneurs and insurance companies, especially if client farms are located in regions where this severe weather event is frequent. For instance, in Europe, hail is common in mountainous areas and pre-Alpine regions (Austria and Southern France), while Texas, Oklahoma, Nebraska, South Dakota, and Kansas were the top U.S. states in 2021 on this matter .
Hails can cause moderate damage (e.g., shredded leaves and stems) to the complete loss of crops. The extent of destruction depends on the diameter and shape of hailstones, wind speed at which they fall, fall orientation, hail longevity, type of plants exposed to hailstorms, and crops’ current growth stage.
One of the most common challenges insurance providers face is the late submission of crop hail damage applications (despite the recommended 72-hour window) and the lack of data to verify each claim.
The EOSDA science team has long experience determining hail occurrences to help insurance providers in claim assessment. One such project involved detecting hail on a field level: defining whether or not it happened and therefore was the only reason for crop damage or loss.
Challenge: Detection Of Hail Events Amid Lack Of Up-To-Date Information>
The insurance provider had to process hail damage claims to verify that the discussed weather event took place on a given field. Unfortunately, this has become more difficult due to several factors.
First, hail storms develop quickly and usually last several minutes; quarter and half an hour-long events are also observed.
Second, hail can happen in an area as small as 500 square meters.
The speed of response to the event also matters. Farmers may not immediately submit the notice of loss, so insurance companies can’t promptly send scouts to evaluate the damage and report on it. Moreover, the cost of farmland inspections and person-hours that can be potentially spent on collecting information within a single case may not be justified, given the payout sum.
Farm owners may also have no surveillance cameras to complement their claim with footage. That’s why other means of detecting the occurrence of the insured event must be found.
Solution: Analyzing Lightning And Historical Hail Damage Data
A client supposed we would use historical satellite images of fields and detect damaged crops or hail clouds above. But the task wasn’t as simple as that. Cloudiness prevents a satellite from making clear imagery of the planet’s surface. That’s why we suggested detecting hail based on lightning activity.
Lightning strikes are typical for weather extremes like heavy rain and hail storms. Moreover, the sudden increase in flash frequency (rate), known as a lightning jump over a short time interval, indicates these events. So, the hail detection method suggested by the project team involved the analysis of historical lightning data for areas of interest.
Input data from the insurance company included submitted claims specifying the geographic location of fields and their areas, an estimated date of hail occurrence, and the percentage of the damaged area.
EOSDA Crop Monitoring
Fields monitoring platform, leveraging high-resolution satellite images to identify and react to any changes remotely!
The team obtained lighting data from the Earth Networks Total Lightning Detection Network (ENTLN). The provider manages over 900 wideband lightning sensors worldwide capable of accurately detecting in-cloud (IC) and cloud-to-ground (CG) lightning in real time . The network’s average detection efficiency is 95.4% and 60.0% for the cloud-ground and inter-cloud flashes, respectively. The output 2D location results of the ENTLN contain the following information:
- Time
- Latitude
- Longitude
- Flash type (IC or CG)
- Current intensity of every radiant source of pulse or flash.
In-cloud (intra-cloud) lightning happens inside the cloud, while cloud-to-ground (cloud-ground) lightning is a discharge between a thundercloud and the ground.
The researchers also used data on nine fields damaged by hail during the summer of 2016, 2018, and 2019 to validate the hail detection algorithm.
The scientists choose the lightning jump (LJ) algorithm for solving the problem. They proposed four flashes per minute as a threshold for detecting the LJ flash rate. Such a flash rate is a reliable predictor of hail in mountain areas, where fields for analysis were located.
The lightning data collected was for a radius of five km from the field center from two weeks before and two weeks after an official record of the hail event.
Lightning has its geometric dimensions, but the processes causing this phenomenon and the hail are much larger in scale. And if we observe intense thunderstorm activity within a radius of five km, the probability of hail in this area is high. Then, we analyzed the temporal development of lightning activity to detect the lightning strike. If we find it, we assume hail did happen on a field with the same date of hail event.
Outcome: Hail Events Detected And Actual Scale Of Damage Assessed
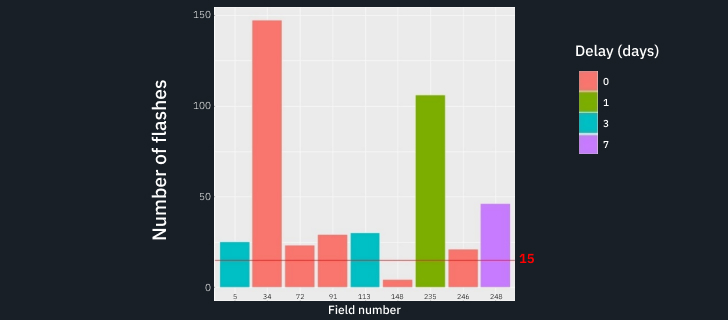
The project team defined hail on nine sunflower, wheat, and barley fields.
On the eight fields, the hail events most likely happened during data collection (between two weeks before and two weeks after the official record of the hail event). On one field, the LJ was absent, and there were only four flashes in total, meaning the probability of hail was close to zero.
Our analysis also shows that in some cases, the date of the insured event (date of claim) is different from the date of maximum lightning activity when hail could happen. On some fields, the date of maximum lightning activity was on the same date of claim, while on others later on.
The team got the request in the fall of 2020 and finished the task within two weeks.
Need a solution tailored to your business goals? Book a call with our team to see how we can help.
More news
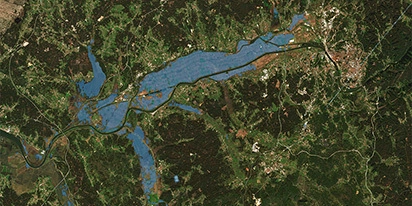
Validating satellite tech for flood analysis and damage mapping in Coimbra
Can satellites improve disaster response? We explored this in the Coimbra district, showing how integrated satellite intelligence can assess flood impacts and fill critical data gaps during a crisis.
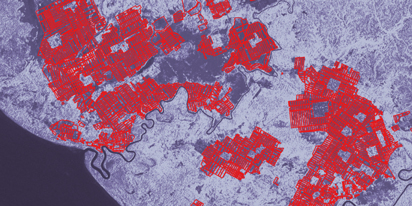
EOSDA advances rice field mapping in Indonesia with SAR
EOSDA tested a radar-based approach to improve rice field detection in Indonesia. By integrating SAR and optical data, the team ensured stable monitoring even during peak monsoon months.
EOSDA Forecasts Yields For 2025 In Saskatchewan
EOSDA created RM-level crop yield forecasts for Saskatchewan to address limitations of official data. The project shows how satellite and weather inputs reveal local yield changes during the season.