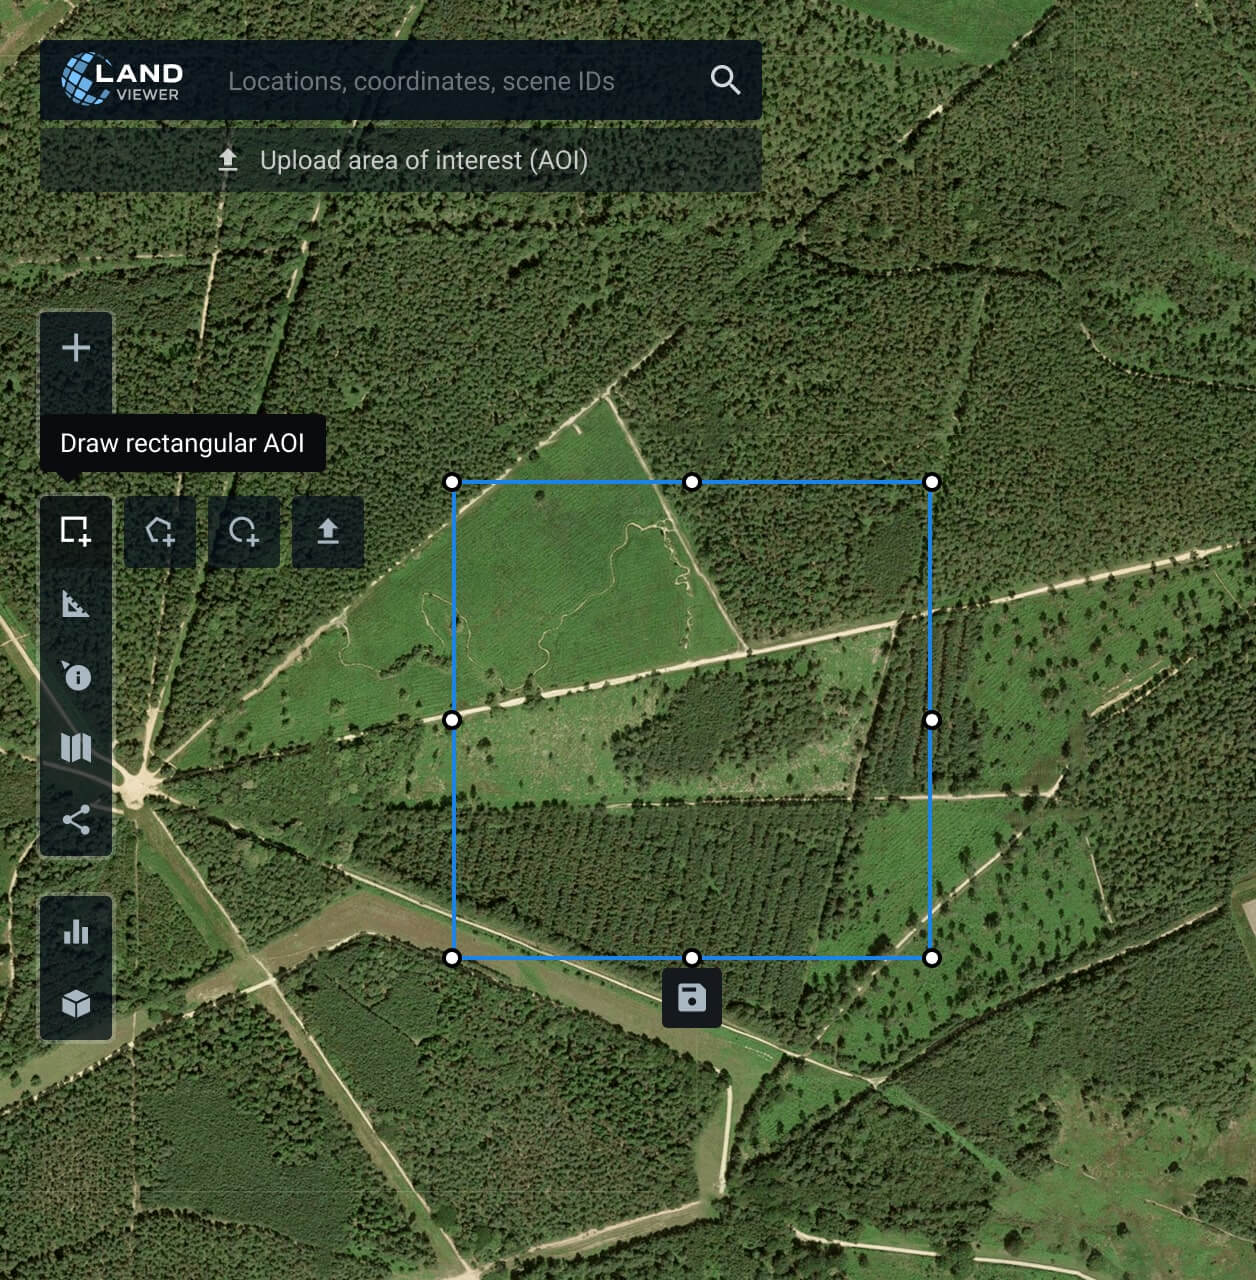
Instantly visualize stress zones, detect deforestation, monitor wildfire damage, and evaluate forest health by using advanced indices in forest monitoring software, among which are:
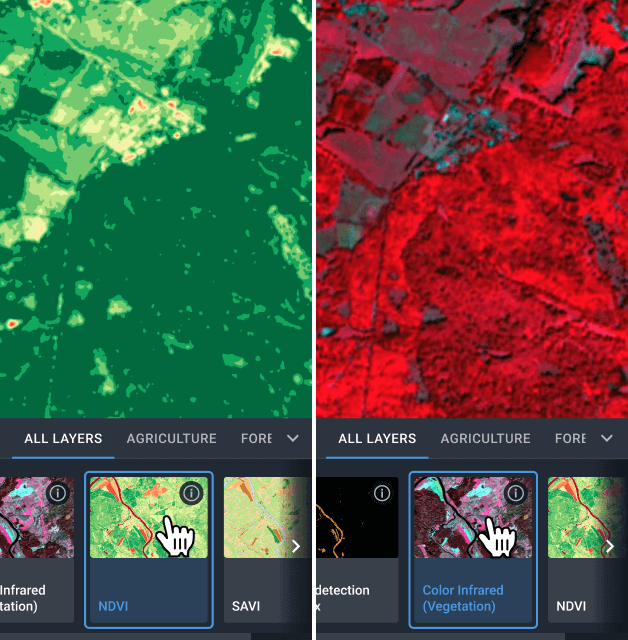
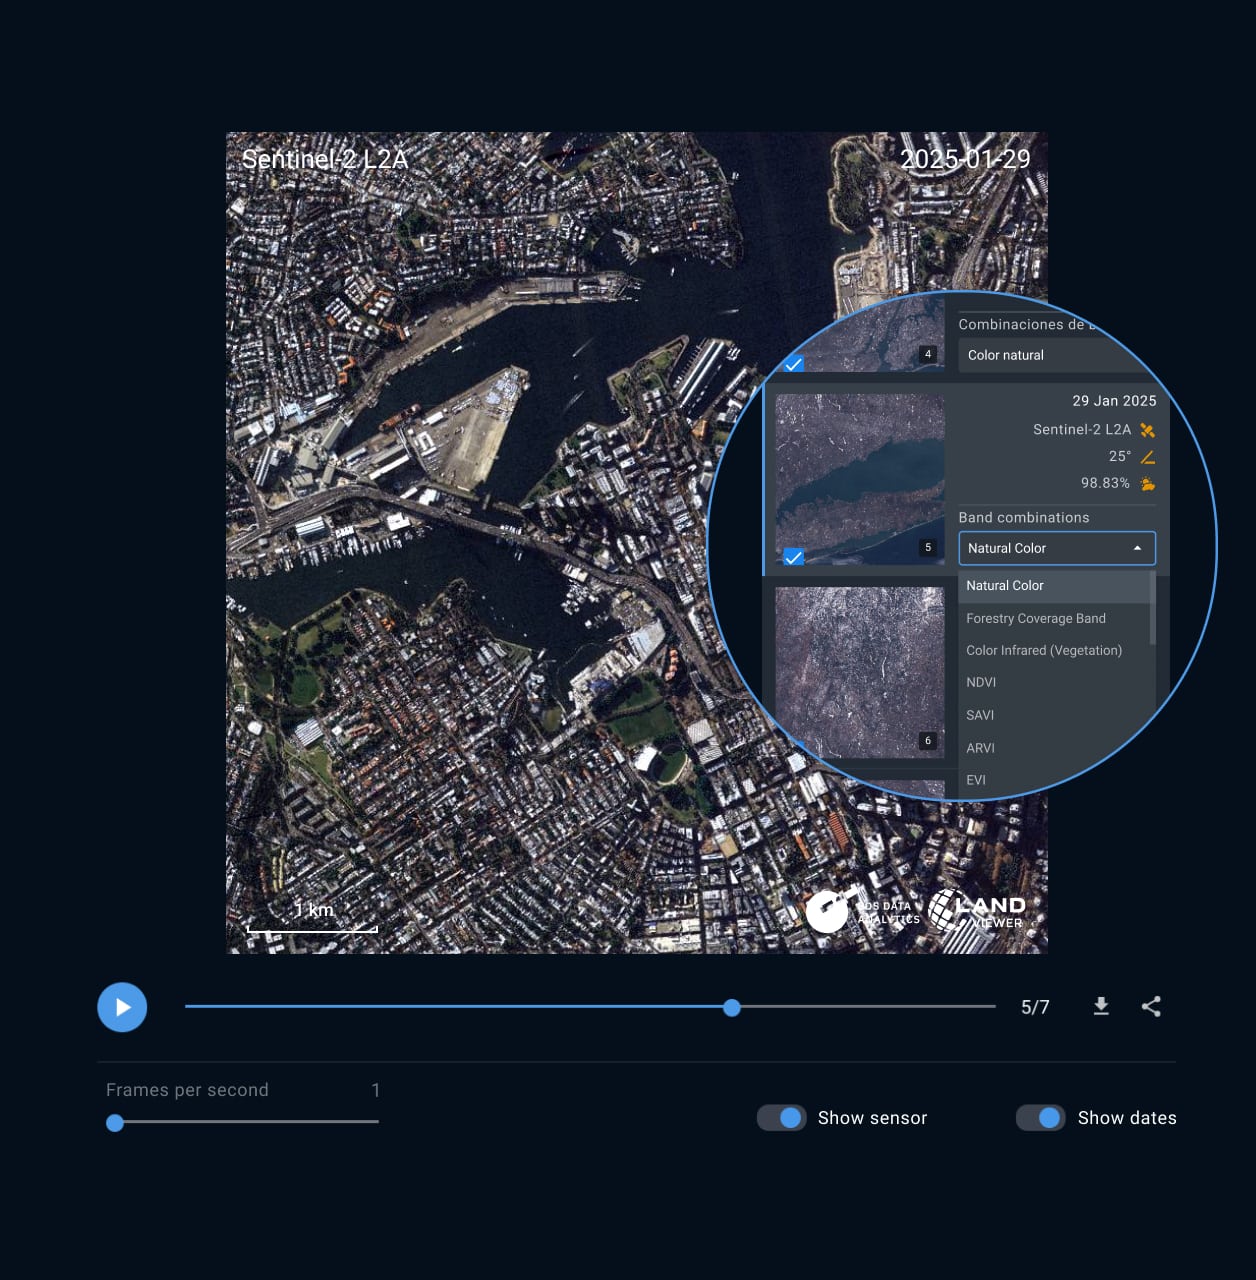
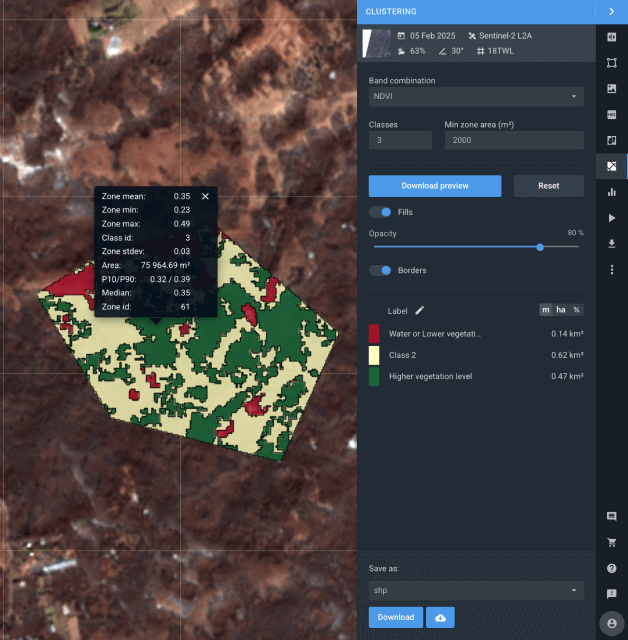
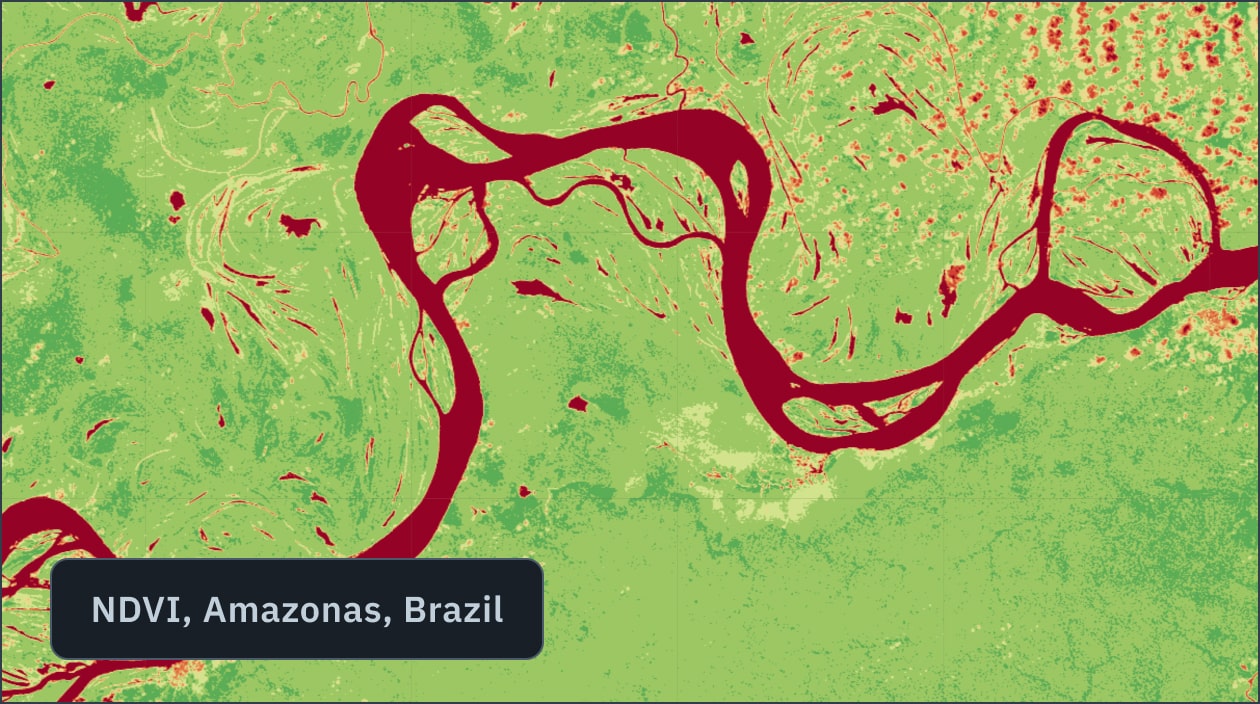
- NDVI: a versatile index for detecting deforestation, burned zones, and vegetation degradation.
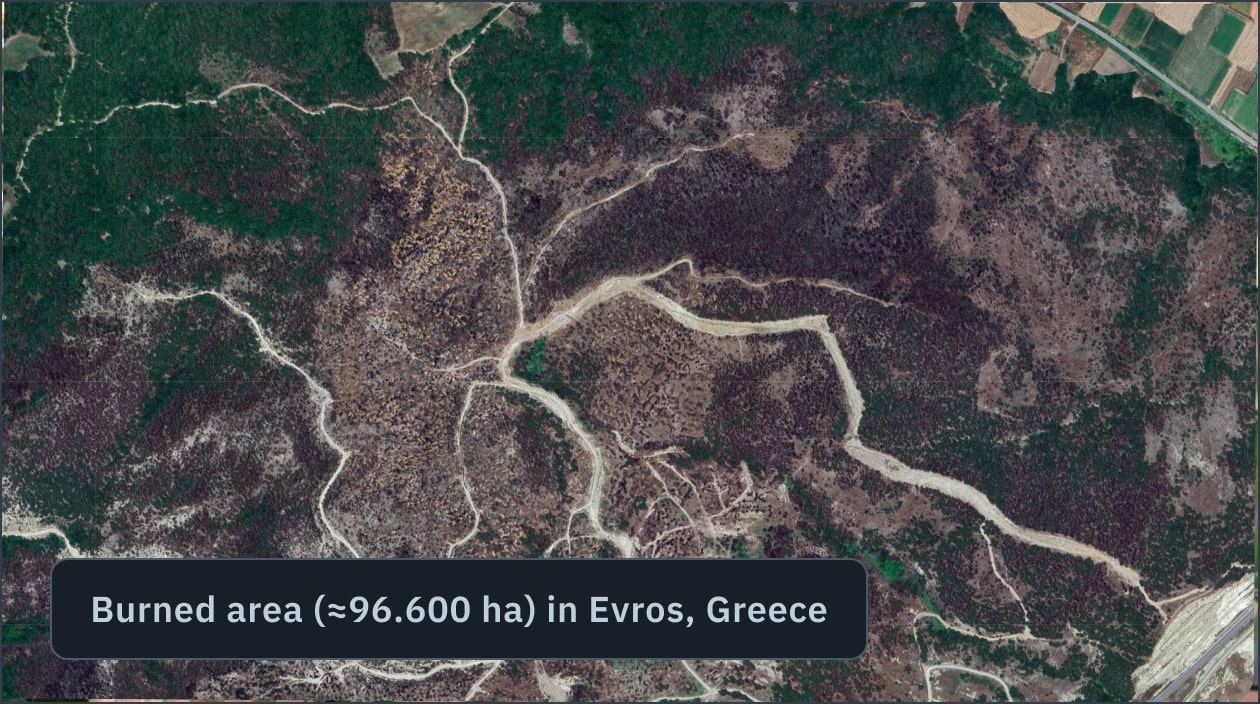
- NBR: used to identify burned areas after fires.
- Fire Detection Index: effective for spotting active fires, best applied with change detection.
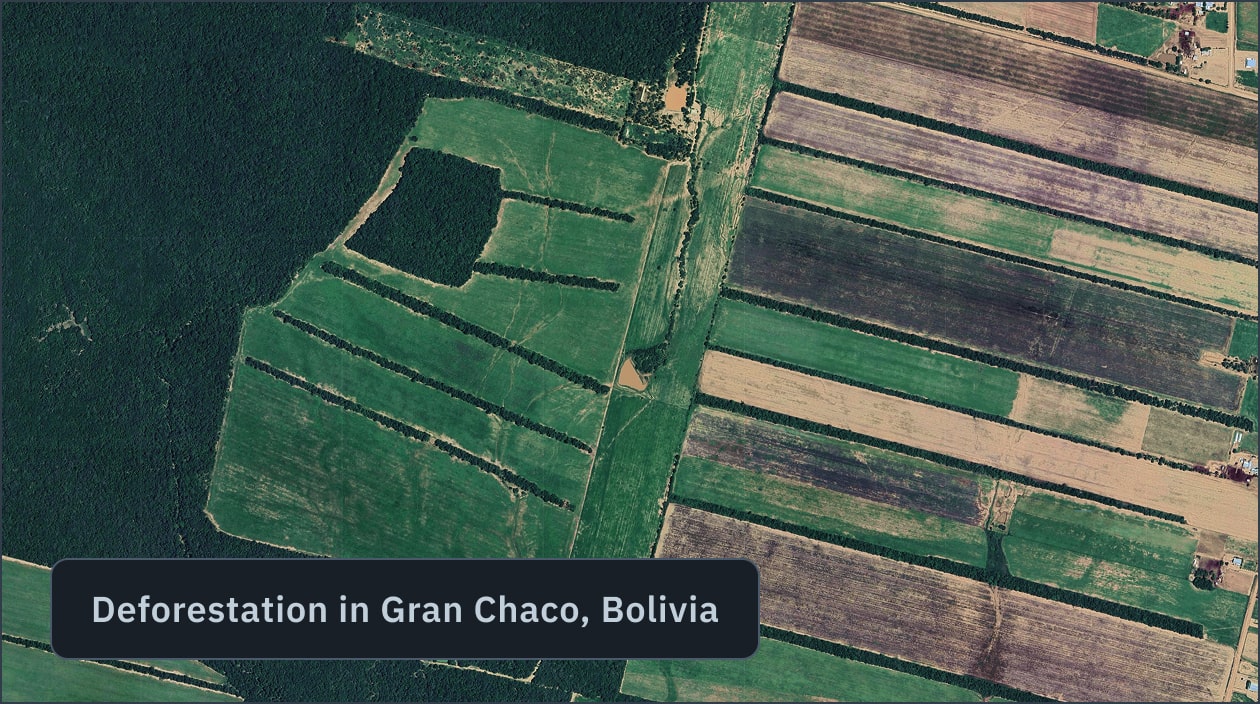
- Deforestation Index: highlights recent deforestation by comparing current images to the last cloud-free reference.
- EVI: ideal for assessing dense forest vegetation and overall health.
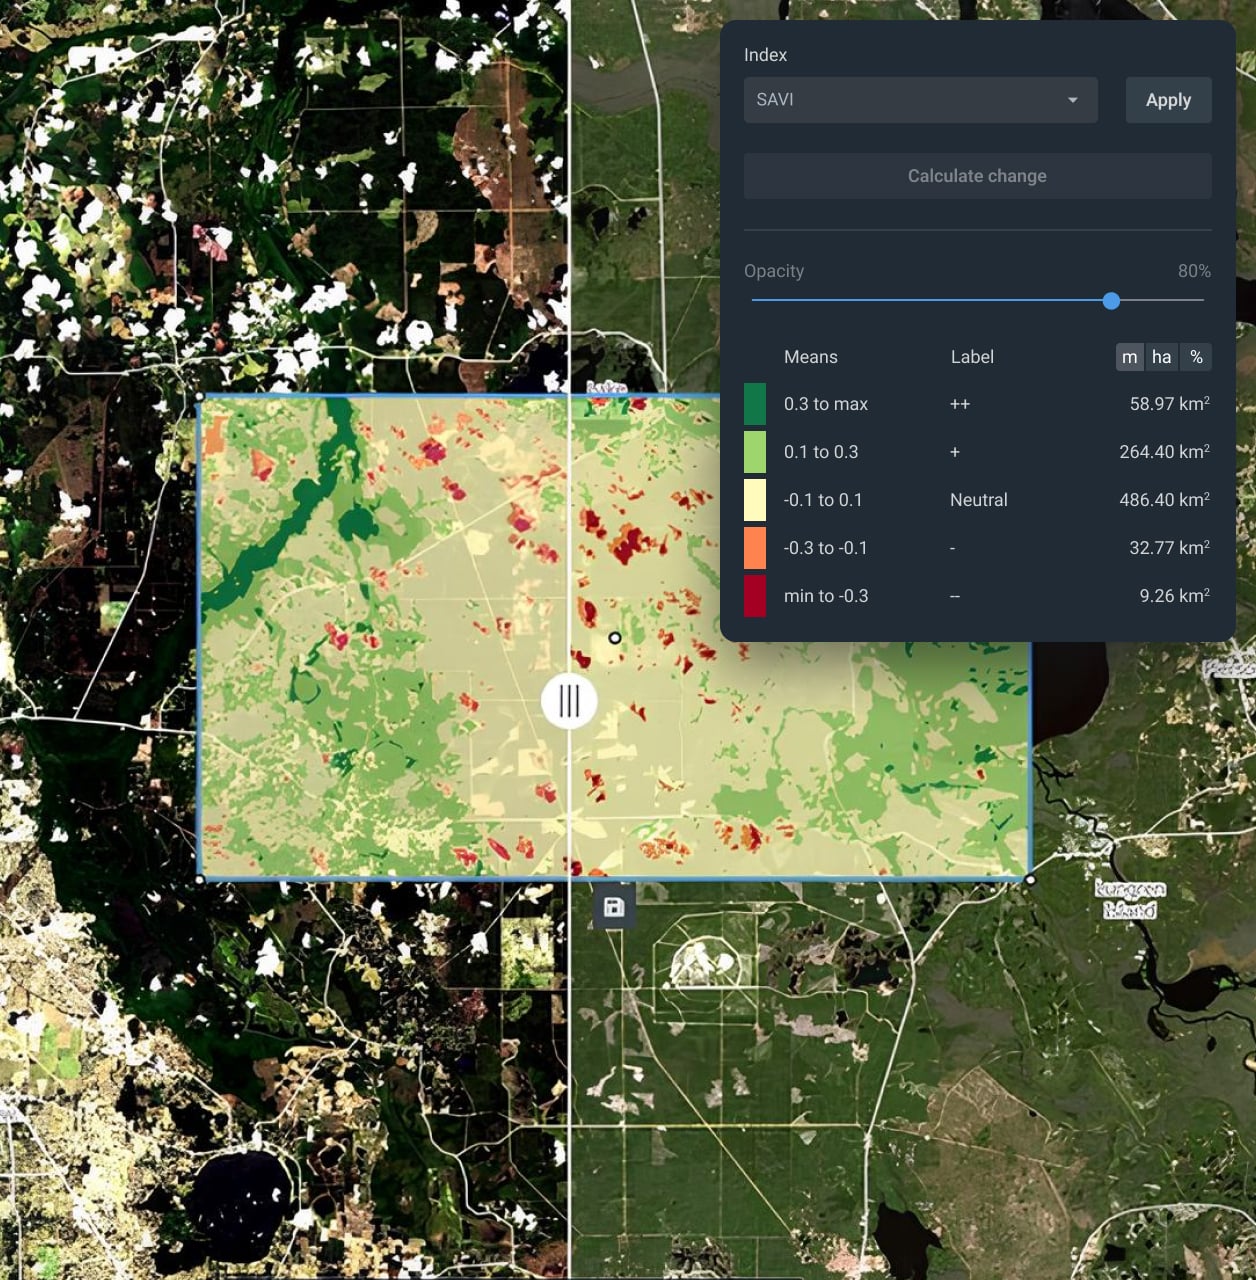
- SAVI: effective for monitoring young or newly planted forests.