Accurate crop yield prediction to boost agricultural productivity
Make informed decisions with timely crop yield prediction using machine learning by EOSDA to support planning, forecasting, and agri-intelligence.
- Two models: statistical (based on historical data) and biophysical (phenology-driven)
- Field- or regional-level insights for production planning, sourcing, and policy development
- Custom outputs in vector or tabular format with optional API or platform delivery

Benefits of yield prediction solution by EOSDA
Decision Support for Agribusiness
- Production and sourcing planning.
- Supply chain optimization.
- Enhanced field bank management & resource optimization.
- Agricultural loan/ insurance risk assessment & management.
- Monitoring compliance with agricultural programs.
Strategic Monitoring & Forecasting
- Market analysis & agricultural intelligence.
- Creation of agricultural statistics & inventories.
- Bioenergy feedstock assessment & monitoring.
- National food security & policy formulation.
- Land use planning & sustainable resource management.
Approach and Methodology
Statistical yield prediction model
Relies on historical dataset, primarily on past yield data.
Trained on historical data and predicts current-season yields by combining past trends with present parameters.
Biophysical yield prediction model
Relies on the physical crop parameters and its phenological characteristics (variety, growth stages, water demand, etc.).
Can predict yield for a specific date without historical data and can be applied repeatedly throughout the season.
Expected project outputs and formats
- Excel/CSV file or vector layer (ESRI shapefile, GeoJSON, KML, GPKG) containing field/district ID or name and the predicted yield in required OUM (e.g. kg/ha, bushel /ha) and other specific necessary metadata.
- Level of detail:
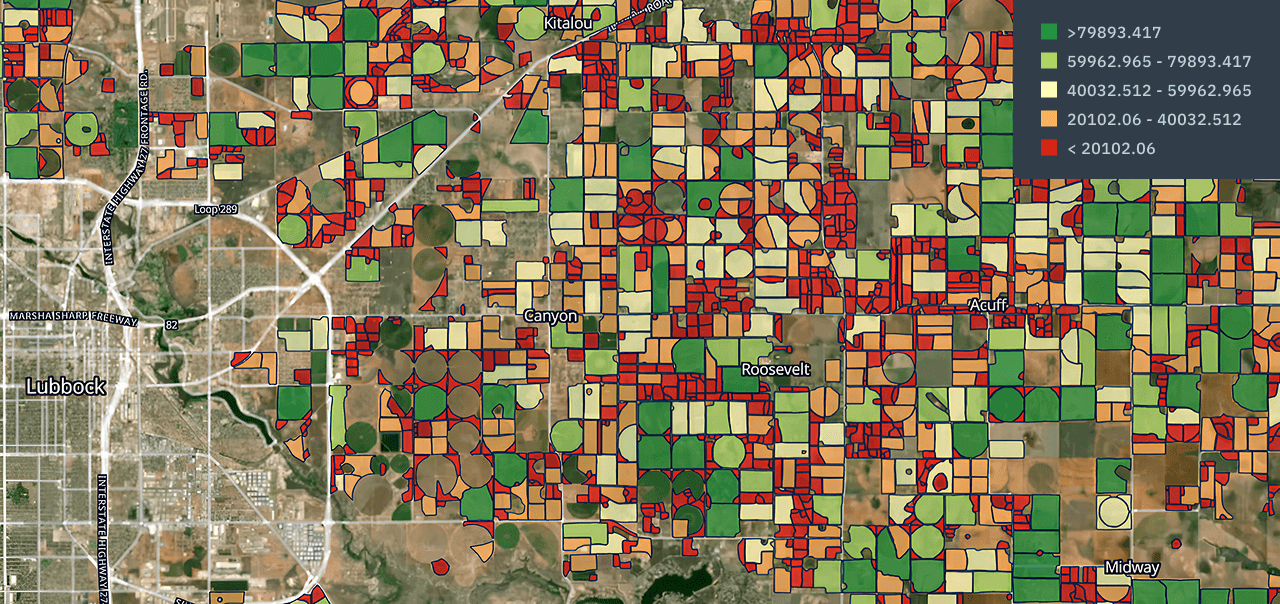
- Field level (results are provided per field for easy production estimation)
- Regional level (results are provided per each administrative unit, such as province, state, region, district, etc.)
- Aggregated statistics by admin boundaries of regions, districts, etc (xlsx, csv), if requested.
- Analytical report or results interpretation note, if requested.
*Delivery in another format, if requested, including via API interface.
Required data for crop yield prediction project
Input data provided by customer
- Area of interest in table (xlsx/ csv) or vector (KML, ESRI shapefile, GPKG, GeoJSON) format
- List of target crops
- Crop calendar and аgro management data, if available
- Yield statistics for AOI for the last 3-5 years, if available
- Soil maps and soil composition data for AOI, if available
Data prepared by EOSDA
- Phenology data
- Weather data
- Soil maps
- Satellite imagery
- Yield statistics for AOI from open sources
Statistical yield prediction parameters and project stages
This option can only be used when there is sufficient dataset for training, especially historical yield data. The result of biophysical modeling can be one of the parameters
Collection of аvailable data to create prediction dataset: historical yield statistics, weather, soil types, satellite data, etc.
Picking the appropriate ML model (e.g. Linear / Multiple regression, Random Forest, XGBoost, etc.).
Model training based on the available historical dataset and the selected algorithm.
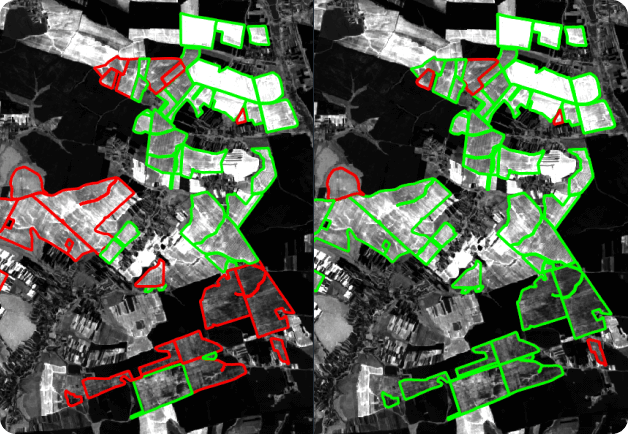
Application of the trained model to predict the yield for the current season on the target crop. Validation of results and calibration of the model if necessary.
Biophysical yield prediction parameters and project stages
This option works even without historical yield data for the AOI and crop type, and can be applied multiple times per season for more informative results.
Analysis of phenological data, research of crop profile and collection of available data for target season (weather data, soil characteristics, agro management, etc.).
Model calibration (adapted WOFOST). LAI assimilation (optionally, to increase the variability).
Simulation of biological productivity parameters (TAGP, WSO, relative soil moisture, total water consumption, and others).
Data updates (including weather forecasts) every 14 days to increase the accuracy.