The global agriculture drone market grows by 22% every year, an expected effect considering that in the US alone farmers see an estimated ROI of drones of $2 to $12 per acre. At the same time, there is a 5.5 billion market of satellite technologies providing agricultural businesses with historical data and forecasts on vegetation indices for their fields.
While serving the same goal of helping farmers, satellites and drones differ in what they offer to agribusinesses. Hence, many companies consider taking advantage of both to reach higher yields on a yearly basis.
In this blog post, EOS Data Analytics, a global provider of AI-powered satellite imagery analytics, will share three cases of some of its clients and partners who have experience of using drones and satellites to analyze their fields.
Case 1: Switching From Dronery To Satellites
One of our US customers, a local leader in the lawn and turf industries, started using drones in 2016 when they had around 10,000 acres to keep track of. They wanted to know the state of the green cover and NDVI (Normalized Difference Vegetation Index) ratings of their lands.
A few years later, two more locations in different states were added. Using drones was becoming increasingly time-consuming since the company needed to transport them and the operators from one place to another. They could allow only three drone reports per growing season.
Once the company switched to satellite imagery and remote sensing, they became able to make reports every month, and now it takes them 1,5 hours to analyze the state of one farm and three days to have the report of their entire operations.
With drones, it would require the company to have two full-time engineers operating drones and processing images continuously to get the same output.
Case 2: When Both Satellites And Drones Are Helpful For Plot State Analysis
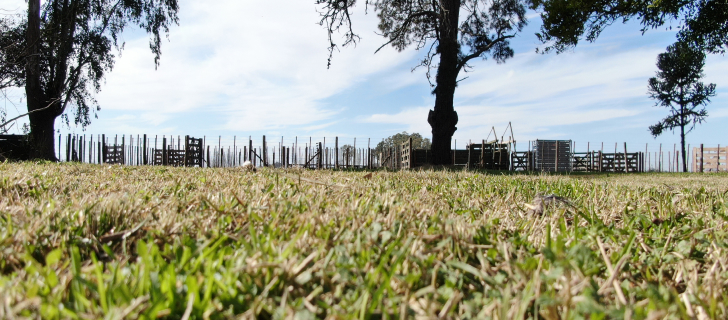
Aero665, an Argentine-based drone service company, shared how they use both EOSDA Crop Monitoring, an online satellite-based precision agriculture platform for field monitoring, and their drones to collect more data about plots.
To illustrate their work, Aero665 presented the analysis of a plot of approximately 18 hectares in a field located in Las Flores, province of Buenos Aires, Argentina. The plot had been sowed with wheat on July 7, 2022. After suffering from dry weather for several months, the crop was hit by 160 mm of heavy rain continuing for two days.
The team decided to find out the state of plant health after such rainfall.
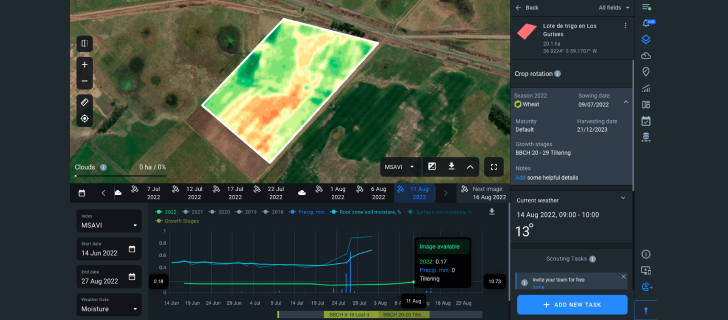
With EOSDA Crop Monitoring, users can find out the vegetation indices based on the level of chlorophyll and the presence of nitrogen in the crop. Let’s start with a short overview of the area via the platform.
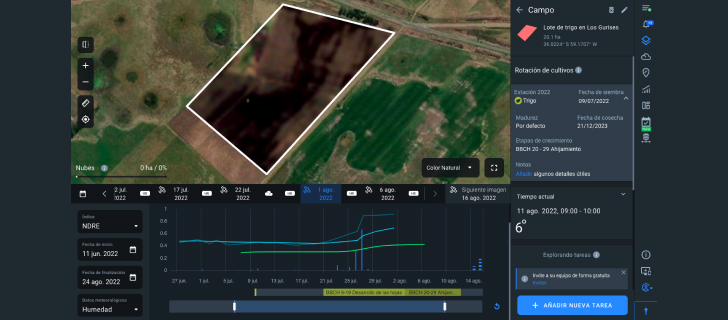
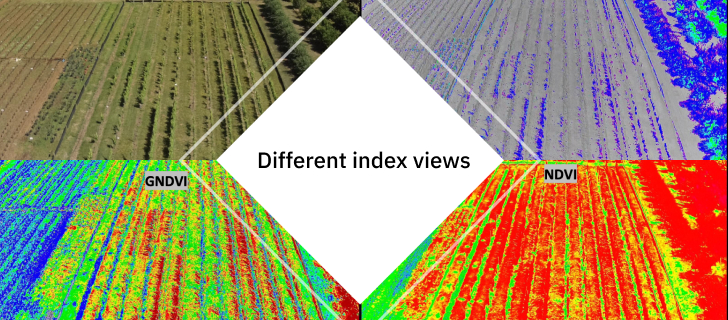
To see current crop development dynamics, let’s analyze the plot’s vegetation indices.
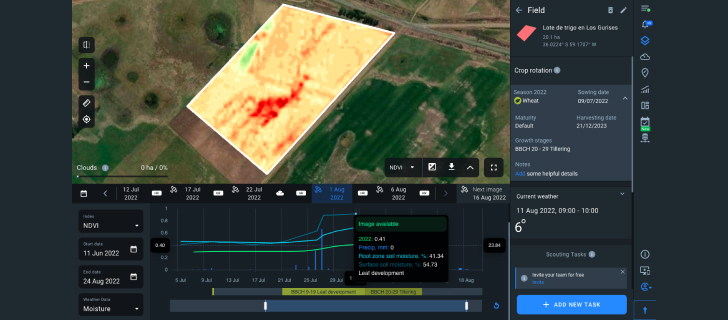
Above, screenshots of the plot’s NDVI and MSAVI (Modified Soil Adjusted Vegetation Index) indices are presented.
The NDVI index is most helpful when the crop grows most actively, i.e., in the middle of the season. The images were taken at the beginning of crop production season when the soil might remain bare or there’s low chlorophyll content in plants. This makes the MSAVI index also useful here as it mitigates soil effects and provides results more accurately than the basic NDVI.
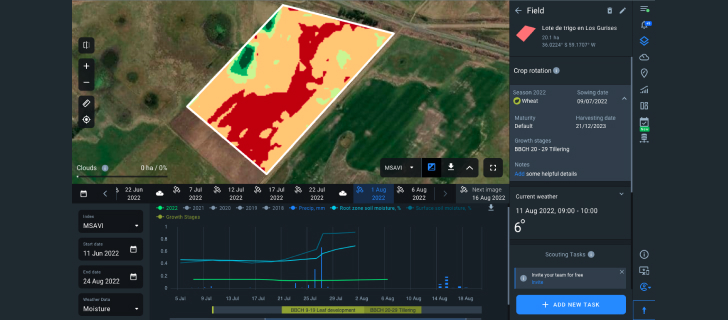
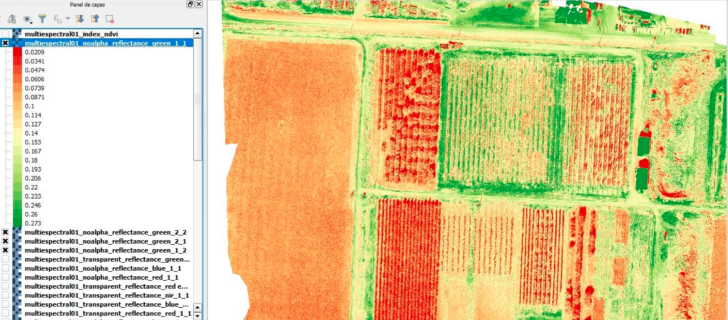
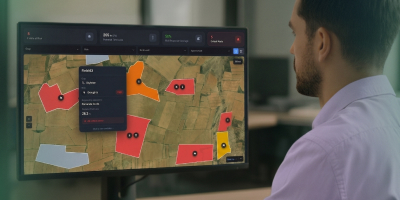
To see the heterogeneity of the plot more clearly, it must be zoned by average NDVI meanings.
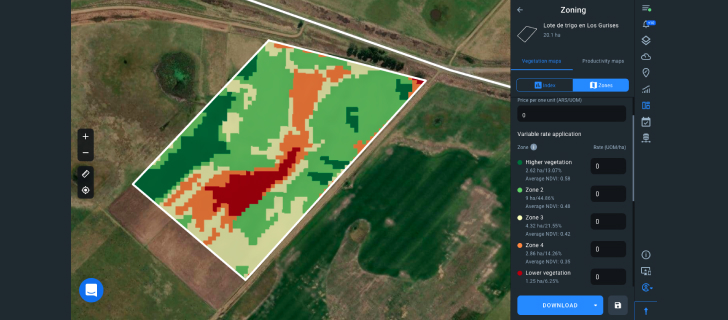
With this data, it becomes visible that most of the plot area has insufficient vegetation. Flooding might be suspected if this image is compared to the elevation map.
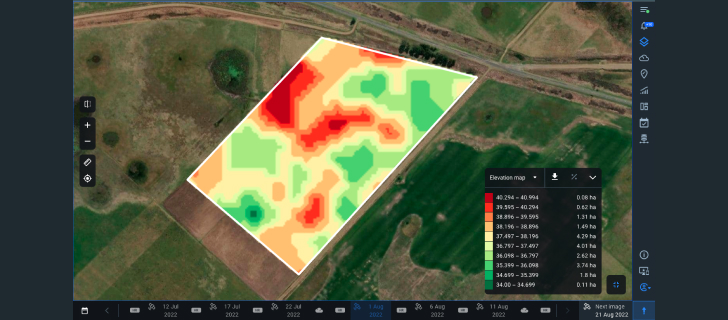
However, it does not prove the flooded areas are the ones that are the lowest on the plot.
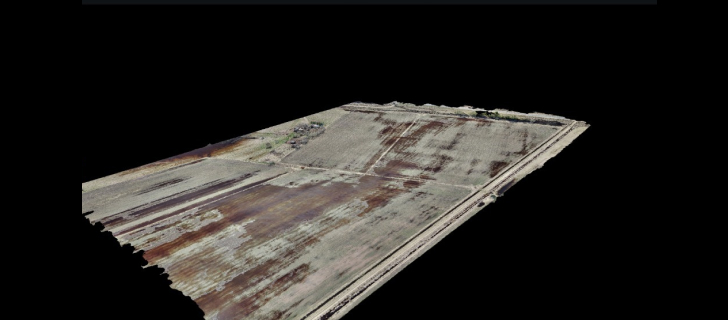
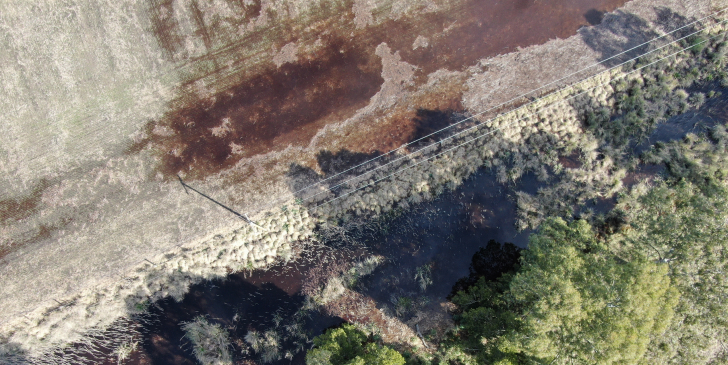
For more information, the data from the ground must be retrieved. High-resolution photos the drones take can help farmers see how much of their plots are flooded or covered with weeds. Such images also allow users to identify plagues and diseases, count plants, and more.
Aero665 used one of its drones to shoot the location on August 1. The flight took around 20 minutes, which is not much, but the data processing to get the images presented below usually takes much longer.
EOSDA Crop Monitoring
Fields monitoring platform, leveraging high-resolution satellite images to identify and react to any changes remotely!
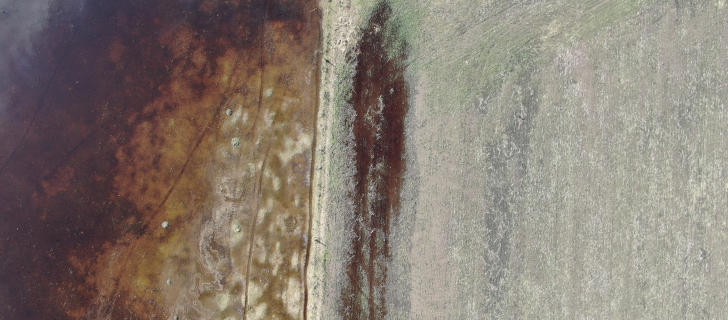
This photo reveals that the reason for the areas with low vegetation is flooding: the plants simply cannot be seen by the satellite since they’re underwater.
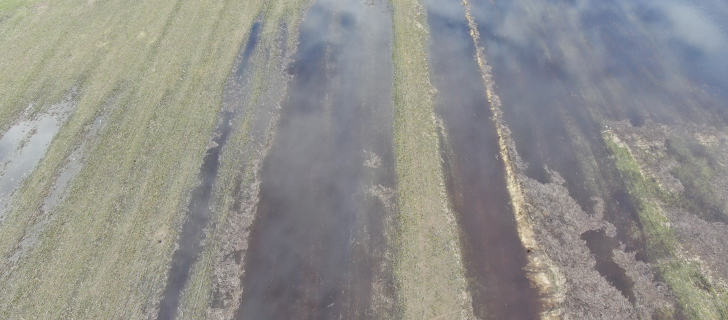
In addition, the drone took around 600 high-resolution photos of the plot. They can help estimate the amount of time it might take before the water is gone and the states of the different parts of crops affected by the water.
Once a few days have passed, a new image can be retrieved from EOSDA Crop Monitoring.
Now that the water is mostly gone, the state of the plot is much better, and it becomes visible how flooding affects the vegetation of the crop.
Case 3: Using Satellites For… Drones
We also talked to a partner of our client providing drone services in Chile to learn their technical challenges.
The company uses DJI Phantom 4 drones to make images of the plots and then perform an analysis similar to the one offered by EOSDA Crop Monitoring.
Unlike simpler drones, DJI Phantom 4 leverages newer approaches to improve its positioning accuracy. For that, it gathers data from the satellites, and two technologies using this technique are currently available: RTK (real-time kinematic) and PPK (post-processing kinematic).
Both bring specific advantages and disadvantages to the accuracy of the collected data. Choosing the one that fits the client’s requirements is the first challenge in providing drone services for the end users.
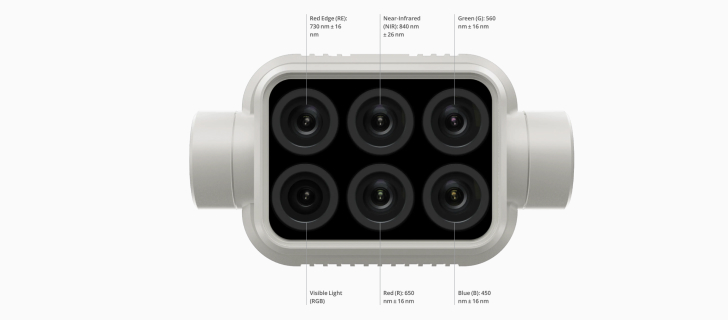
Then, the drones sport a multispectral camera array. It allows analyzing NDVI, SAVI, TSAVI, NSII, and LAI indices of the area, which makes the analytical potential of the technology almost identical to the one provided by satellites.
However, to consolidate the data collected from drones and retrieve useful insights from it, the company turns to third-party software solutions such as DroneDeploy, Pix4Dmapper, RedToolBox, Autodesk Civil 3D, and others. This requires not only expertise and time but also sufficient computing capabilities.
In the case of this company, the drones are able to make images in any weather and with a much higher resolution than current satellites are capable of, but such technological supremacy comes at the higher cost of efforts required to launch the drone, perform the survey and analyze the collected data.
Drones Or Sattech: Is It Really A Choice?
Drones take high-resolution pictures of plot areas much quicker than a group of scouts.
But along with using drones, agricultural businesses will also need a specialist to maintain it and extract actionable insights from the pictures it takes. For instance, in the case of local farmers in Argentina, it might appear as a severe obstacle.
Farmers often make decisions with their hearts, not statistics. So when they see what we’re offering at the exhibitions, they approach us not because of the need but because of curiosity. Farmers still think that drones are the future, not the present.
Tools like EOSDA Crop Monitoring do not require technical expertise to be used and require less effort to be mastered by new users.
Yet again, though different in their nature and tasks they solve, satellite tools and drone imagery are not something that should be compared against each other as competing solutions.
EOSDA Crop Monitoring provides a helicopter view of any plots and historical data about them. And once it spots an issue with one of the areas, a user can assign tasks to people on the ground to investigate it more carefully using drones.
That’s how advanced agricultural businesses might prefer taking the most out of both worlds.
Need a solution tailored to your business goals? Book a call with our team to see how we can help.
Detect crop risks earlier with AI-powered field alerts.
More news
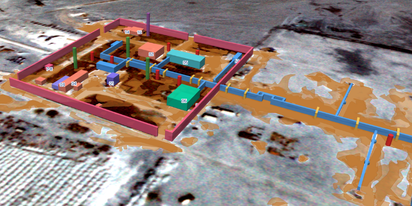
EOSDA tracks construction progress in the UAE PAD areas
Managing rapid industrial expansion in the UAE requires accurate data. See how our satellite-based solution helped a client verify construction milestones and reduce inspection costs.
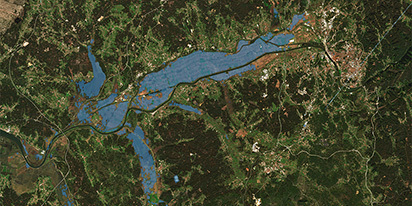
Validating satellite tech for flood analysis and damage mapping in Coimbra
Can satellites improve disaster response? We explored this in the Coimbra district, showing how integrated satellite intelligence can assess flood impacts and fill critical data gaps during a crisis.
EOSDA advances rice field mapping in Indonesia with SAR
EOSDA tested a radar-based approach to improve rice field detection in Indonesia. By integrating SAR and optical data, the team ensured stable monitoring even during peak monsoon months.