MSAVI: Modified Soil Adjusted Vegetation Index
Modified soil adjusted vegetation index (MSAVI) works where other vegetation indices do not – during seed germination and leaf development stages. You can use MSAVI on EOSDA Crop Monitoring to monitor seedlings when there is a lot of bare soil in the field. Seed development is threatened by a number of risks:
- uneven growth
- cold stress & heat stress
- abnormal precipitation
- elevation differences, etc.
MSAVI can be used in remote sensing to detect uneven seed growth. It can be compared to weather data on the graph revealing the correlation between extreme weather and crop health. This knowledge at the early stages of plant development will allow the farmer to readjust their field management practices and get more yields.
What Is MSAVI?
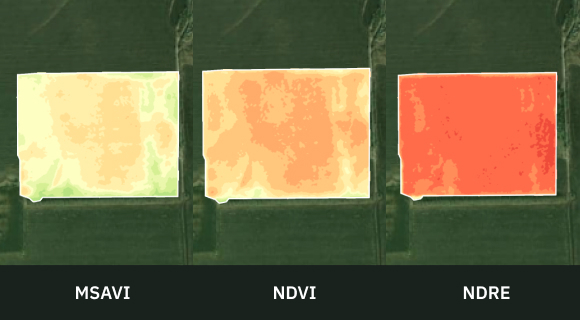
The modified soil-adjusted vegetation index (MSAVI) is an index designed to substitute Normalized difference vegetation index (NDVI) and NDRE where they fail to provide accurate data due to low vegetation or a lack of chlorophyll in the plants.
During the stages of germination and leaf development, there is a lot of bare soil between the seedlings. NDVI and NDRE both interpret this as poor vegetation. Here is where MSAVI comes to aid. “SA” stands for “soil-adjusted,” revealing the key aspect of this vegetation index. It reduces the effect of the soil on the calculation of vegetation density in the field.
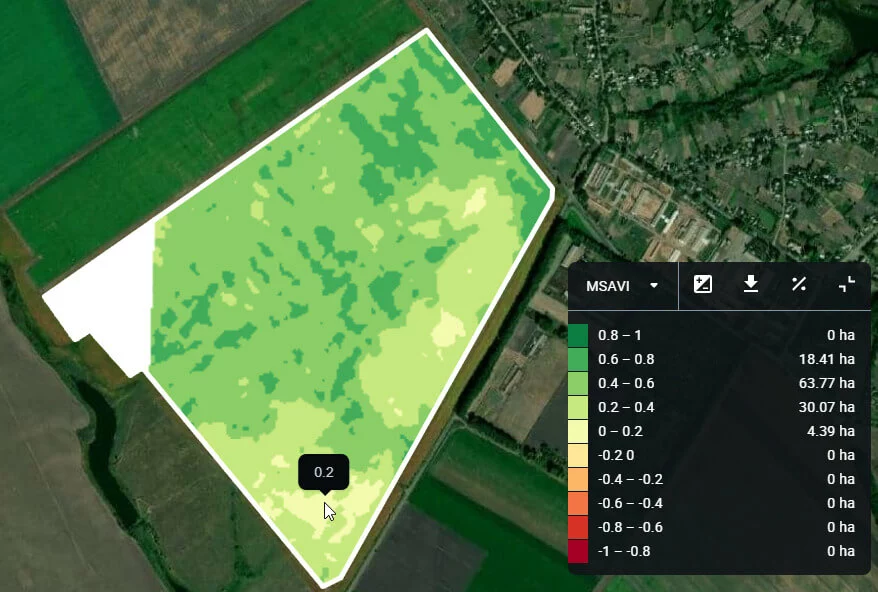
MSAVI Value Range And How To Interpret It
On our agriculture platform, MSAVI values are easy to analyze. It ranges from -1 to 1, where:
- -1 to 0.2 indicate bare soil
- 0.2 to 0.4 is the seed germination stage
- 0.4 to 0.6 is the leaf development stage
When the values go over 0.6, it is now high time to apply NDVI instead. In other words, the vegetation is dense enough to cover the soil.
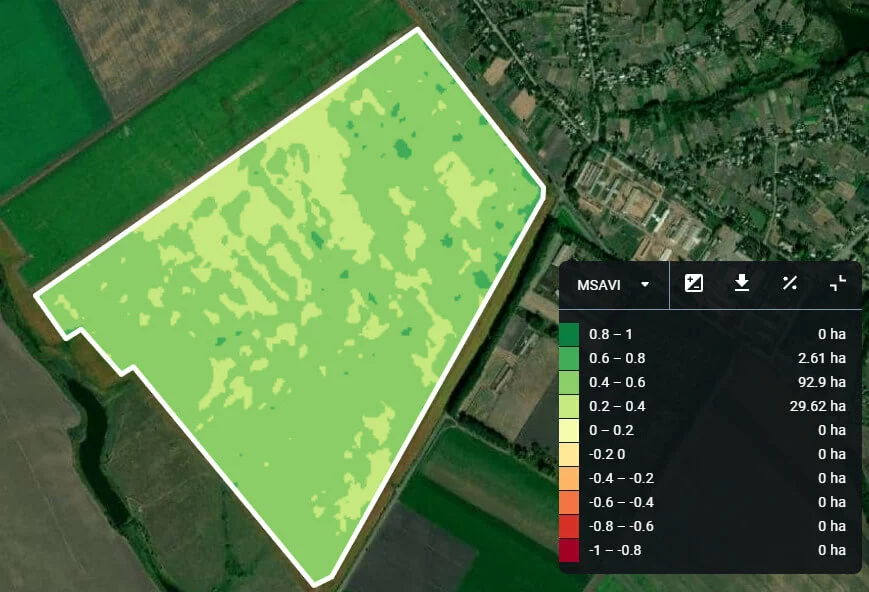
Values and colors
For your convenience, on EOSDA Crop Monitoring, values are displayed on the map as different color hues. The MSAVI value range spans from the bright red representing -1 to the saturated green standing for 1.
EOSDA Crop Monitoring
Performing fields analytics based on relevant satellite data to ensure effective decision-making!
MSAVI As A Problem-Solving Tool
As we have seen, MSAVI works best during the early stages of plant development. This allows EOSDA Crop Monitoring users to more effectively solve the challenges related to sowing and harvesting.
MSAVI Detects Uneven Sprouting
Seeds that have just been sown are vulnerable. They can be eaten by birds and animals. They can rot or get damaged due to unfavorable weather and moisture conditions, among other reasons. Applying MSAVI helps to identify areas within the field where seeds are not germinating. Solution: to resow these problem areas. The sooner it is done, the higher the chance of avoiding the loss of yield.
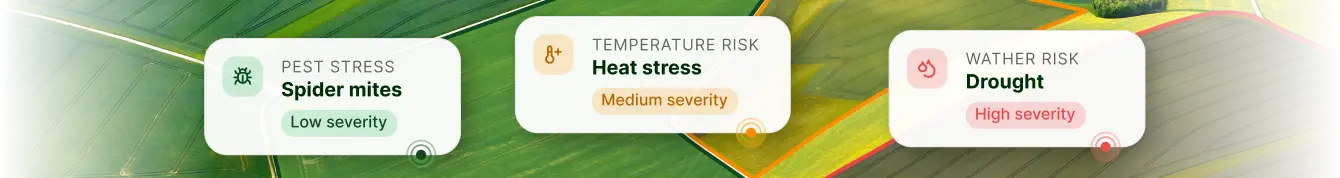
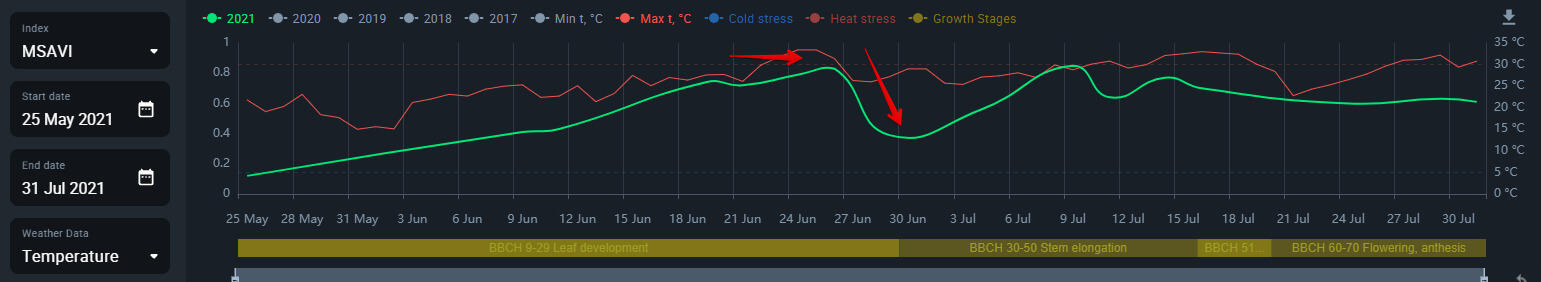
MSAVI Correlation With Cold And Heat Stress
Seedlings are negatively affected by temperatures that are either too low or too high. Such events are called respectively: cold stress and heat stress.
With our 14-day weather forecast available on EOSDA Crop Monitoring, you can anticipate the extreme temperatures in your field and stay alert. Track the temperatures and MSAVI as curves on the graph and react timely when the index drops.
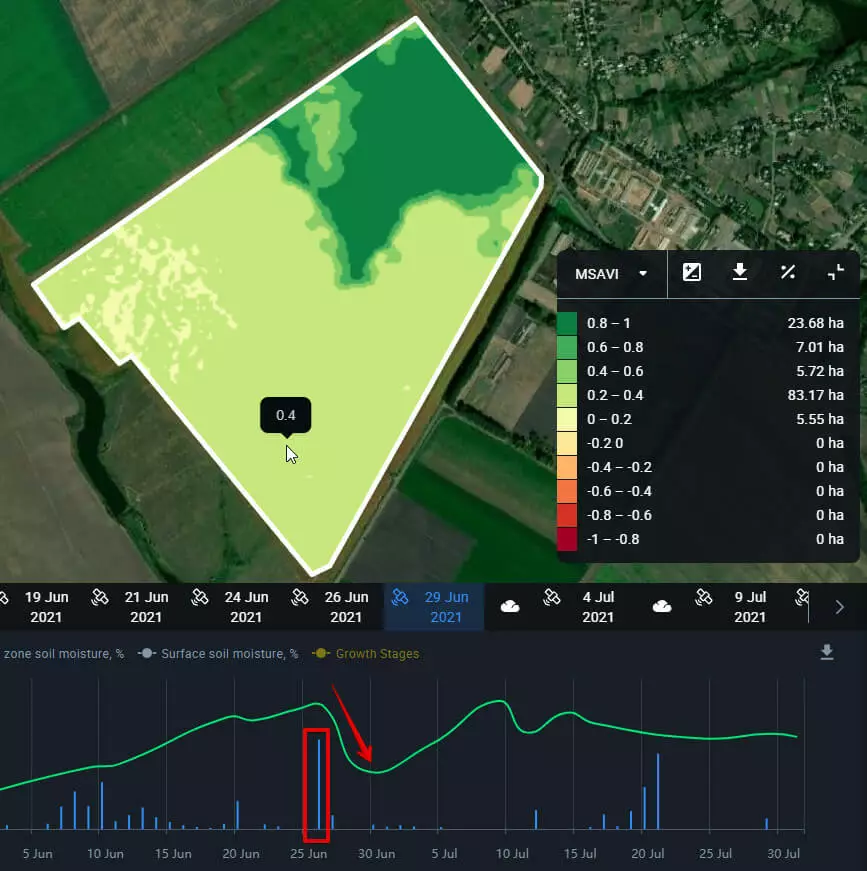
MSAVI And Precipitation
Another threat to the young shoots is too little or too much rain. By studying the history of precipitation on the EOSDA Crop Monitoring graphs, you’ll be able to prepare for drought or flooding conditions. Use MSAVI to see if the abnormal precipitation has actually done any damage to your recently sown crops.
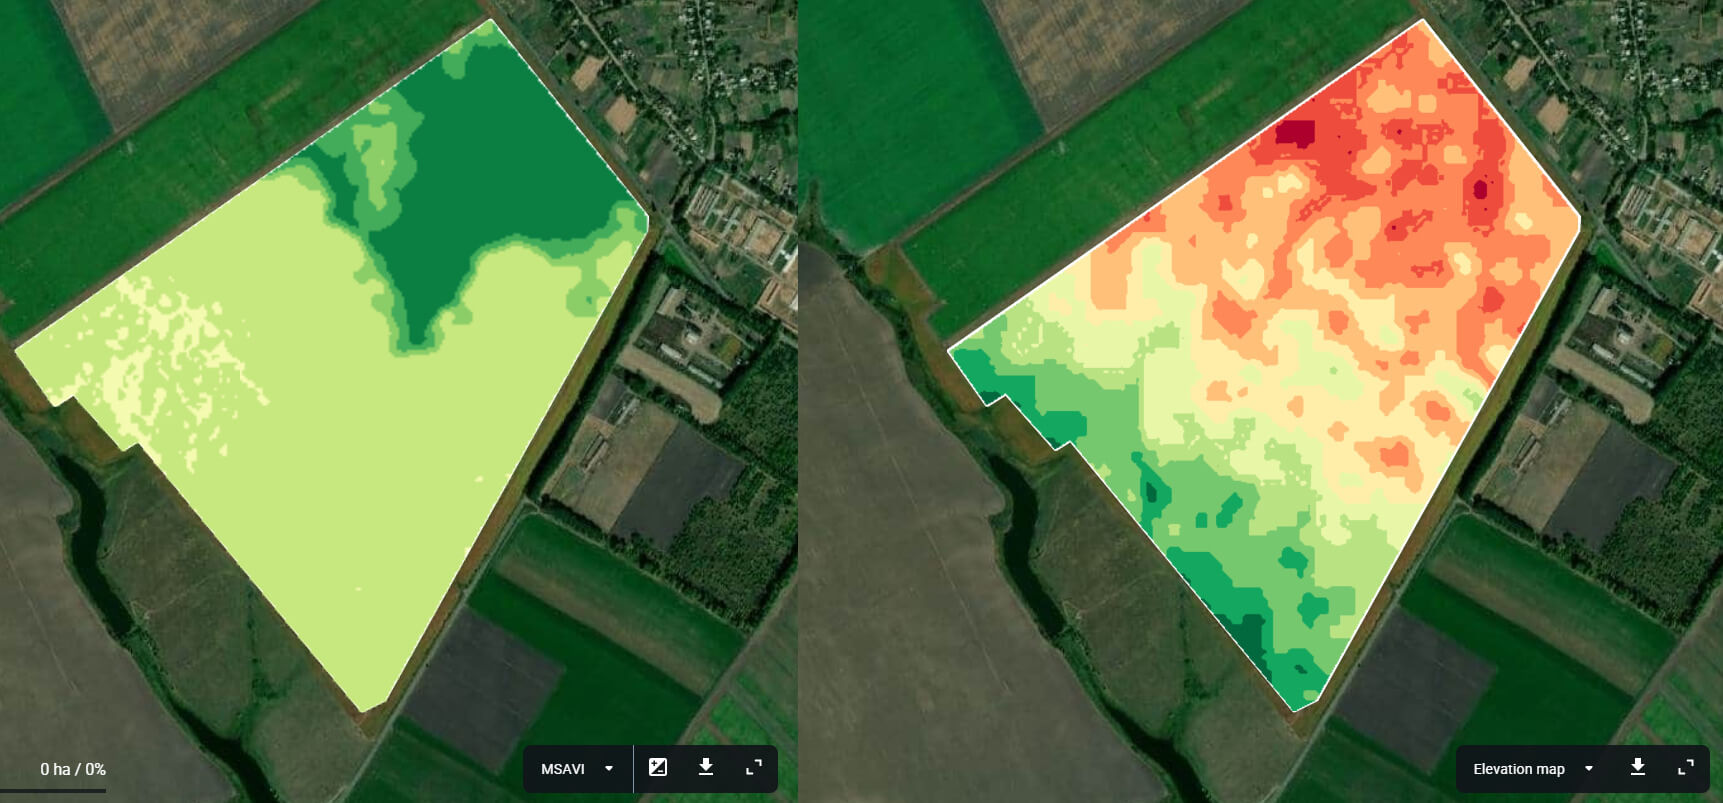
MSAVI And The Field Elevations
Differences in elevation can have a dramatic effect on plant development as well. Low areas can experience more flooding, affecting the flood-sensitive crops. Besides, many types of fungi thrive in the field’s waterlogged areas, causing further damage to the crop.
To see if the elevation differences have any serious effect on the growing crops, compare the MSAVI map to the Elevation map of a given field.
Growing A Crop On A New Field
It’s a good rule of thumb to use this index when you are growing a crop on a new field for the first time. MSAVI helps understand whether the elevation differences have any influence on the development of the plant at the earliest stage. This will allow you to take proper actions in time, and thus prevent the loss of yield and profit in the future.
Growing A New Crop On An Old Field
Similarly, elevation differences can have an effect on crop rotation. For example, successful repeated wheat cultivation in the same field does not guarantee that soybean will behave as spectacularly. Soybean’s sensitivity to flooding is much higher compared to that of wheat. Lower elevations will have a considerably bigger impact on soybean’s growth. MSAVI comes in handy here, revealing the areas of the field with stagnated growth.
Such valuable MSAVI-based insights help to decide on the most suitable crops for a certain field and understand how to manage crops in specific zones of this field.
Field Activity Monitoring Using MSAVI
When field activities during early growth stages go amiss, MSAVI will show a drop in crop health. The reasons why something went wrong can vary from leaf damage by fertilizers to excessive or insufficient irrigation. Whatever the issue, the index will get your attention right in time to fix it.
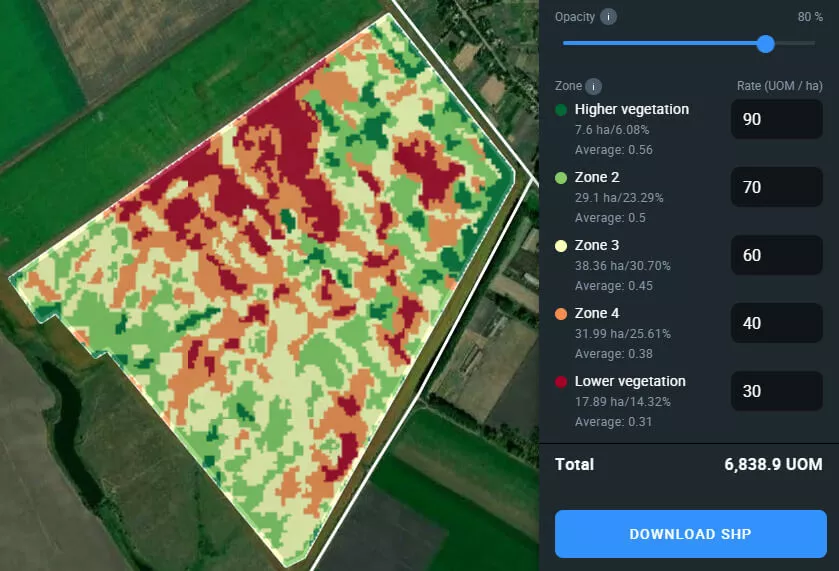
MSAVI-Based Fertilizer Application
After the field has been sown, the areas of lower productivity might require fertilization. On EOSDA Crop Monitoring, you can build a vegetation map based on the MSAVI data. This works just like with NDVI-based maps, the only difference being the time of the season. It will allow you to apply different rates of fertilizer according to the unique needs of each area within the field.
How MSAVI Helps Right Before Harvesting
The latest growth stage of many crop types, including sunflower,
corn, soybean, and others, is very similar to germination in terms of light reflectance.
As the plants are ripening, their chlorophyll content decreases, “puzzling” the NDRE index. Similarly, NDVI values are becoming less accurate as well due to the visible withering of the plants, which, in turn, exposes the soil. In this case, MSAVI will provide the most accurate data about the health of your crops.
Stay Informed About Crop Health With MSAVI
The modified soil-adjusted vegetation index is an indispensable tool in situations when the crops are only beginning to grow. Where NDVI and NDRE lack accuracy, MSAVI provides a valid picture of crop health.
On EOSDA Crop Monitoring, this index can be used to detect uneven germination, drop in vegetation health due to cold and heat stress, or incorrect fertilizer application and other reasons. On the basis of MSAVI, you can create vegetation maps for an early-season variable rate application. As a bonus, the index can be applied when the crops are just about to be harvested.
It is easy to use and is the perfect tool for monitoring crops at the early growth stages.