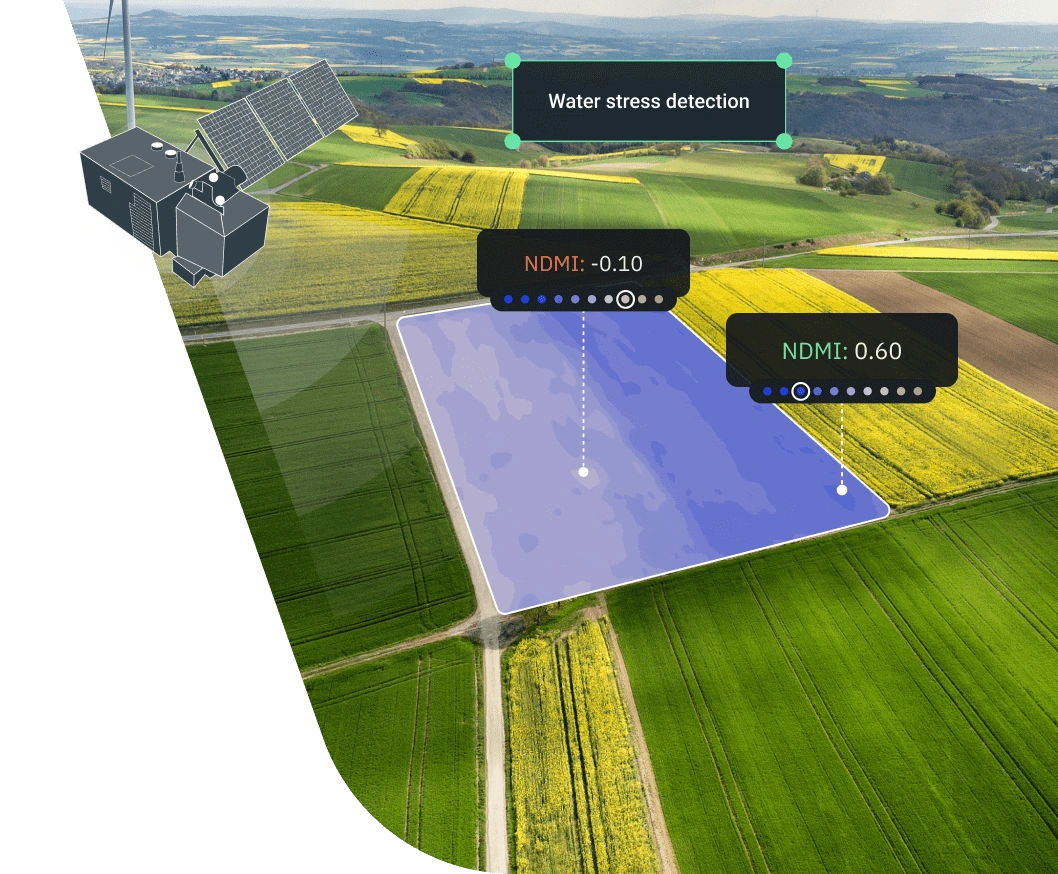
NDMI Index For Proactive Water Stress Management
The Normalized Difference Moisture Index (NDMI) is a go-to method for detecting water stress in crops and optimizing irrigation. It determines vegetation water content by combining near-infrared and short-wave infrared reflectance in a scientifically proven formula.
NDMI vegetation index allows you to:
- Monitor crop water content throughout the growing season
- Detect early signs of drought/waterlogging stress in specific field zones
- Plan and fine-tune irrigation schedules in response to moisture changes
- Map combustibility in fire-prone orchards or tree-covered lands
- Irrigate fields at a variable rate based on actual crop needs
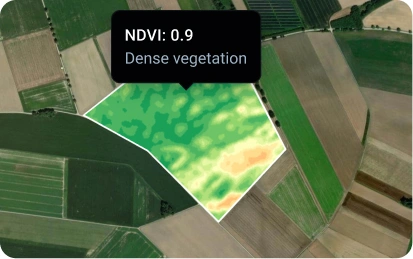
NDMI vs NDVI and NDWI: What each index shows
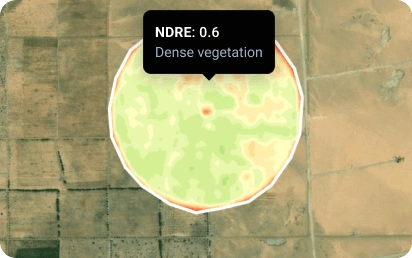
Targets moisture within vegetation, helping detect areas with hidden or early drought/waterlogging stress. Ideal index for irrigation planning and drought monitoring.
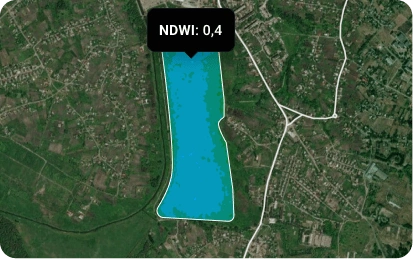
Designed to detect surface water bodies and flooded zones. Less effective for assessing internal plant moisture.
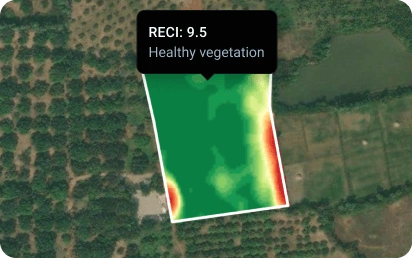
Measures how green, healthy, and vigorous plants are, but not how hydrated. Not enough when drought or waterlogging are your main concerns.
Normalized difference moisture index in action: Top uses for agriculture
Detecting early water stress during drought
A sunflower farmer in southern Spain went through an unusually dry season. Despite regular irrigation, they observed uneven crop growth and were wondering about the reason. Studying NDMI maps over time helped spot a gradual decline in index values in certain areas, signaling early moisture deficit. The farmer used this NDMI water stress information to build a variable irrigation plan with the VRA Map builder, with extra water prescribed for the struggling areas.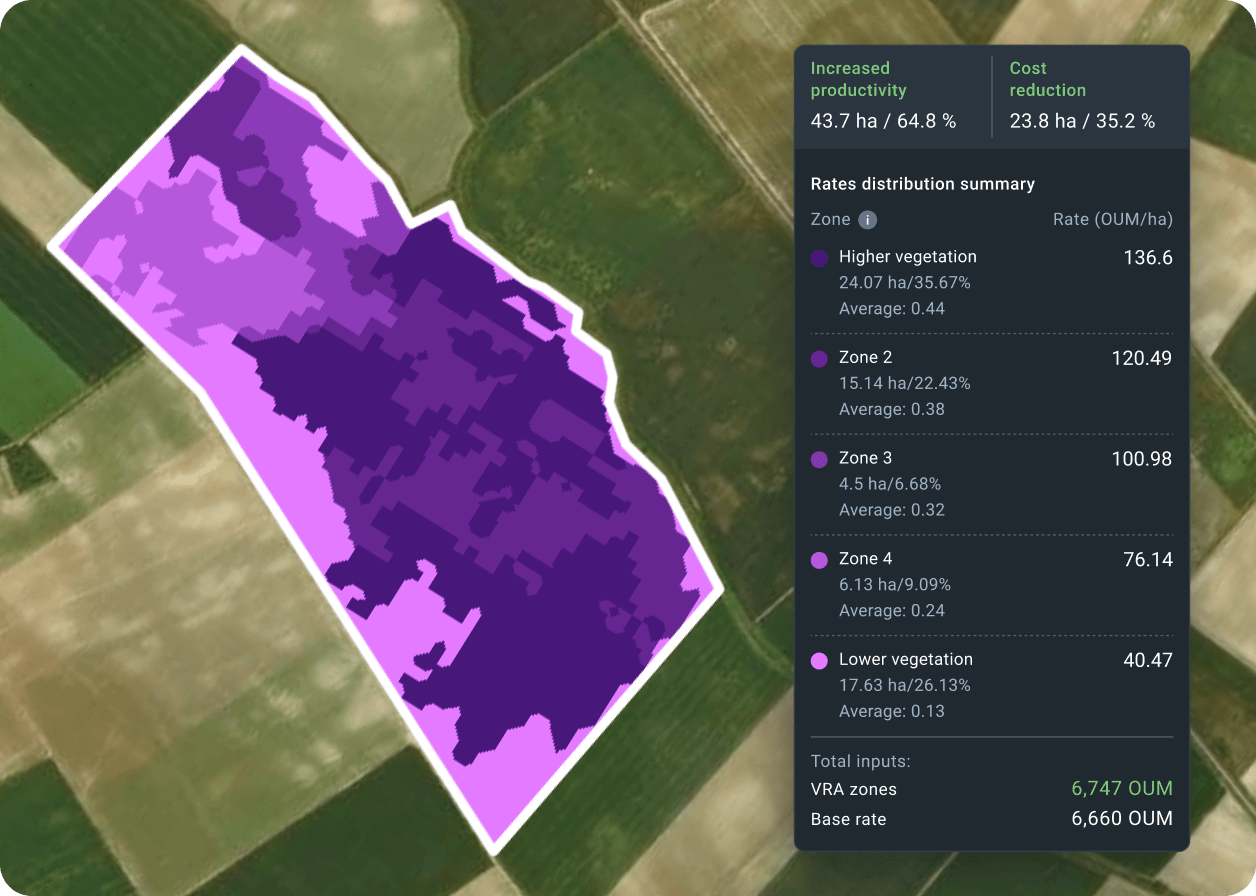
Mitigating waterlogging after heavy rain
After several days of intense rain, a grain producer in Poland dealt with flooding in some low-lying areas. The damage wasn’t obvious at first, but NDMI remote sensing showed a sharp spike — clear evidence of waterlogging.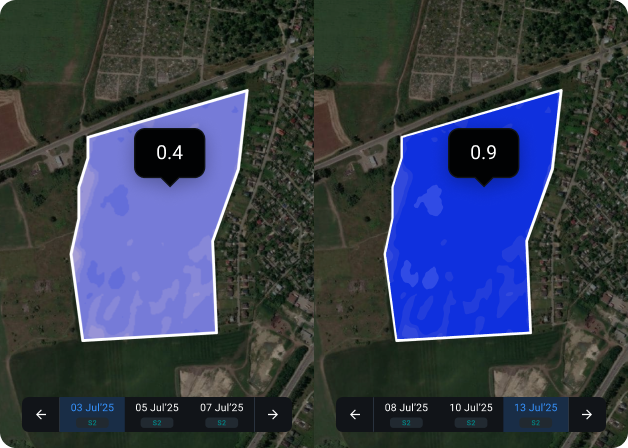
Prioritizing harvest zones by moisture level
A California avocado grower needed to make sure trees didn’t dry out before harvest. Normalized difference moisture index helped track moisture levels across the orchard, and when they began to drop in certain areas, those areas were moved to the top of the harvest list.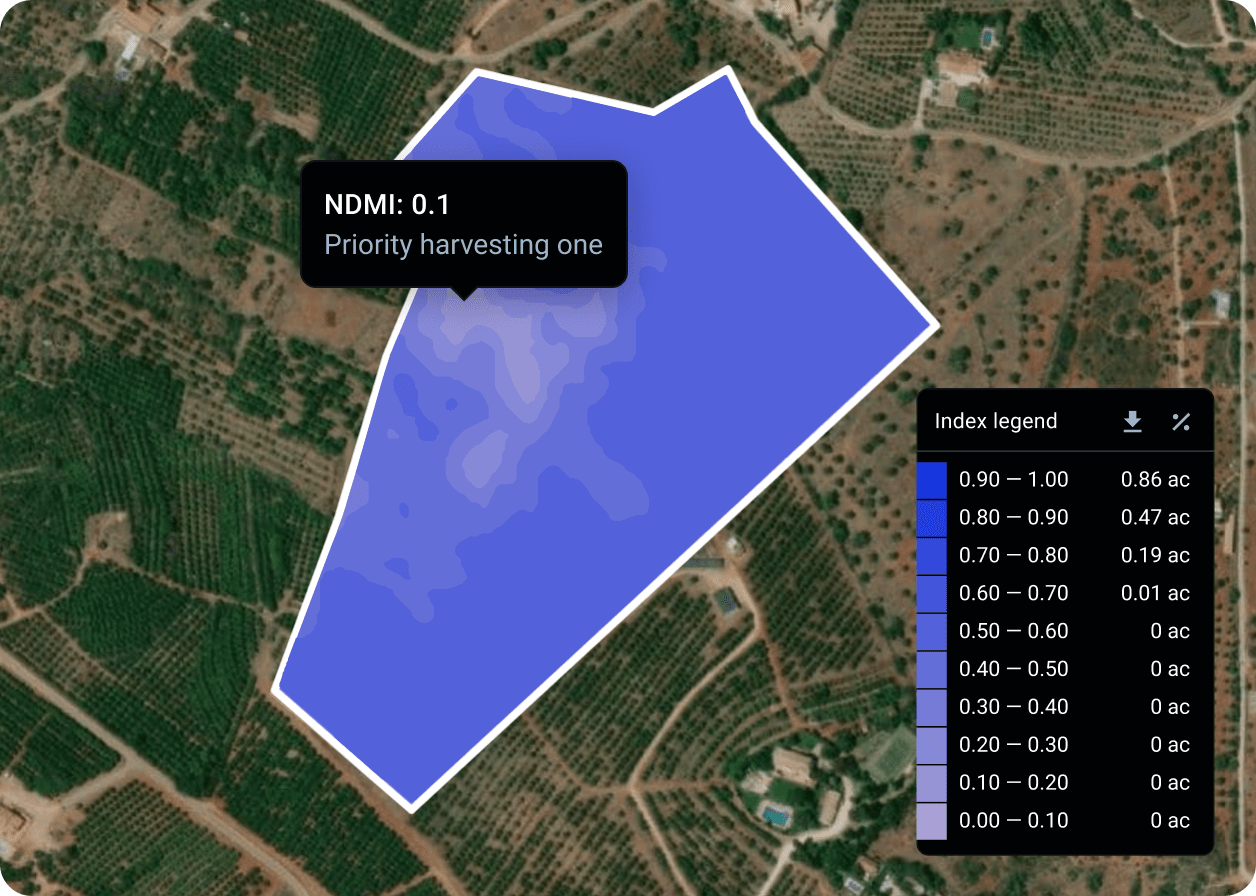
Reduce fire risk in dry grasslands
Wildfire is a constant threat in Australia’s drylands, but it’s not always easy to know when conditions become really dangerous. A rancher in central Australia saw normalized difference moisture values (and thus crop moisture content) across surrounding drylands fall sharply over just a few weeks.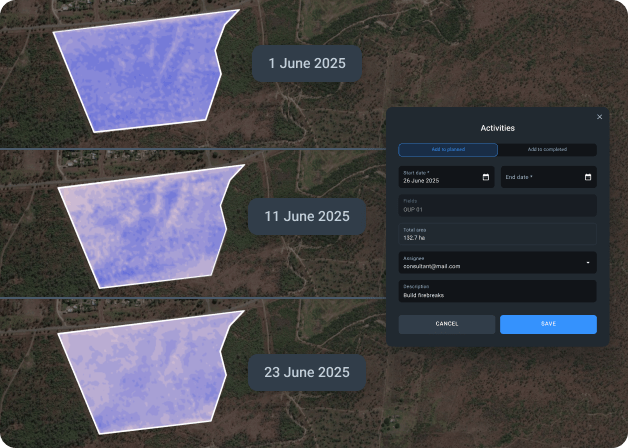
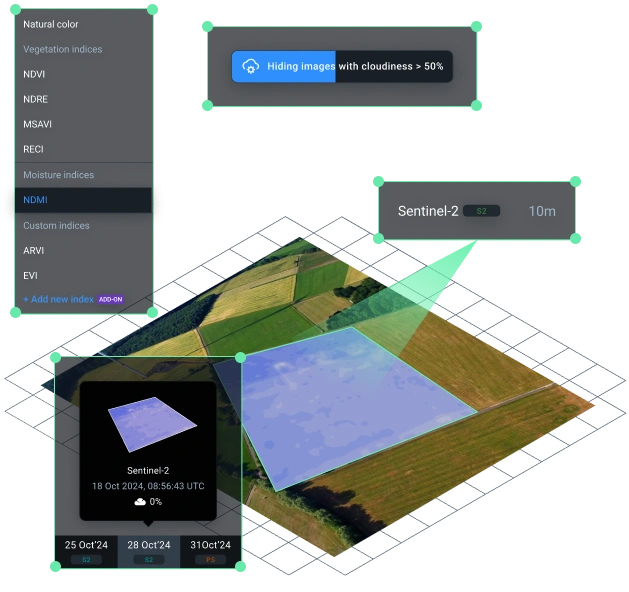
Why use the NDMI index on EOSDA Crop Monitoring?
Satellite-based NDMI index maps powered by 10m-resolution Sentinel-2 imagery
Regular index updates every 3–5 days
Historical trends to compare dynamics between seasons
Field-level and regional-level moisture insights
NDMI-driven VRA map generation for smarter input distribution
Access to cloud-free NDMI-processed images via the platform or app
Go beyond NDMI-based water stress management with smart index selection
The normalized difference moisture index efficiently assesses crop water content, but does not capture the full range of crop conditions. For broader monitoring (including crop health, growth, and stress), try other vegetation indices that are just a click away:
FAQ about the NDMI index
NDMI index basics
What does NDMI mean?
NDMI means Normalized Difference Moisture Index — a satellite-based index used to measure vegetation water content.
What is the NDMI formula for Sentinel-2?
The normalized difference moisture index formula for Sentinel-2 is (B8 - B11) / (B8 + B11), where B8 is the near-infrared (NIR) band and B11 is the short-wave infrared (SWIR) band.
What is the NDMI formula for Landsat 8?
The normalized difference moisture index formula for Landsat 8 is (Band 5 - Band 6) / (Band 5 + Band 6), where B5 stands for the NIR band and B6 for the SWIR band.
How to interpret values within the NDMI range?
Higher values of the NDMI index (within the range from -1 to +1) indicate healthy, well-watered vegetation, while lower values suggest dryness or drought stress:
- -1 to -0.8: bare soil;
- -0.8 to -0.6: almost absent canopy cover;
- -0.6 to -0.4: very sparse canopy cover;
- -0.4 to -0.2: sparse canopy cover, dry or very sparse canopy cover, wet;
- -0.2 to 0: moderate-sparse canopy cover, high water stress or sparse canopy cover, low water stress;
- 0 to 0.2: average canopy cover, high water stress or moderate-sparse canopy cover, low water stress;
- 0.2 to 0.4: moderate-high canopy cover, high water stress or average canopy cover, low water stress;
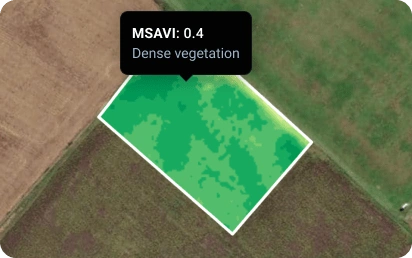
- 0.4 to 0.6: dense canopy cover, no drought stress;
- 0.6 to 0.8: very dense canopy cover, no drought stress;
- 0.8 to 1: full canopy cover, no drought stress/waterlogging.
NDMI index usage in agriculture
How does NDMI differ from NDVI?
NDMI detects vegetation moisture, while NDVI measures vegetation greenness and biomass. Use the normalized difference moisture index for detecting drought/waterlogging and planning irrigation, and NDVI for monitoring general crop health.
How to compare NDMI vs. NDWI?
NDMI shows water content within vegetation, while NDWI highlights open water bodies and soil moisture. Normalized difference moisture index works better for crop stress analysis, and NDWI for mapping surface water.
What is NDMI’s role in moisture stress detection?
The normalized difference moisture index helps detect crop moisture stress early by analyzing changes in leaf water content. This index is useful for precision irrigation and drought response.
What crops benefit the most from NDMI tracking?
Water-sensitive crops benefit the most from NDMI-based tracking. These are corn, wheat, rice, and vegetables, where the index helps optimize irrigation and prevent drought- or waterlogging-related yield loss.
Can I access NDMI via an API?
Yes, you can access index data via API on platforms like EOSDA Crop Monitoring to seamlessly integrate it with your farm management systems or analytics tools.