Normalized Difference Water Index (NDWI)
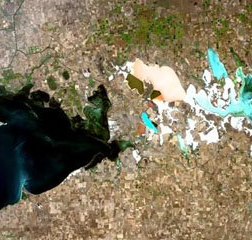
The Normalized Difference Water Index (NDWI) is used to highlight open water features in a satellite image, allowing a water body to “stand out” against the soil and vegetation.
Since the NDWI index effectively measures moisture content, it is often compared with the NDMI index, also known as NDWI GAO. In fact, there is a major difference in how the two are calculated and used. The NDMI makes use of the NIR-SWIR (near-infrared and short-wave infrared) combination to enhance the presence of water in leaves of plants. The NDWI, on the other hand, is calculated using the GREEN-NIR (visible green and near-infrared) combination, which allows it to detect subtle changes in water content of the water bodies.
The NDWI index was proposed by McFeeters in 1996. Its primary use today is to detect and monitor slight changes in water content of the water bodies. Taking advantage of the NIR (near-infrared) and GREEN (visible green) spectral bands, the NDWI is capable of enhancing the water bodies in a satellite image. The downside of the index is that it is sensitive to built structures, which can lead to overestimation of water bodies.
How To Calculate NDWI
The NDWI equation looks like this:
NDWI = (Green – NIR)/(Green + NIR)
- For Landsat 7 data:
NDWI = (Band 2 – Band 4)/(Band 2 + Band 4)
- For Landsat 8 data:
NDWI = (Band 3 – Band 5)/(Band 3 + Band 5)
- For Sentinel 2 data:
NDWI= (Band 3 – Band 8)/(Band 3 + Band 8)
The visible green wavelengths maximize the typical reflectance of the water surface. The near-infrared wavelengths maximize the high reflectance of terrestrial vegetation and soil features, while minimizing the low reflectance of water features.
The result of the NDWI equation is positive values for water features and negative ones (or zero) for soil and terrestrial vegetation.
How To Interpret NDWI Values
Values of water bodies are larger than 0.5. Vegetation has much smaller values, which results in distinguishing vegetation from water bodies easier. Built-up features have positive values between 0 and 0.2.
- 0,2 – 1 – Water surface,
- 0.0 – 0,2 – Flooding, humidity,
- -0,3 – 0.0 – Moderate drought, non-aqueous surfaces,
- -1 – -0.3 – Drought, non-aqueous surfaces
NDWI Applications
Whenever there is a need to detect a water body, sharpen its outline on the map, and monitor changes in its clarity, the NDWI index is applied. Beyond the visible spectrum towards the infrared, water reflects almost no light. The NDWI makes use of this property to successfully outline water bodies on the map and monitor water’s turbidity.
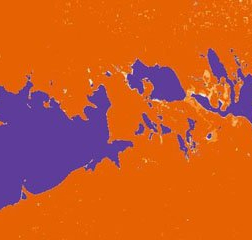
NDWI Visualization
Data extracted from a satellite image using the NDWI index is visualized as maps using a color palette and graphs to show how values change over time as a curve. On a map, the higher values approaching +1 usually appear blue and correspond to either a high water content or a water surface, while the lower values all the way to -1 are the tell-tale signs of drought conditions, unless the area of interest is a non-aqueous surface.