Chlorophyll Index In Agriculture
The chlorophyll index (CI) is applied to calculate the total amount of chlorophyll in plants. In general, this index contains two separate bands: CIgreen and CIred-edge. These bands are responsive to slight variations in the chlorophyll content and are consistent for most types of plants.
In other words, the CI is a relatively accurate indicator of plant health and can be effectively used in nutrient management throughout the season. The data obtained thanks to this vegetation index also allows for season-to-season planning.
Chlorophyll Index As An Agriculture Algorithm
Chlorophyll index plays a very important role in modern agriculture. To understand just why it is so, we need to get a better look at the chlorophyll itself.
Chlorophyll is a pigment that gives plants their characteristic green color. Plants rely on it to survive as it absorbs sun light which is then converted into sugars and starches via a process called photosynthesis. Thus, chlorophyll is a good indicator of a plant’s health.
By measuring the spectral reflectance of chlorophyll in plants from space, we can monitor the state of crops on a regular basis. For this, the chlorophyll vegetation index is used.
Interpreted correctly, the CI can provide food producers with crucial information about crop development. This information can be used to increase the field productivity, thus getting better yields and higher profits.
The applications of the chlorophyll index in precision agriculture are diverse:
- Identification of nutrient deficiencies in plants
- Nitrogen fertilizer uptake assessment
- Yield prediction
- VRA prescription mapping and more.
And farmers are not the only ones who can benefit from using a CI. Input suppliers need to monitor the health of crops to test the performance of their inputs. The insurers can use the index to predict yield and base their loan payments on objective data. Ag cooperatives find it easier to adjust their fertilizer plans over a large number of fields with the help of chlorophyll index data. Possibilities are endless.
There are several varieties of CI in use today.
Green Chlorophyll Index (CIgreen Or GCI)
The so-called green chlorophyll index’s main strength is that it can be successfully used for a wide range of plant species. GCI index is calculated as a ratio of the chlorophyll’s reflectance in the NIR band over the reflectance in the green band.
The green chlorophyll index formula loks like this:
CI green = ρNIR / ρgreen – 1 = ρ730/ρ530 – 1.
Red-Edge Chlorophyll Index (CIred-Edge Or RCI)
CIred-edge takes advantage of a narrow spectral band between the red and the near-infrared (NIR) bands of the plant reflectance range. The red-edge chlorophyll index is calculated using this band.
CI red-edge = ρNIR/ρred_edge – 1 = ρ850/ρ730 – 1
The red-edge band is highly sensitive to the light reflected off of the cellular structure of a plant. Brighter reflectance corresponds to a larger number of plant cells and, by extrapolation, to the greener area.
Vegetation maps for variable rate application built based on the RCI index can be more precise than the NDVI-based maps. This is due to the high saturation of NDVI data in the images. The saturation occurs because NDVI is used to estimate the density of the biomass, which does not always correlate with crop health. It has been discovered by some growers that the need for swapping the NDVI for the chlorophyll index arises when the canopy closure is around 80% – about the time of the early phases of senescence. During this time, measuring the chlorophyll content in plants is a more reliable way of determining the state of crops.
Merris Terrestrial Chlorophyll Index (MTCI)
The MERIS terrestrial chlorophyll index (MTCI) is calculated using three very specific red/NIR wavelengths (681.25, 708.75 and 753.75 nm).
MTCI = (754nm−709nm) / (709nm−681nm)
This index is more sensitive to high chlorophyll content compared to NDVI and is easy to calculate, which justifies its use in precision agriculture.
MCARI Index
Modified Chlorophyll Absorption in Reflectance Index picks up on the variations in chlorophyll content in plants.
It is calculated thus:
MCARI = ((ρ850-ρ710) – 0.2 × (ρ850-ρ570)) / ρ710
MCARI index is especially useful whenever there are high levels of background reflectance from soil and other objects in the satellite imagery. To achieve the highest accuracy of remote analysis of plant health, MCARI should be used together with NDVI or LAI.
Chlorophyll Index On EOSDA Crop Monitoring
Great accuracy in crop health monitoring has made the chlorophyll index a common remote sensing tool. Its use in precision agriculture is highly beneficial for growers.
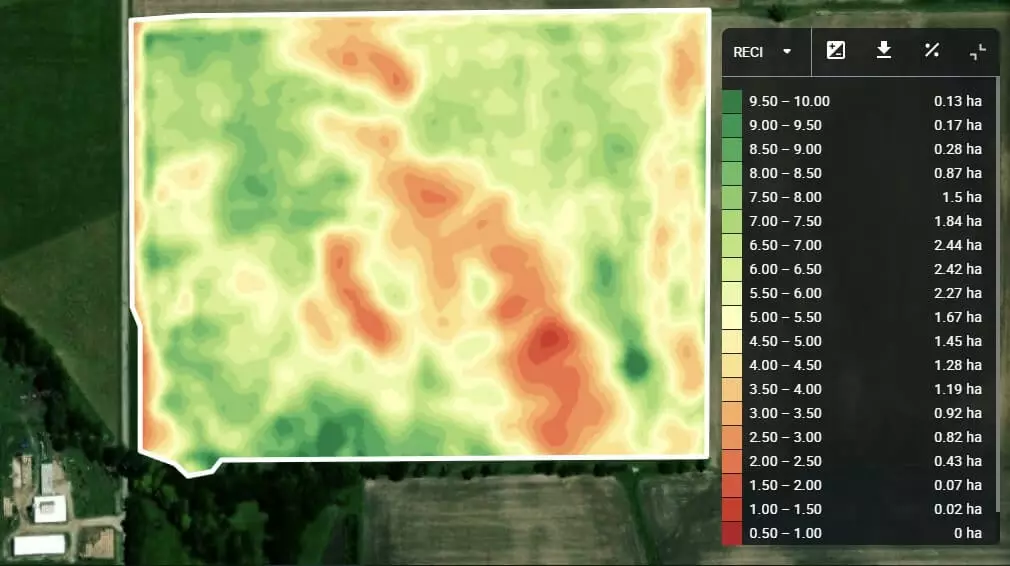
Among other vegetation indices, the EOSDA Crop Monitoring platform employs a chlorophyll index based on the red-edge band – ReCl. It can be used in a number of ways. For example, to create a precise map of a field for variable-rate application of fertilizers. We take multispectral high-quality satellite imagery of fields, apply algorithms, and calculate the ReCl of crops. It may sound a little complicated, but the user can create a ReCl vegetation map literally in just a few clicks. It is also important that ReCl maps be used during the active vegetation development stages, prior to the early phases of senescence, for maximum efficiency. But closer to harvesting, we recommend using NDRE.
Vegetation map below clearly shows the field divided into several vegetative zones based on the ReCl index values of each area. Values 0 through 5 may indicate plants with a low level of photosynthesis. Sending a scout to the area for a detailed check up to understand the causes of the crop stress in this case would be a good idea.
The red-edge chlorophyll index on EOSDA Crop Monitoring is a built-in, automated feature that does the calculations for you at a press of a button. Thanks to regular access to the latest high-quality satellite imagery of your fields and well-trained processing algorithms, the platform allows building more efficient fertilizing and precision irrigation strategies. And besides the CI the platform offers several other vegetation indices (NDVI, NDRE, MSAVI) that can be used to build vegetation and productivity maps, monitor the state of crops, and more.