Azerbaijan has designated agriculture as one of four priority industries for diversifying its economy. Although the sector accounted for only 5.88% of GDP in 2021, it employed 36% of the population. Local produce has strong brand recognition in markets of post-Soviet states and often sells at a premium. The governmental support for the sector includes grants, tax benefits, and subsidies for machinery, fertilizers, and pesticides.
Field-scale, regional, and country-wide crop yield prediction is indispensable for agricultural research, farm management, and import and export decision-making.
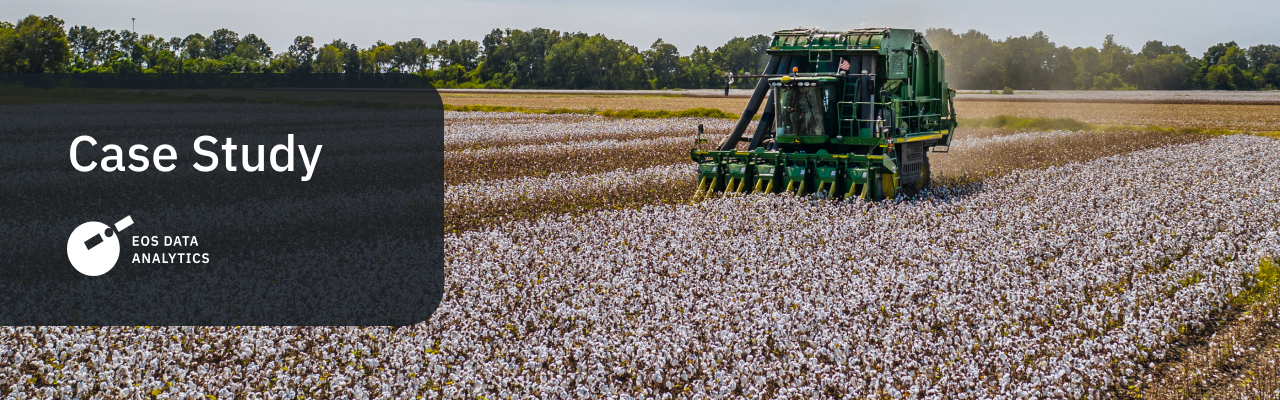
This case study will discuss how EOSDA forecasted tobacco and cotton yields for the 2018 growing season based on the WOFOST model’s outputs.
Azerbaijan has designated agriculture as one of four priority industries for diversifying its economy. Although the sector accounted for only 5.88% of GDP in 2021, it employed 36% of the population. Local produce has strong brand recognition in markets of post-Soviet states and often sells at a premium. The governmental support for the sector includes grants, tax benefits, and subsidies for machinery, fertilizers, and pesticides.
Field-scale, regional, and country-wide crop yield prediction is indispensable for agricultural research, farm management, and import and export decision-making.
This case study will discuss how EOSDA forecasted tobacco and cotton yields for the 2018 growing season based on the WOFOST model’s outputs.
Challenge: Finding The Optimal Method Of Predicting Yields For Cotton And Tobacco On A District Level
The project was large-scale and included the classification of several crops, besides cotton and tobacco yield prediction, which we carried out. The forecast had to be made for fields in two districts in Azerbaijan — Shaki and Sabirabad.
Cotton, often called the country’s “white gold,” has a long tradition of cultivation. Its production peaked during the Soviet period. In 1981, Azerbaijan’s share in the USSR cotton farming reached almost 10%, which amounted to 1.5% of global production . Following the collapse of the Soviet Union, it dropped (Azerbaijan’s focus on the petroleum industry was a concomitant factor, too.) Searching for promising sources of income after the 2014–2016 global surge in oil prices, the Republic of Azerbaijan resumed its interest in the cotton sector . Compared to the 2015/2016 market year, the cotton area in 2022/2023 has quadrupled, while yield per hectare increased by about 1.6 times .
Shaki is a part of the Shaki-Zaqatala economic region that relies on agriculture, including tobacco farming. The Azerbaijan authorities have also emphasized the importance of cultivating the crop, given its export potential .
Solution: Analyzing Statistical, Meteorological, Soil, And Phenology Data With The WOFOST Model
A customer provided statistical information on cotton and tobacco yields at the district level from 2000 until 2017.
The team, in turn, collected the remaining data. It included:
- Statistics indicating the features of crop cultivation necessary for a model to make predictions or calculations
- Geographic location of fields and their areas
- Dates of transplantation of tobacco plants from greenhouses or seedbeds.
- Meteorological data (humidity, precipitation, wind speed, maximum and minimum temperatures) from the Global Telecommunication System (GTS) and some specific models estimating of evapotranspiration and global radiation.
- Soil (soil moisture content and rooting depth) data.
In addition, the project team found the optimal sowing/transplantation dates for tobacco and cotton for 2010–2018.
Historical weather data is also indispensable for such tasks. Specialists sourced it from NASA POWER datasets. Meteorological parameters in NASA POWER datasets are taken from NASA’s Modern Era Retro-analysis for Research and Applications (MERRA-2) and the GEOS version 5.12.4 assimilation models . MERRA-2 is a new version of the Goddard Earth Observing System (GEOS) developed at the Global Modeling and Assimilation Office (GMAO) at NASA’s Goddard Space Flight Center.
The GEOS 5.12.4 data are processed daily and appended to the end of the MERRA-2 daily time series to provide low latency data products which are generally ready within about 4 days. The MERRA-2 values in the resulting daily time series are typically updated every several months. So, these data products can be used as real-time ones and are especially valuable for tasks related to yield forecasting.
The scientists used WOFOST, World Food Studies Simulation Model, for data analysis . It’s a mechanistic model for the quantitative analysis of the growth and production of annual field crops based on basic processes like photosynthesis, respiration and the dependence of these processes on environmental conditions.
We have long experience working with this proven model. Moreover, it is suitable for numerous crop types.
Yield for each crop was predicted in three steps.
Step 1: Adapting Model Parameters
The specialists had to adjust several model parameter values to estimate cotton and tobacco biomass with the WOFOST model while considering climate and soil conditions.
Step 2: Making Simulations To Estimate Crop Biomass For 2010–2017
Team members ran WOFOST in the Python Crop Simulation Environment. Crop simulation represents an interaction between the plant and the environment in which it grows. Thus, any crop growth model predicts the final state of total biomass or harvestable yield while containing quantitative information about major factors involved in crop growth and development (soil state, crop management like sowing, irrigation, or fertilizer application).
As a result, the specialists calculated DVS (development vegetation stage), TAGR (total aboveground biomass), LAI (leaf area index), SM (soil moisture), TWLV (total weight of living leaves), and TWSO (total weight of storage organs).
Step 3: Estimating Cotton And Tobacco Yields For 2018
The team chose a statistical approach for yield forecasting. In the first step, they calculated the TWLV of tobacco and TAGR of cotton as of July 1, 2018, with specific DVS values. After that, the scientists counted these crop parameters for 2010–2017 and chose the same DVS values to find a linear relationship between calculated biomasses and actual statistical yield for each grid in the Shaki and Sabirabad districts.
A standard error for predicted tobacco yields for 2010–2017 was 0.7 centners per hectare. The specialists used historical data to validate the chosen yield forecasting method as actual data wasn’t available at the time. One could interpolate this error to the 2018 results. As for cotton, it was from 1.5 to 1.9 centners per hectare, depending on a grid.
Outcome: Yield Forecasting For Cotton And Tobacco
The project team prepared the report with forecasted yields of tobacco for fields in the Shaki region and cotton yields for farmlands in the Sabirabad district for the 2018 season.
We began working on the project in April 2018 and presented results in October the same year. Although data collection and analysis took us roughly three weeks, we had to wait until the end of tobacco and cotton growing seasons: It was important for the client to compare our calculations with actual crop yields.
Need a solution tailored to your business goals? Book a call with our team to see how we can help.
Turn high-tech satellite data into actionable solutions for your business.

More news
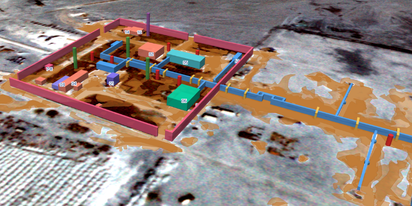
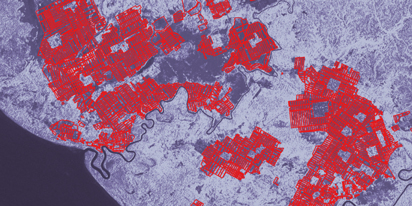
EOSDA tracks construction progress in the UAE PAD areas
Managing rapid industrial expansion in the UAE requires accurate data. See how our satellite-based solution helped a client verify construction milestones and reduce inspection costs.
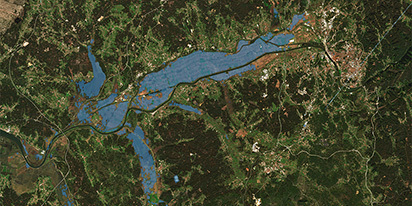
Validating satellite tech for flood analysis and damage mapping in Coimbra
Can satellites improve disaster response? We explored this in the Coimbra district, showing how integrated satellite intelligence can assess flood impacts and fill critical data gaps during a crisis.
EOSDA advances rice field mapping in Indonesia with SAR
EOSDA tested a radar-based approach to improve rice field detection in Indonesia. By integrating SAR and optical data, the team ensured stable monitoring even during peak monsoon months.