Earth observation from space helps us to anticipate highly unpredictable factors like weather, crop yields, and extreme climate conditions. Government organizations and business entities are striving to make data-driven decisions whenever possible to mitigate the consequences of natural disasters. The lack of data is not an issue anymore: everyone has access to free weather forecasts and satellite imagery of their locations. But does it help to derive valuable conclusions?
The EOS Data Analytics team is committed to the UN’s Sustainable Development Goals, including Climate Action. We have developed a flood detection technology, which makes it possible to monitor the threat of floods and easily determine the areas where such floods might occur without having to dive into statistical models.
Our scientists train custom machine-learning models on existing data about floods over the past few years so that they could make future predictions with over 90% accuracy. Beyond that, they can also estimate the probability of active snowmelt and the likely flood onset dates. These models depend on meteorological data, that’s why the output is highly specific to every location. Let’s review the training process and the results of one of our projects for spring flood detection in the Northern Kazakhstan region.
Overview: The Spring Floods In Kazakhstan
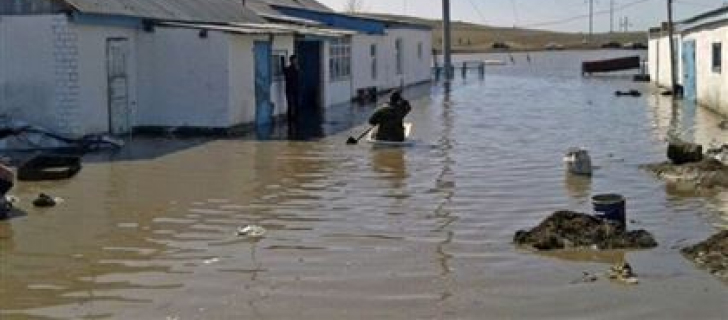
Early spring in Kazakhstan brings rapid snowmelt every year. Due to the sudden increase in temperature, the runoff water streams down the mountains, swamping the streets of local settlements and agricultural land. On March 13, 2023, the spring flood in Kazakhstan reached such an extreme level that the local government declared a natural emergency regime. Check out the list of other natural disasters in 2023.
The Ministry of Emergency Situations in Kazakhstan stated that preventive anti-flood measures were carried out in the West Kazakhstan region prior to the start of the flood season. They included building and strengthening dams and protective barriers, installing culverts, cleaning the canal system, removing snow, drilling holes, and cutting ice in areas prone to river jams. Such a comprehensive approach allowed authorities to mitigate the threat of flooding.
However, another significant problem persisted even after preventive measures were carried out. Overflows and destruction of roads led to interruptions in traffic and the isolation of individual settlements. The threat is aggravated by the technical condition of 1806 hydraulic structures which is highly questionable, including 471 which require a major overhaul. At the same time, the accurate assessment of the technical condition of these structures is difficult due to the lack of support by the state and private ownership of the land.
The situation in 2023 was also complicated by snowfall in the Turkestan region (as of January 12, 2023, its coverage was 94% of the territory). Snow reserves in the mountains were registered at 47-49% higher than the norm. The spring melting of this snowpack was predicted to cause an unregulated increase in the discharge of meltwater along the Arys River into the Syr Darya and the risk of flooding settlements in the lower reaches of the Syr Darya River in Kazakhstan .
Local agrarians admit that it takes a very long time to eliminate flood consequences every season. Beyond damage to buildings and roads, large areas of agricultural land suffer from soil erosion after high water. The flood washes away the most fertile topsoil, and its restoration might take decades.
The erosion impact assessment revealed that assuming the total yield on the plateau (flat area) in Kazakhstan is set as 100%, in the event of uncontrolled spring flooding, the northern slopes would yield 80% of this volume, while the southern slopes would only yield 40-60%.
Problem: The Impact Of Floods On Northern Kazakhstan
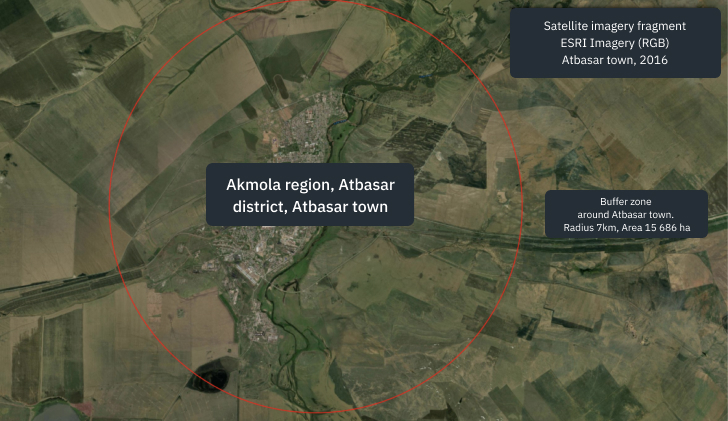
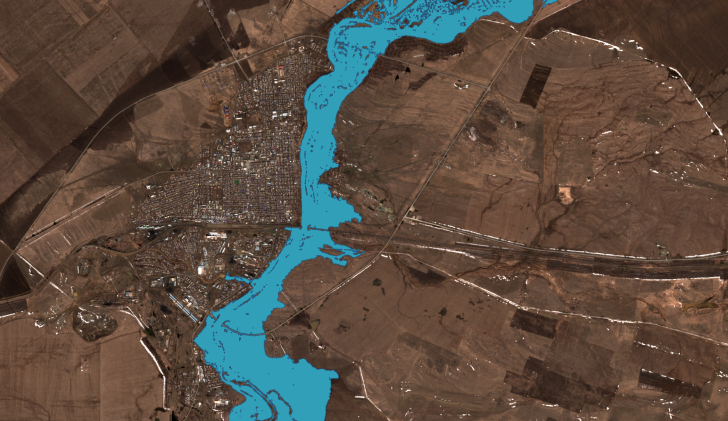
To train a flood detection model, we chose an area of interest (AOI) in one of the regions of Northern Kazakhstan. This area stretched across the river Zhabay (one of the tributaries of the river Ishim), along a hydro post at the mouth of the river, and Atbasar town with a population of 29,673 residents.
This region is characterized by intense spring floods that have been observed in the last 10 years, significantly complicating the socio-economic development of settlements in this basin.
The main causes of flooding include:
- Heavy precipitation (snow cover) melting
- The formation of congestion on watercourses, contributing to a sharp rise in water levels
- Rapid river ice melting in the flat territory of the temperate zone caused by a sudden temperature rise in the spring.
The most intense floods were observed in:
- 2014 – more than 550 houses were flooded on 12 streets of the city. Hundreds of people were evacuated;
- 2016 – a threat of flooding of nearby houses was observed, and 70 people were evacuated. As a result of building up the earth embankment to a 7m height, the overflow was eliminated;
- In 2017, there was a high rise in water, almost twice the critical one, and the protective dam was washed away in four places. More than 600 houses were flooded, and almost 1,500 people were evacuated. The water level was 80 centimeters higher than the flood level of 2014;
- In 2019 in Atbasar, two schools and about 80 residential buildings were under the threat of flooding due to an increase in the water level on the Zhabai River near the city by 70 centimeters.
EOSDA experts trained a custom neural network model on remote sensing and ground truth data that was extracted from this region. By including variables like temperature and snow depth, they could derive spring flood prediction analytics with 90% accuracy.
| AOI | Atbasar district of the Akmola region |
|---|---|
| Reference period | 2015 – 2019 |
| Highest flood period | April |
| Grid point | 5×5 km |
| Satellite imagery source | Sentinel 1 and Sentinel 2 |
| Ground truth | Meteorological records |
| Predictors’ temporal resolution | Daily |
To predict the area of flooding, our scientists used a linear multiple regression model. They considered two types of input data:
- Independent variables like meteorological data.
- Dependent variable, that is the flood itself.
Suppose you’re a farming cooperative trying to predict the spring flood time for the next season. You know that multiple factors — from the weather to the snow depth to the geographical position, can impact the flood timing, which could eventually make it or break it for your yields. Perhaps there are also some contributing factors that are less obvious like snow formations in neighboring states, technical conditions of nearby dams, and watercourse congestions that impact floods.
For making accurate predictions, generic solutions like a Python library will not give you a reliable result. The solution is to go for an ML model built on a carefully chosen mathematical algorithm and trained specifically on the unique conditions of your area. For detecting spring floods in Northern Kazakhstan, EOSDA scientists have decided to go with a linear multiple regression analysis based on meteorological predictors.
Multiple regression analysis is a way of mathematically predicting when, where, and how all the important variables result in a spring flood. Running such analysis based on accurate predictors can help eliminate the guesswork when answering important questions. For example, we can estimate which factors matter the most and which ones we can ignore. Then, the multiple regression analysis will show how those factors interact with one another in space and time. And, perhaps most important, what locations will most likely suffer from the flood once all the effects of those factors come together.
Selection Of Predictors For The Physical Justification Of Building A Forecast Model
First of all, our scientists had to sort out which factors would contribute the most to the spring flooding in AOI, and which factors they could dismiss.
The intense snow melting in AOI usually happens in late March to early April. Therefore, we had to evaluate the factors affecting the snow reserves and the intensity of their melting, which causes the spring flood, namely:
- The maximum snow cover depth for the cold period of the year from December to March;
- The minimum temperature during the cold period of the year, which affects the depth of soil freezing. During the rapid melting, the frozen soil does not allow moisture to be absorbed into the soil, which exacerbates the flood;
- The depth of the snow cover at the onset of a constant positive temperature, which shows how much snow remains at the time of intensive melting;
- The sum of temperatures from the date of the onset of positive temperature to the date when the snow cover disappears. The lower the sum of temperatures, the more intense the melting process, i.e. a smaller number of days is necessary for the complete melting of snow and its full volume to fall into the river. Other processes, such as evaporation and absorption of the water into the soil, in this case, don’t matter that much because they do not have enough time to reduce the volume of water entering the river;
- The maximum positive temperature, which is observed before the onset of a constant period from a positive temperature. Such an increase in temperature contributes to an increase in the moisture content of the snow cover, which leads to more intense melting when a period of constant positive temperature sets in.
Outcome: Accurate Flood Prediction, Further Opportunities
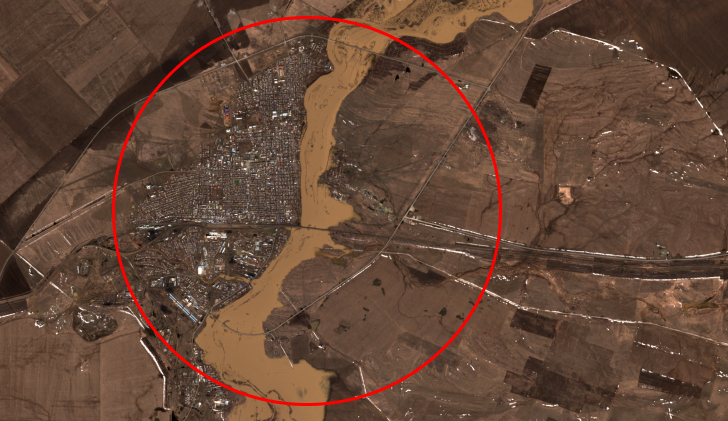
The results of the flood area detection according to the model in comparison with the actual ones, i.e. determined from satellite data at the time of the maximum flood of the river for 2016 – 2019 are presented in the table below. Analysis of the results showed that the average difference between the actual and calculated values is 79.5 sq. km, and the relative error presented in the [abs(Sf – Sm)/Sf] column is 0.10, which corresponds to 10% of statistical error, i.e., 90% accuracy of prediction. This comparison shows that the predicted values corresponded to the actual flood values, which proves the model’s viability.
| Year | Sf, km2, Flooded area, satellite data | Sm, km2 Flooded area predicted by a model | Sf–Sm | abs (Sf–Sm)/ Sf |
|---|---|---|---|---|
| 2016 | 1800 | 2016 | -216 | 0.12 |
| 2017 | 1960 | 1966 | -6 | 0.003 |
| 2018 | 1791 | 1380 | 411 | 0.22 |
| 2019 | 1687 | 1558 | 129 | 0.07 |
| Total | – | – | 79.5 | 0.10 |
Key Factor: Meteorological Data
The training output of an ML model highly depends on the accuracy of independent predictors like temperature, precipitation, air humidity, and so forth. That is because rapid snow and ice melting that causes the whole problem, depends on a steep temperature increase. The consequences of the flood, in turn, depend on how much snow and ice get to melt and how much of them actually reach the area of your interest.
This flood detection model is a proof-of-concept (PoC) based on historical meteorological data, which is slightly more accurate than weather forecasts. In the event of training the model for real-life flood prediction, we would choose weather forecast values of 1-2 weeks ahead of the present time, depending on the task at hand. For that, we would source meteorological data from prognostic regional and global models. For example, ICON shows one of the best temperature prediction accuracy levels of about 1°С.
If any predictor values have deviations, the resulting predictions appear to be too far from the truth. Hence, our experts trained a model based on the most impactful and precise predictors.
Further Opportunities Of The Model
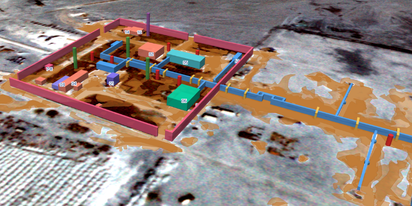
Our area of interest in Northern Kazakhstan included a lot of small infrastructural objects that were in danger of destruction because of the spring flood. It’s important to mention that the potential capabilities of our custom-trained models can be extended depending on a particular purpose.
For example, you might want to mitigate the flood damage risks for a small town, but you can also order a model that focuses on agricultural concerns, such as predicting soil erosion and field productivity zones.
Here are some of the possible implementations of our custom ML models:
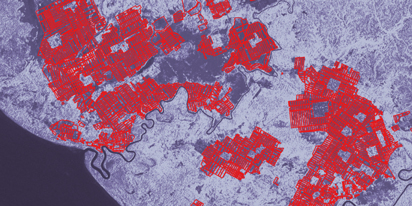
- Monitoring progress in construction objects (e.g., foundation, walls, roof). The model can detect thousands of such objects.
- Determination of the most appropriate areas for construction in the areas that are prone to spring floods.
- Time series forecasting based on vegetation indices for agricultural enterprises.
Don’t hesitate to reach out for a personal consultation, and our experts will let you know how they can fine-tune our algorithms to match your specific use case.
Need a solution tailored to your business goals? Book a call with our team to see how we can help.


Turn high-tech satellite data into actionable solutions for your business.

More news
EOSDA tracks construction progress in the UAE PAD areas
Managing rapid industrial expansion in the UAE requires accurate data. See how our satellite-based solution helped a client verify construction milestones and reduce inspection costs.
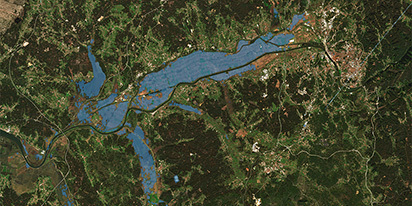
Validating satellite tech for flood analysis and damage mapping in Coimbra
Can satellites improve disaster response? We explored this in the Coimbra district, showing how integrated satellite intelligence can assess flood impacts and fill critical data gaps during a crisis.
EOSDA advances rice field mapping in Indonesia with SAR
EOSDA tested a radar-based approach to improve rice field detection in Indonesia. By integrating SAR and optical data, the team ensured stable monitoring even during peak monsoon months.