Calculating Organic Carbon Content In Ukrainian Soils
On March 6th and 7th, 2024, the EOSDA team visited ESA SYMPOSIUM in Frascati, Italy. Lidiia Lelechenko, a Sales Executive, and Dr. Vasyl Cherlinka, a Soil Scientist, presented research by the EOSDA science team.
The research focused on calculating the soil organic carbon (SOC) content on Ukrainian land from 2015 to 2020. The team searched the soil sample information in the specific datasets, calculated the carbon content, and predicted its future levels for the next 20 years using the modified RothC model. Read on to find out what results they got.
| Challenge | The EOSDA team needed historical data to calculate and predict the soil organic carbon potential, but most of it had many lacunae. |
| Solution | The team modified the RothC model and calculated SOC content in Ukrainian soil based on the most complete dataset. |
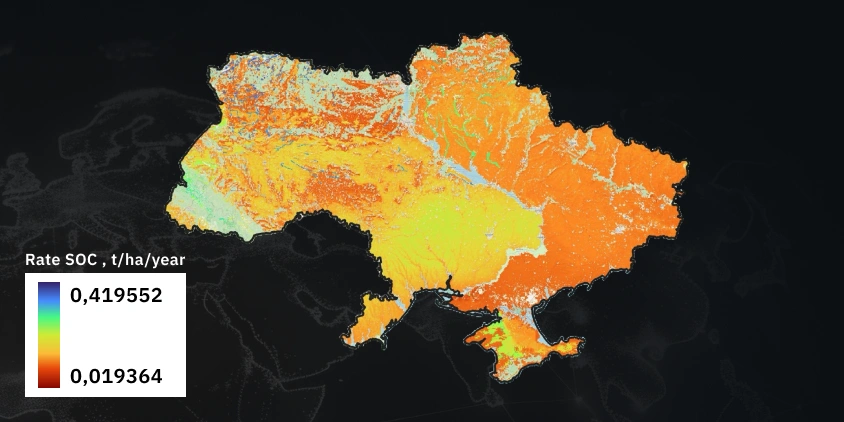
| Outcome | The SOC map of Ukraine was created for the years 2015 to 2020. The team then predicted SOC content for the next 20 years based on four different scenarios. |
Overview: Climate Change And Carbon Sequestration
One of the biggest challenges humans face today is global warming. To address this, several international initiatives have been launched to reduce human impact on the climate, such as the UN Framework Convention on Climate Change (1992), the Kyoto Protocol (1997), the Paris Climate Agreement (2015), and the Glasgow Climate Pact (2021) .
Among these, the Paris Agreement is particularly significant because it commits countries to reducing carbon emissions to keep global warming below 1.5°C, a critical threshold to avoid catastrophic climate scenarios. If countries fail to meet their promises under the Paris Agreement, the rise of global temperatures will lead to inevitable natural disasters by the end of this century.
While there is much debate about the methods and extent of emissions reduction, the role of soils in capturing carbon dioxide is widely acknowledged. Recently, the potential of agricultural soils to sequester carbon dioxide has been recognized as one of the most cost-effective and environmentally friendly ways to combat climate change. Exploiting soils’ ability to absorb CO2 helps mitigate climate change and enhances soil fertility. This is because the increase of organic matter in the soil improves its quality and health. Sustainable soil management practices, like minimizing tillage and avoiding soil rotation, reduce the breakdown of organic matter and prevent erosion caused by water and wind. These practices together help increase or restore soil fertility.
However, assessing the true potential of soil carbon sequestration at national and larger scales is often hindered by a lack of high-quality data on soil organic carbon content. Our science team turned to Ukrainian soil databases and archives to retrieve the relevant data and assess if it is possible to create a SOC prediction model for a large-scale territory like this, with a vast 45 million hectares of agricultural land.
Challenge: Soil Data Lacunae
In Ukraine, the major challenge in assessing carbon stocks, dynamics, and sequestration potential is the lack of data. Currently, there are a few potential sources for obtaining SOC content data. Let’s look into each one in more detail.
Some soil samples collected from 1957 to 2016 are stored in the National Scientific Center “Institute for Soil Science and Agrochemistry Research named after O. N. Sokolovsky” (NSC ISSAR) . Almost 4,000 samples were used to create the Ukrainian part of the Global Soil Organic Carbon Map with a 1 km/pixel resolution. The only issue was that the dataset was largely inaccessible due to the holder’s policy, and the sample size was too small and outdated for comprehensive analysis.
Global Soil Organic Carbon Map is a world map created by several countries worldwide to calculate the amount of carbon in the soil and represent it as an interactive map.
Other data can be found in the State Geodesy, Cartography, and Cadaster Agency of Ukraine (StateGeoCadastre). A large-scale soil survey of Ukraine during the 1957–1961 period resulted in a soil map covering 75% of the country, with a scale of 1:10,000 and based on up to one million collected samples. However, inaccessibility due to the holder’s policy and the non-digitized format makes the data impossible to use.
The third dataset that could potentially be used in this research was the agrochemical survey conducted every five years, with the 12th round currently happening despite the ongoing war. The Ukrainian State Institute “Soil Protect Institute” (SI SPI) does not allow the use of its data due to its policy. Besides that, the non-digitized format, lack of georeferencing in older samples, and data aggregated over large areas rather than specific locations present significant research blocks.
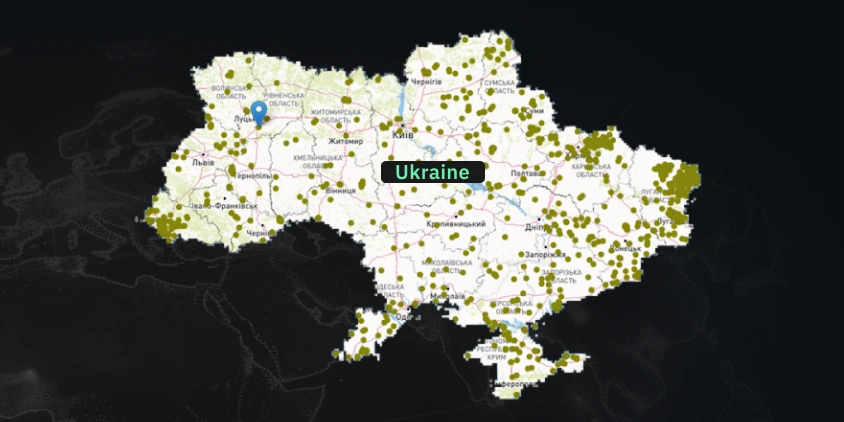
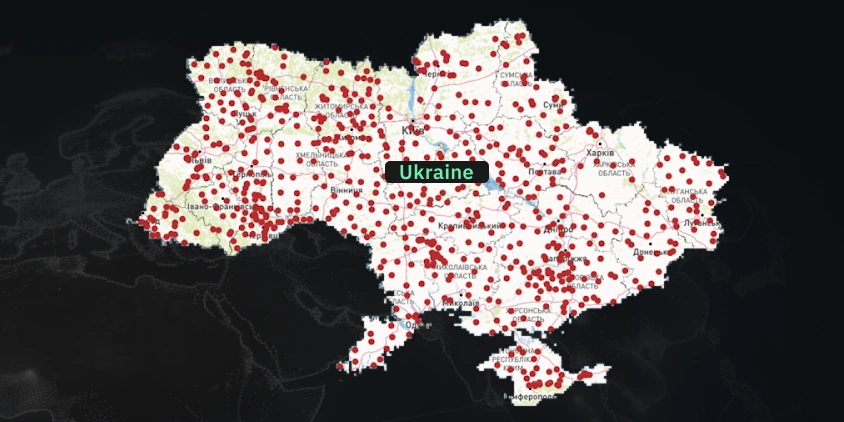
The next potential data set was formed by the National Agriculture Land Degradation Neutrality (ALDN) Monitoring platform, created by the Ukrainian Soil Partnership (USP) with support as part of the implementation of the FAO project funded by the GEF. The data includes 1,000 soil profiles data from NSC ISSAR, 750 monitored plots from SI SPI, and 4,030 fields, totaling 5,780 soil samples collected in 2015–2020.
The fifth and final potential dataset might have been the internal data from agroholdings and farmers. This approach can have a great perspective in the future. However, a possible problem with it might be that a system to aggregate this data would be needed, making it impractical for large-scale analysis.
Among these sources, the fourth option, the ALDN monitoring platform, appeared to be the most promising for obtaining comprehensive data on a national scale. With appropriate government policies, this database could be significantly expanded. However, due to the war in Ukraine, it is not a top priority now.
Solution: Modified RothC Model
The spatial modeling of SOC content in Ukrainian soils was based on a framework similar to the one used by Tomislav Hengl and colleagues for the SoilGrids series of maps and the Global Soil Organic Carbon Map, but with some simplifications . For example, calculations were only performed for the 0–30 cm plow layer, as this was the only depth available in the training dataset.
The mapping models were created using the R statistical environment at 250 meters per pixel resolution. The process involved four main steps, starting with overlaying observation points and covariates. The creation of mapping models considered derivatives of relief like slope steepness and exposure, surface curvature, topographic humidity index, agroclimatic data, and other factors. The second step was selecting the model type for spatial forecasting. The Random Forest algorithm, implemented in the R “ranger” package, was used for this purpose.
The Random Forest algorithm is a powerful machine-learning technique that combines many decision trees to improve the model’s accuracy. It is a supervised learning method that learns from labeled data and can be used for classification (categorizing data into different groups) and regression (predicting numerical values) tasks.
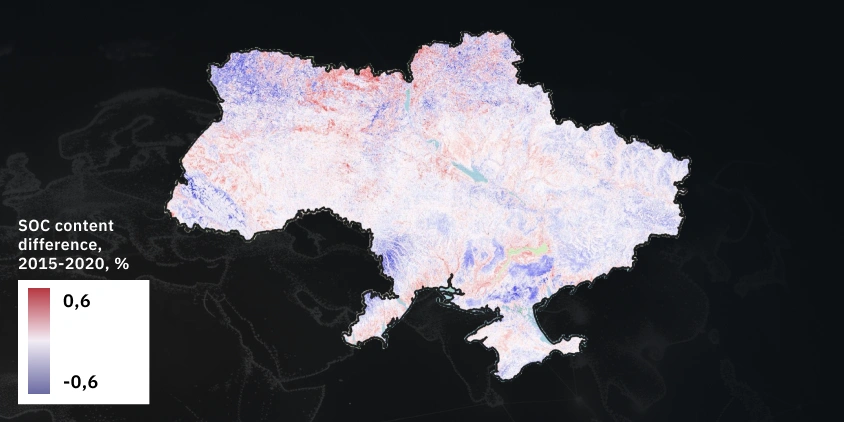
The third step was SOC modeling for specific years. As the chosen dataset represented data from 2015 to 2020, the models were applied to generate SOC maps for each year within this period. The final step was creating difference maps used to track changes in SOC levels over time.
The sequestration potential was assessed using a modified version of the EOSDA RothC model from FAO’s 2020 Technical Manual on the Global Soil Organic Carbon Sequestration Potential Map (GSOCseq) . Improvements to this model included faster algorithmic calculations, the ability to select various resolutions through resampling, and the automatic selection of refined biomass growth factors for different types of agricultural land in Ukraine.
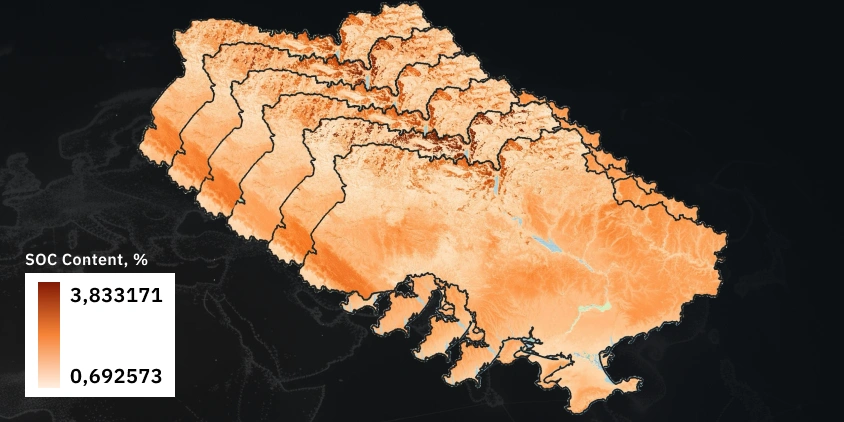
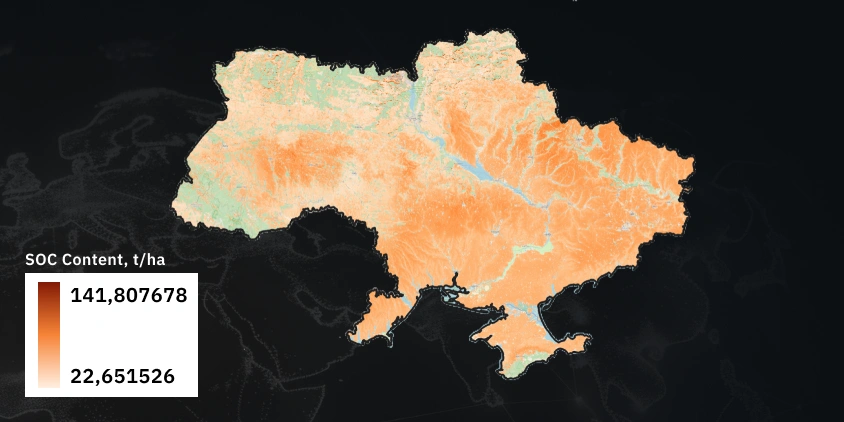
Outcome: SOC Map Of Ukraine
Spatial modeling of SOC content was conducted to visualize both spatial and temporal changes from 2015 to 2020. Despite the short time series, the EOSDA scientists see significant potential in forecasting carbon levels, especially given recent advancements in modeling.
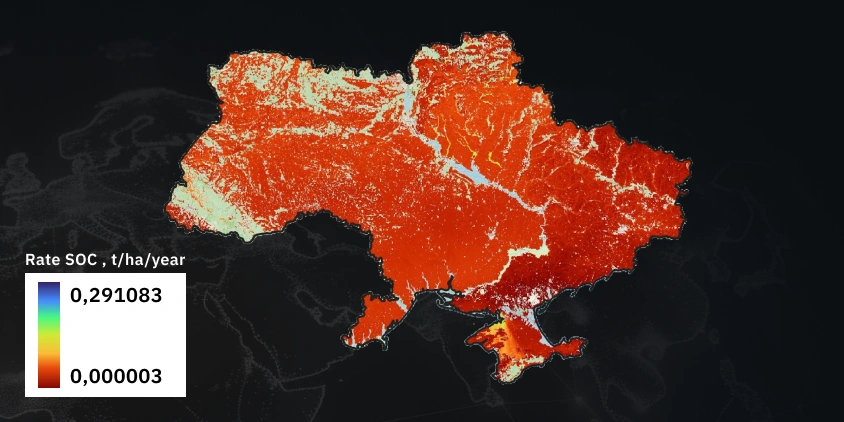
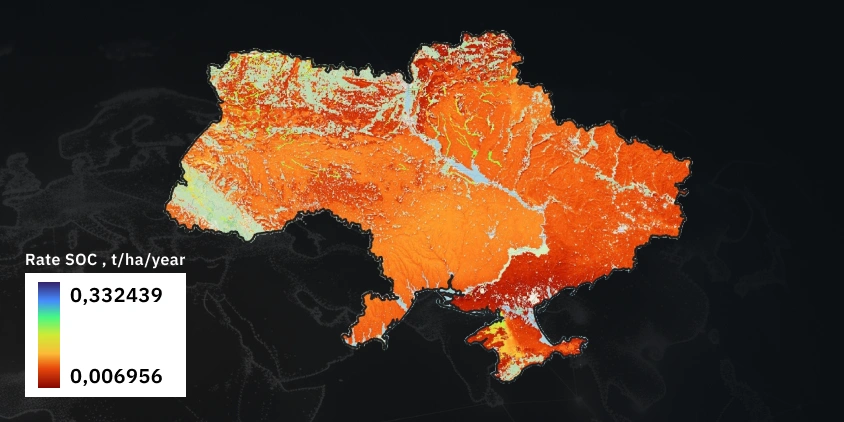
The model of carbon sequestration potential by the soils of agricultural landscapes obtained by us allows us to establish areas in which sometimes even the best management practices will not ensure the neutralization of organic carbon emissions from soils.
After completing this analysis, the team predicted the SOC content on that same territory for the next 20 years by playing out four different scenarios. The “Business as Usual” (BAU) scenario shows the potential SOC content in the topsoil of 0–30 cm after 20 years with conservative land use approaches. Other scenarios predict low (SSM1 – 5%), medium (SSM2 – 10%), and high (SSM3 – 20%) increases in carbon input. The outcomes of all these scenarios indicate that Ukraine has a high potential for carbon absorption, and with the comprehensive implementation of progressive soil management practices, a significant positive impact on soil health can be achieved.
Perspectives: Model Use In The Future
During the research, the team faced several challenges that needed to be addressed. The first one was a shortage of evenly distributed soil profile data for individual fields or monitoring plots, both current and historical. Georeferencing old data was particularly problematic, and as the team went further back in time, fewer observations were available, making temporal gaps more critical than spatial ones. In the future, scientists expect more evenly distributed data.
Another challenge was outdated and varied data. Historical data on soil profiles showed significant variations due to different methods and laboratories used. For example, detecting actual changes in soil organic carbon over time was difficult when the signal-to-noise ratio was low, especially for properties with low temporal dynamics like humus content. Higher-quality data collection is expected in the next few years as technologies improve.
The team also faced verification challenges. Verifying spatiotemporal models and predictive models from previous years was nearly impossible, especially in occupied and combat zones. Proper data validation should dramatically speed up future model verification.
Despite titanic efforts, a cheap, precise, and scalable breakthrough technology for monitoring SOC and other soil indicators of soil health has not yet been created, and work in this direction continues.
However, allowances must be made for data accuracy and the inability to obtain model results in combat zones, where agricultural activities are not feasible. Despite these limitations, the general approaches remain robust. They can serve as a basis for recalculating results in scenarios involving Ukraine’s post-war reconstruction and the restoration of its agricultural potential.
About the author:
Kseniia Kunakh has over 6 years of writing experience, working in various domains, including business, educational, and media-directed texts. Kseniia’s previous experiences as a development manager in a Ukrainian eco-NGO and as a talent matcher in an IT company make her a perfect combination of someone who is passionate about eco-tech innovations and can communicate about them with ease.
Recent articles
EOSDA Forecasts Yields For 2025 In Saskatchewan
EOSDA created RM-level crop yield forecasts for Saskatchewan to address limitations of official data. The project shows how satellite and weather inputs reveal local yield changes during the season.
Digital Tools Improve Soil Health And Yields In Mexico
EOSDA and ITTA supported a Guanajuato farm with contour-line planning, monitoring tools, and practical guidance to reduce soil erosion and improve yields in the long run.

Analyze 2025 & Plan Your Best Year Yet: LandViewer Christmas Offer
It’s the most wonderful time of the year! The Christmas holidays are here, and so is your chance to analyze 2025 and plan a prosperous 2026 with more affordable Pro plans in LandViewer.