
For food producers in Asia and Africa, overcoming factors hampering field productivity isn’t new. Businesses have to consider the risk of plant damage and soil quality loss due to ever-increasing droughts and heavy rainfalls — signs of climate change. The constantly growing world population (that’s expected to surpass 8 billion people in late 2022 or within the first months of 2023) will continue driving food demand. Keeping crop yields at required levels becomes a more pressing issue.
On a bright note, sustainable approaches to agriculture that include applying satellite technology allow food producers to adapt to environmental conditions and respond promptly to emerging problems. In the interview, Brijesh Thoppil, Director of Strategic Partnerships at EOS Data Analytics, discusses factors threatening food security on both continents and means to mitigate their harmful effects.
What Factors Threaten Food Security In Africa And Asia?
To answer this question, one must take into account demographic, climate, and policy factors.
Let’s start with the interdependence between population growth and food supply. Asia, being home to roughly three-fifths (4,651 billion people) of the global population, is the world’s most populous continent. Africa has the highest rate of human population growth (2.38% in 2022 vs. 0.04% in Europe as of 2020). The continent will account for more than half of global population growth between 2019 and 2050.
Countries in Africa and Asia are chronically facing food shortages resulting from a lack of sustainable agriculture approach that focuses on optimizing resources and minimizing environmental harm. Sustainable practices include crop rotation, tillage reduction, variable rate application of inputs, planting cover crops and perennials during off-seasons, adjusting water use based on soil moisture levels, etc.
Climate risks, such as increasing temperatures, repeated heatwaves, droughts, floods, and rising sea levels, also affect the food production cycle and often result in crop damage.
I have to admit the world is moving in the right direction by adopting sustainable practices to reduce global hunger. But still, many countries on continents have been struggling to ensure food security because of a lack of government or community initiatives.
How Can Food Producers Mitigate The Negative Impacts Of Climate Change In Their Operations?
Negative impacts of climate change lead to low profitability for food producers. Satellite-based measurement of temperature, crop development, precipitation level, soil moisture, and other indicators help in reducing the climate change impact on food production. Farmers also benefit from knowing about weather patterns as soon as possible with forecasts. It allows them to plan activities or react to weather events accordingly to ensure their crops have the highest chance of survival.
Quickly adopting crop monitoring solutions like EOSDA Crop Monitoring enables digital transformation managers engaged in food production to take advantage of near-real-time data analytics without compromising high-speed data transfer and storage capabilities. Precision agriculture software can become an integral part of food producers’ operations, providing valuable information on fields that they can use to maximize crop yields amid climate change.
How Can EOSDA Crop Monitoring Aid Food Producers?
EOSDA Crop Monitoring, like any platform relying on satellite data for remote sensing, gives users a bird’s eye view of the state of their fields and weather on the one hand and the option to zoom into an image and evaluate this state against numerous indicators of crop health and development and soil condition on the other. In this sense, the capability to look at a sizable area permits improving irrigation management.
Via remote field sensing, farmers can learn about soil moisture at a large spatial scale (approximately 10,000 square kilometers in one satellite image tile), making satellite monitoring more cost-effective than using soil moisture sensors in the long term. A sensor, on average, covers 1–2 acres of land (1 acre is 4046.86 square meters). Some experts also suggest using from 2 to 4 sensors for a 65-hectare field, a quarter section in Northern America. Moreover, we must factor in efforts, such as testing equipment in the lab, site selection, installation, or maintenance.
The software is a source of information (soil moisture index, precipitation forecasts, the NDMI vegetation index, and soil moisture data mentioned previously), relying on which users can plan the amount of water and timing of crop irrigation.
The NDMI analysis shows where water needs to be distributed, preventing over or under irrigation. Weather forecasts about expected precipitation, humidity, and cloud coverage also let farmers adjust irrigation. Soil moisture index indicates moisture of soil at surface level and root zone level; farmers mostly use this feature during periods with insufficient precipitation to identify crop stress and areas where rainfall could lead to landslides.
Conserving the water supply avoids critical problems like crop damage or destruction that can be costly to a farmer and beneficiaries of produce.
The platform features also allow food production businesses to get the latest insights into crop development and historical data. I want to mention several other features and services that are the most sought-after among our users. They are:
Vegetation indices — numbers quantifying a plant’s development for every pixel in a satellite image. Besides NDVI, EOSDA Crop Monitoring has 17 vegetation indices.
Field productivity data covering at least the last five years; data is needed for yield prediction.
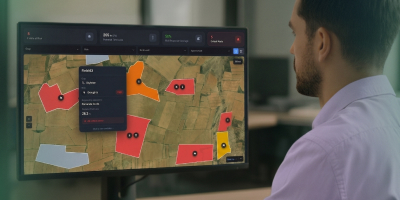
Field leaderboard for ranking fields according to nine categories, such as productivity or vegetation index value change, for understanding which ones require immediate attention.
Group accounts for adding multiple users.
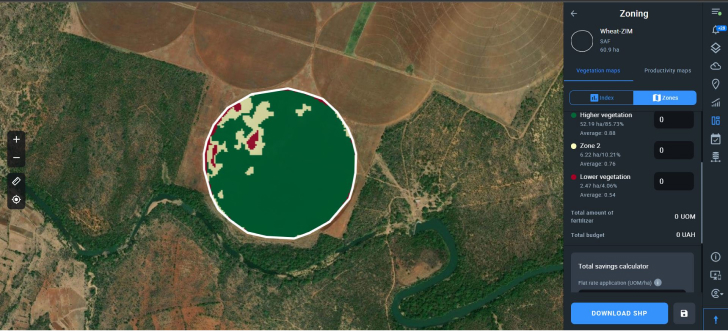
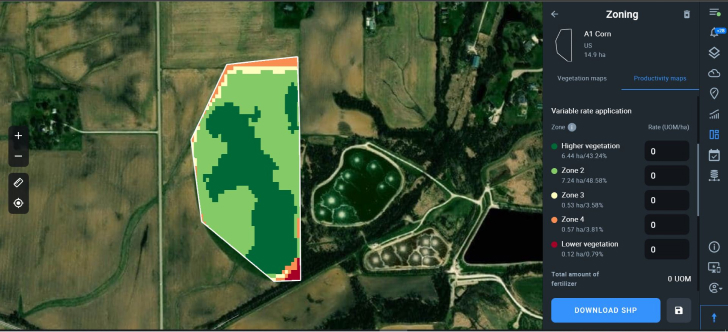
Zoning for creating vegetation and productivity maps that are, in turn, used for variable application of seeds, fertilizers, pesticides, and herbicides. These maps are also called prescription maps for variable rate application (VRA).
Please Tell Us More About The Purpose of These Maps.
All maps are based on the latest satellite imagery data.
Food producers use productivity and vegetation maps to identify field areas with higher and lower yield potential. Based on this information, farmers can set an appropriate amount of seedlings or fertilizer for every zone. Maps can be downloaded in a shapefile format and uploaded to the onboard computer on agricultural machinery to perform a differential application. This way, food producers can spend less on inputs by using resources more rationally.
Vegetation maps show how much nitrogen crops need at the moment. Colors on a map indicate problematic areas, and each color corresponds to a scale of a problem. The red color means a field zone is in a critical state, so food producers probably have to apply the highest amount of nitrogen fertilizer. On the contrary, Green generally indicates high vegetation density areas that need less nitrogen.
Relying on productivity maps, farmers distribute just as much potassium and phosphorus fertilizer as needed for a given field or its part, not less and not more. The red color corresponds to the lowest productivity levels, whereas shades of green show more productive areas.
And budget and input savings are not abstract concepts. Our developers have recently added the Total Savings calculator that helps users learn about their ROI by instantly calculating the amount of fertilizer and money saved.
It’s not only about productivity and vegetation maps. There are other types of maps one can generate with the precision farming tool by EOSDA. For example, crop classification and land cover maps.
The team has trained deep learning models that classify crops and define land cover on multi-temporal and multi-source satellite imagery. Crop classification and land cover maps aid in planning agricultural operations for various purposes, such as:
- Arable/non-arable land identification
- Fields boundary delineation
- Actual acreage estimation for each crop type
- Crop rotation historical data
So, the key advantage of using satellite crop and land cover/classification maps for food producers is economical large-scale agricultural land use monitoring for operation and research purposes.
EOS Data Analytics Has Announced The Launch Of The First Agro-focused Satellite Constellation Among Companies Utilizing Remote Sensing Technologies, EOS SAT. How Will Food Producers Benefit From This Data Source?
The benefits of EOS SAT-1 stem from its technical characteristics. The lightweight optical satellite generates high-resolution images of farmlands and forests every 5–6 days or daily if tasked to monitor specific areas. The satellite captures imagery in 11 spectral bands. EOS SAT-1 will cover 100% of land in the top counties.
Use cases of the EOS SAT-1 include:
- Diseases and pest prediction
- Efficient input management
- Yield modeling and prediction
- Arable land and field boundaries detection
- Irrigation management
- The optimal crop rotation plan
After the launch, the company will provide all data-related services, from data acquisition to processing and interpretation, to support customers’ decision-making. A data cycle will be between 3 and 16 hours. We understand the more frequently food producers can get actionable insights into the fields, the better. And we’re working on it.
About the author:
Kateryna Sergieieva has a Ph.D. in information technologies and 15 years of experience in remote sensing. She is a Senior Scientist at EOSDA responsible for developing technologies for satellite monitoring and surface feature change detection. Kateryna is an author of over 60 scientific publications.


Detect crop risks earlier with AI-powered field alerts.
More news

EOSDA & Agribest: Driving Agtech Growth In Mexico
In this insightful interview, Agribest shares how its collaboration with EOSDA is shaping Mexico’s agricultural future, with a focus on profitability, sustainability, and technology.
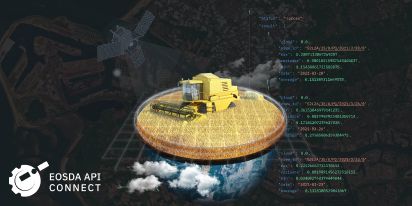
How EOSDA API Connect Helps Businesses Shape The Future
Antonio Quesada, Customer Success Manager, discussed EOSDA API Connect and its endless customization possibilities for the clients, diving into customer success stories and explaining API with ease.
EOSDA Enhanced PySawit Model To Improve Its Accuracy
EOSDA enhanced the PySawit model to make it more accurate for the Asian-Pacific palm oil producers, adding parameters, improving precision, and calibrating the data with high resolution.