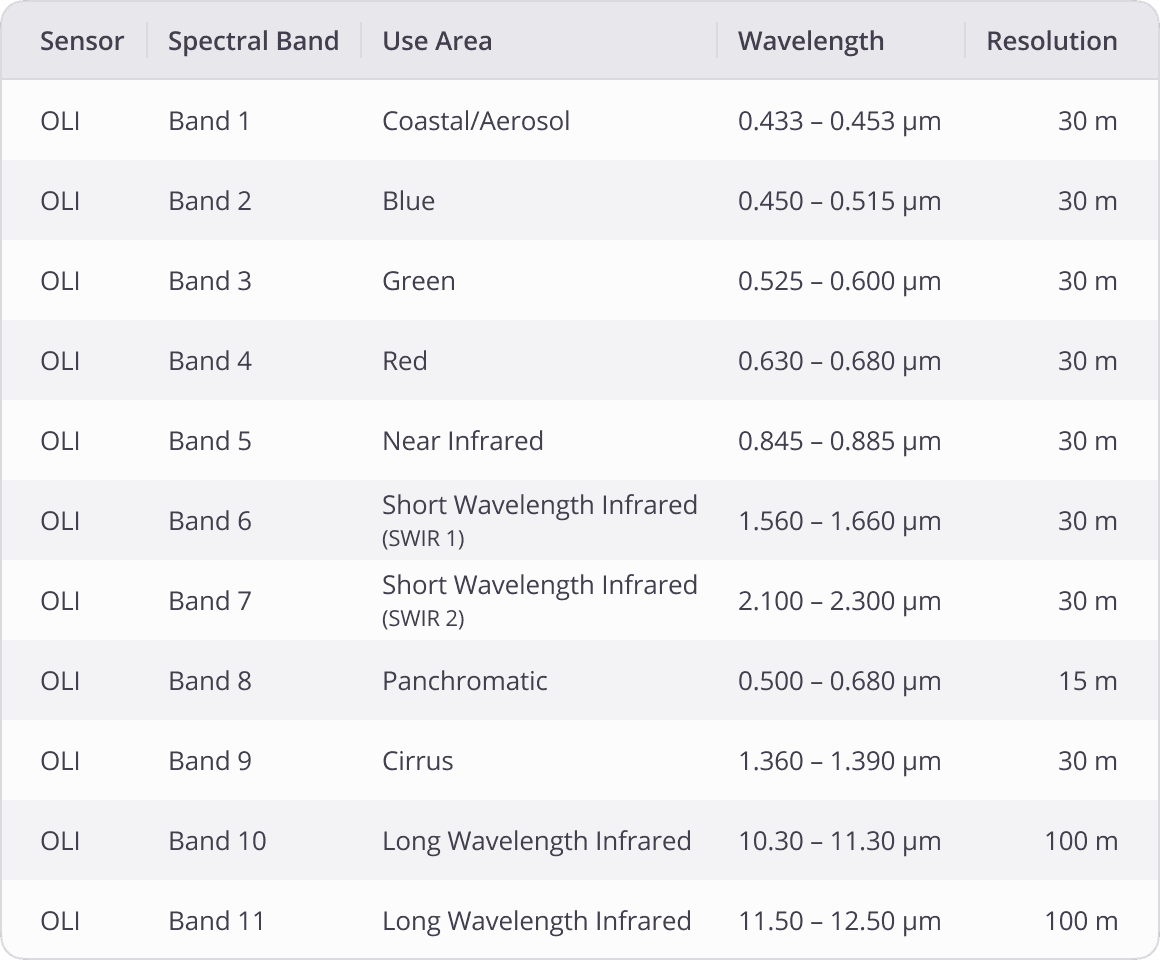
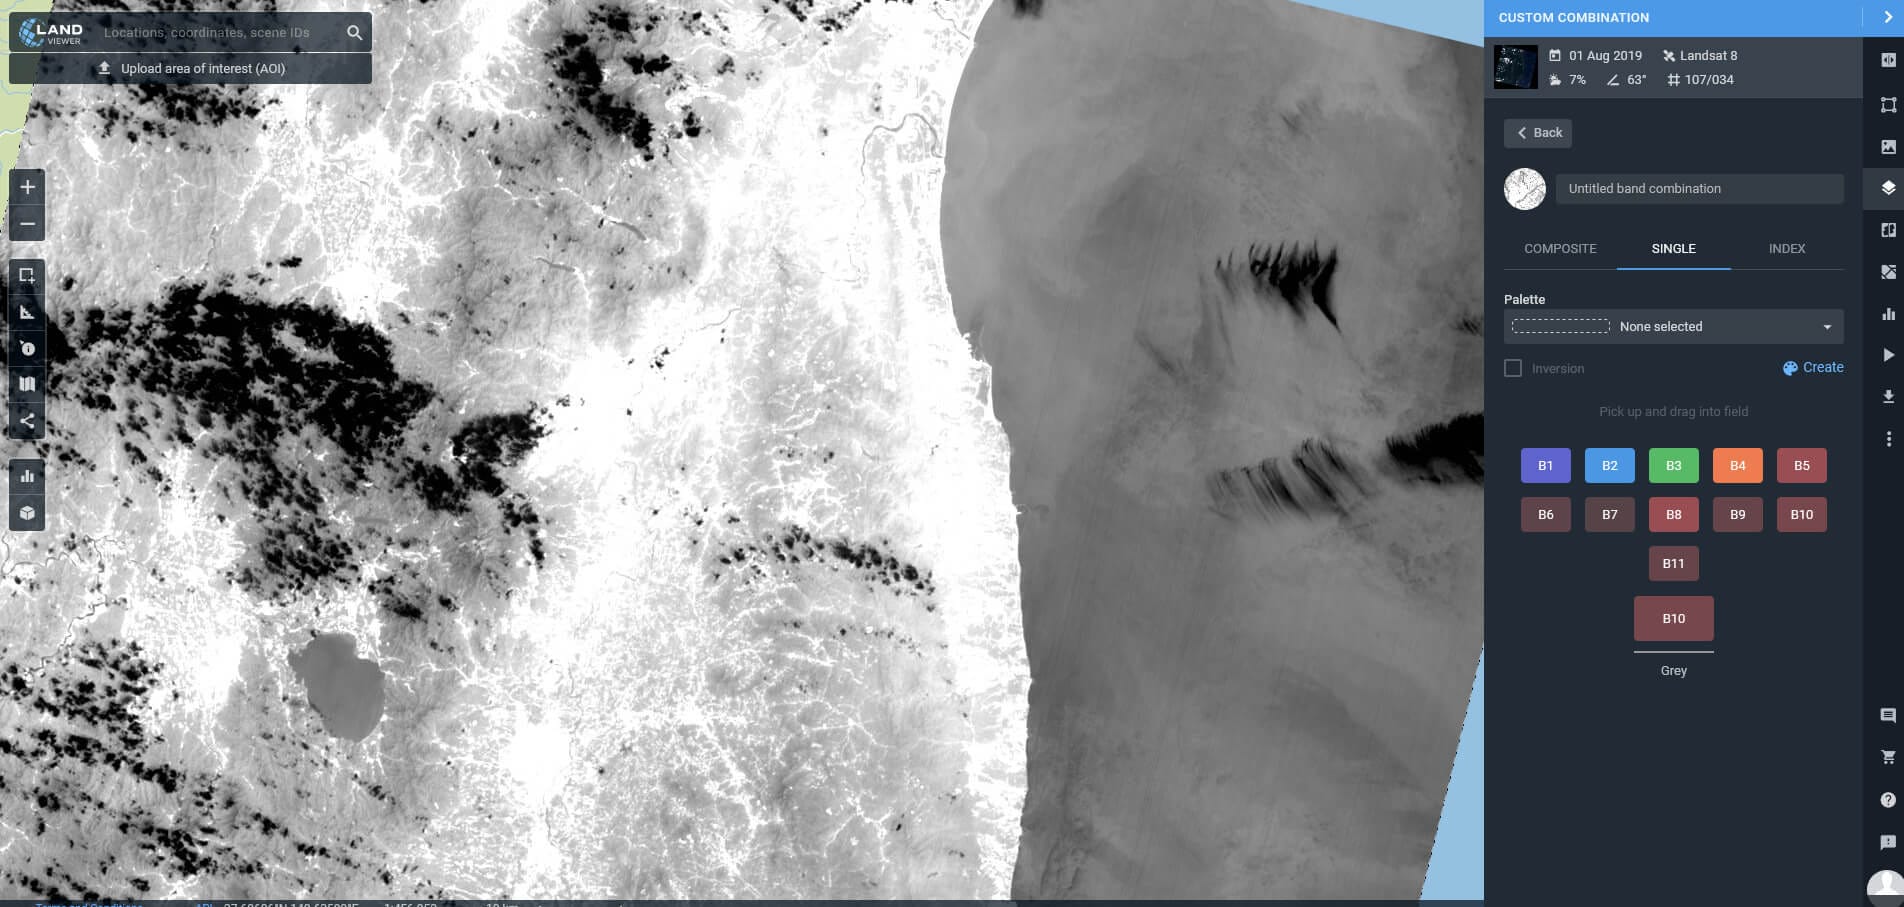
In EOSDA LandViewer, you can view and download Landsat 8 satellite images for free. Data survey is performed by two main sensors which are adjusted into prescribed bands. The satellite operates in visible light, near InfraRed; ShortWave InfraRed to Thermal (LongWave) infrared. The bands are pre-set to 11 bands in total differed by the wavelength of their vision.
One of the sensors – Operational Land Imager (OLI) uses 9 bands in the spectrum of visible light and Near Infrared. The second sensor – Thermal InfraRed Sensor (TIRS) operates in the range of the Infrared frequencies – Longwave InfraRed Light. The satellite provides images with a moderate resolution which varies in different bands from 15 m per pixel in the most accurate to 100 m in the LongWave Infrared where accuracy is not vital.
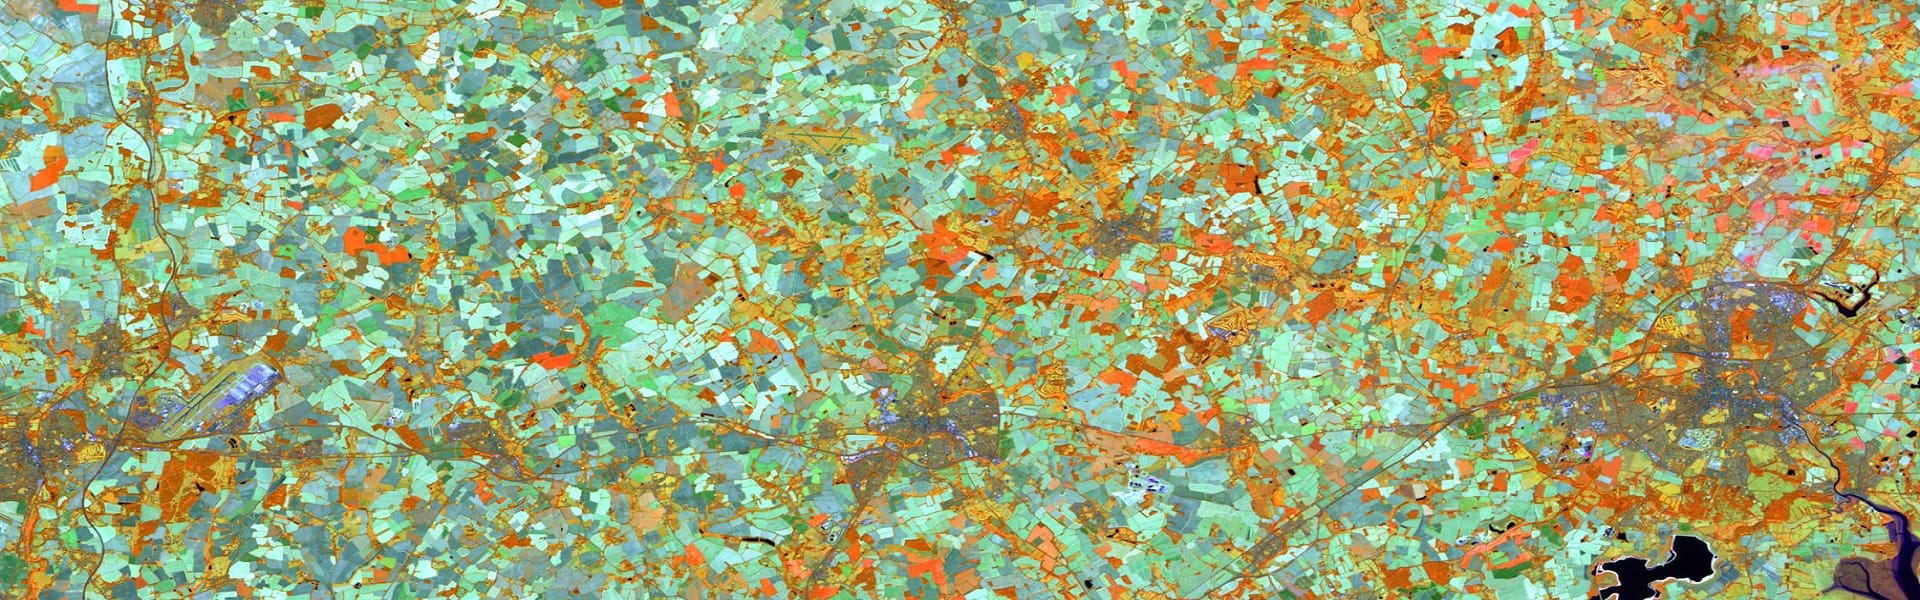
While monitoring the land cover it is possible to select one or several bands in order to create a clearer picture due to the specific needs for different kinds of researches it is possible to use False Color Images for enhancing the visual appearance of the data. The opportunity given is to substitute the true color of the image with the color required.
In EOSDA LandViewer, you can view and download Landsat 8 satellite images for free.
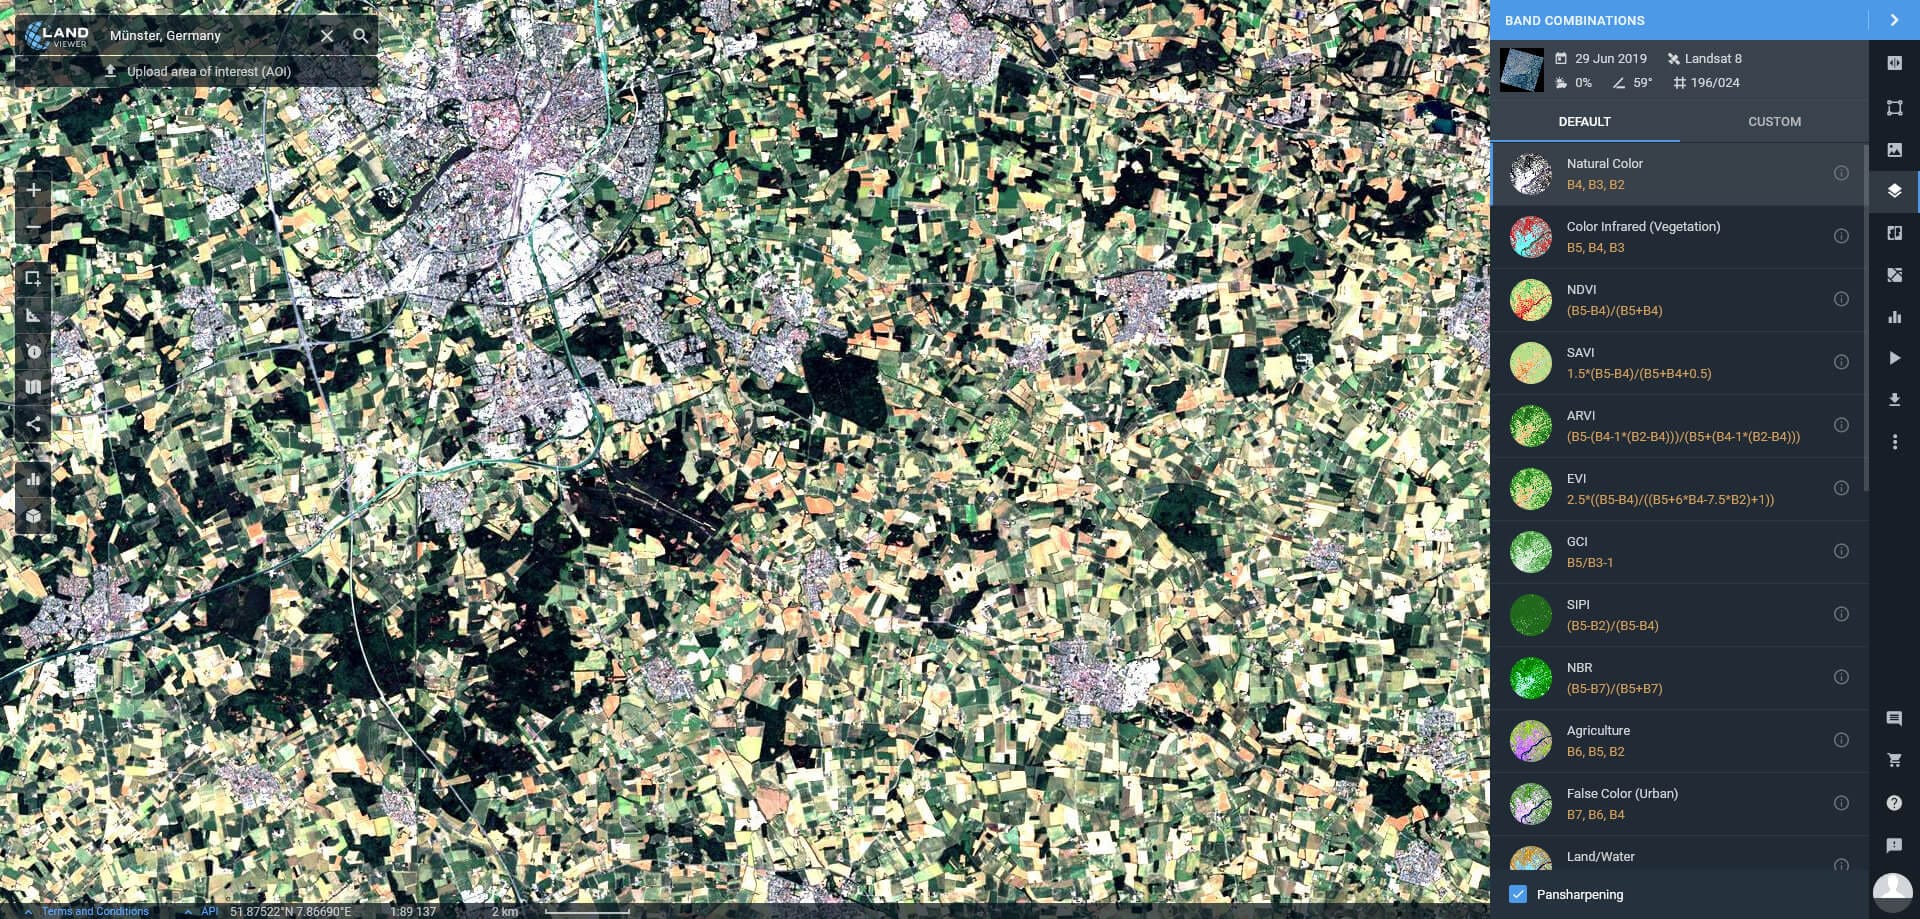
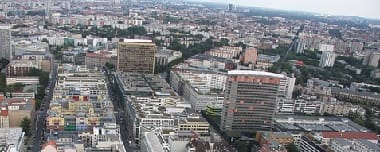
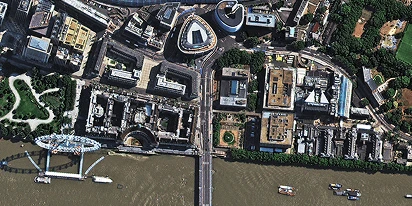
Band 2, 3 and 4 (Blue, Green and Red filters respectively) all together these filters are creating a true color band combination or normal RGB picture of the visible light. The basic aim of these filters is to create a visual map of the area.
The picture seen below is a normal satellite mapping photo.
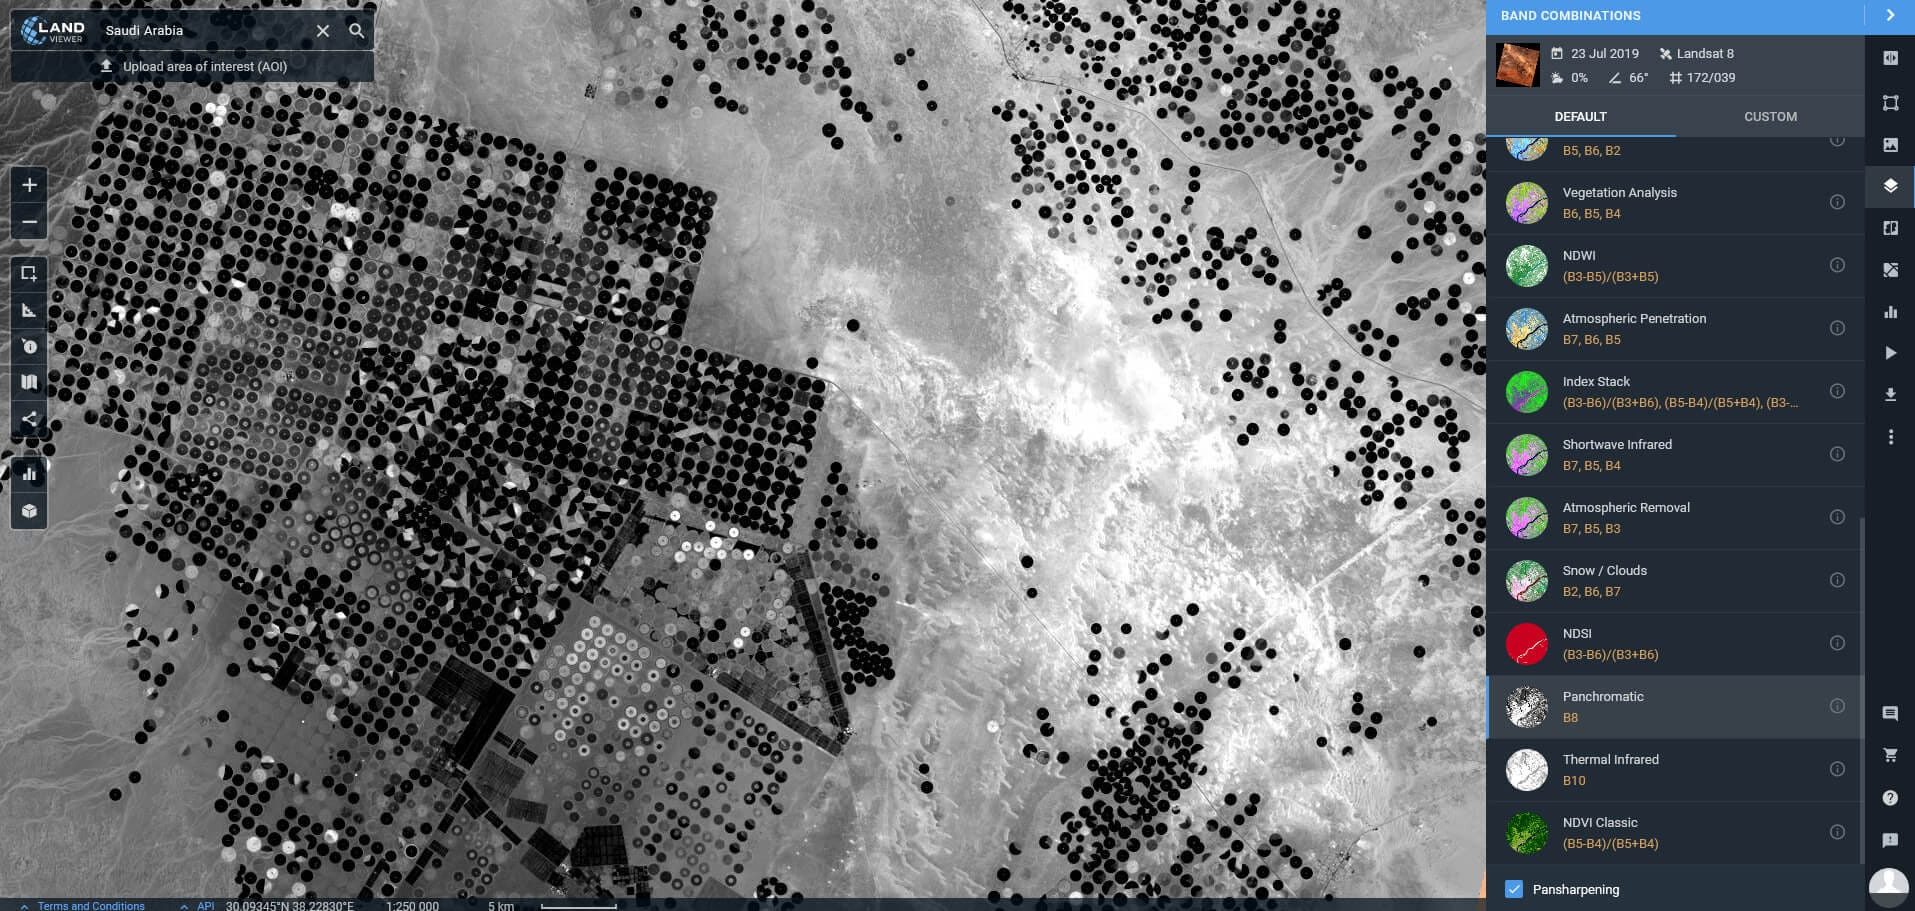
Band 8 is panchromatic or, basically, black and white is collecting as many specters as possible in one channel which helps it to make sharper images than any other band. Due to the sensor sees more light its resolution is 15 m per pixel compared to 30 m in others. When more precise pictures are required for the research it is possible to sharpen the photo by adding the band into the combination. With pansharpening of a panchromatic image of higher resolution with multispectral images of lower resolution allows to improve the resolution of the latter and increase their informativeness.
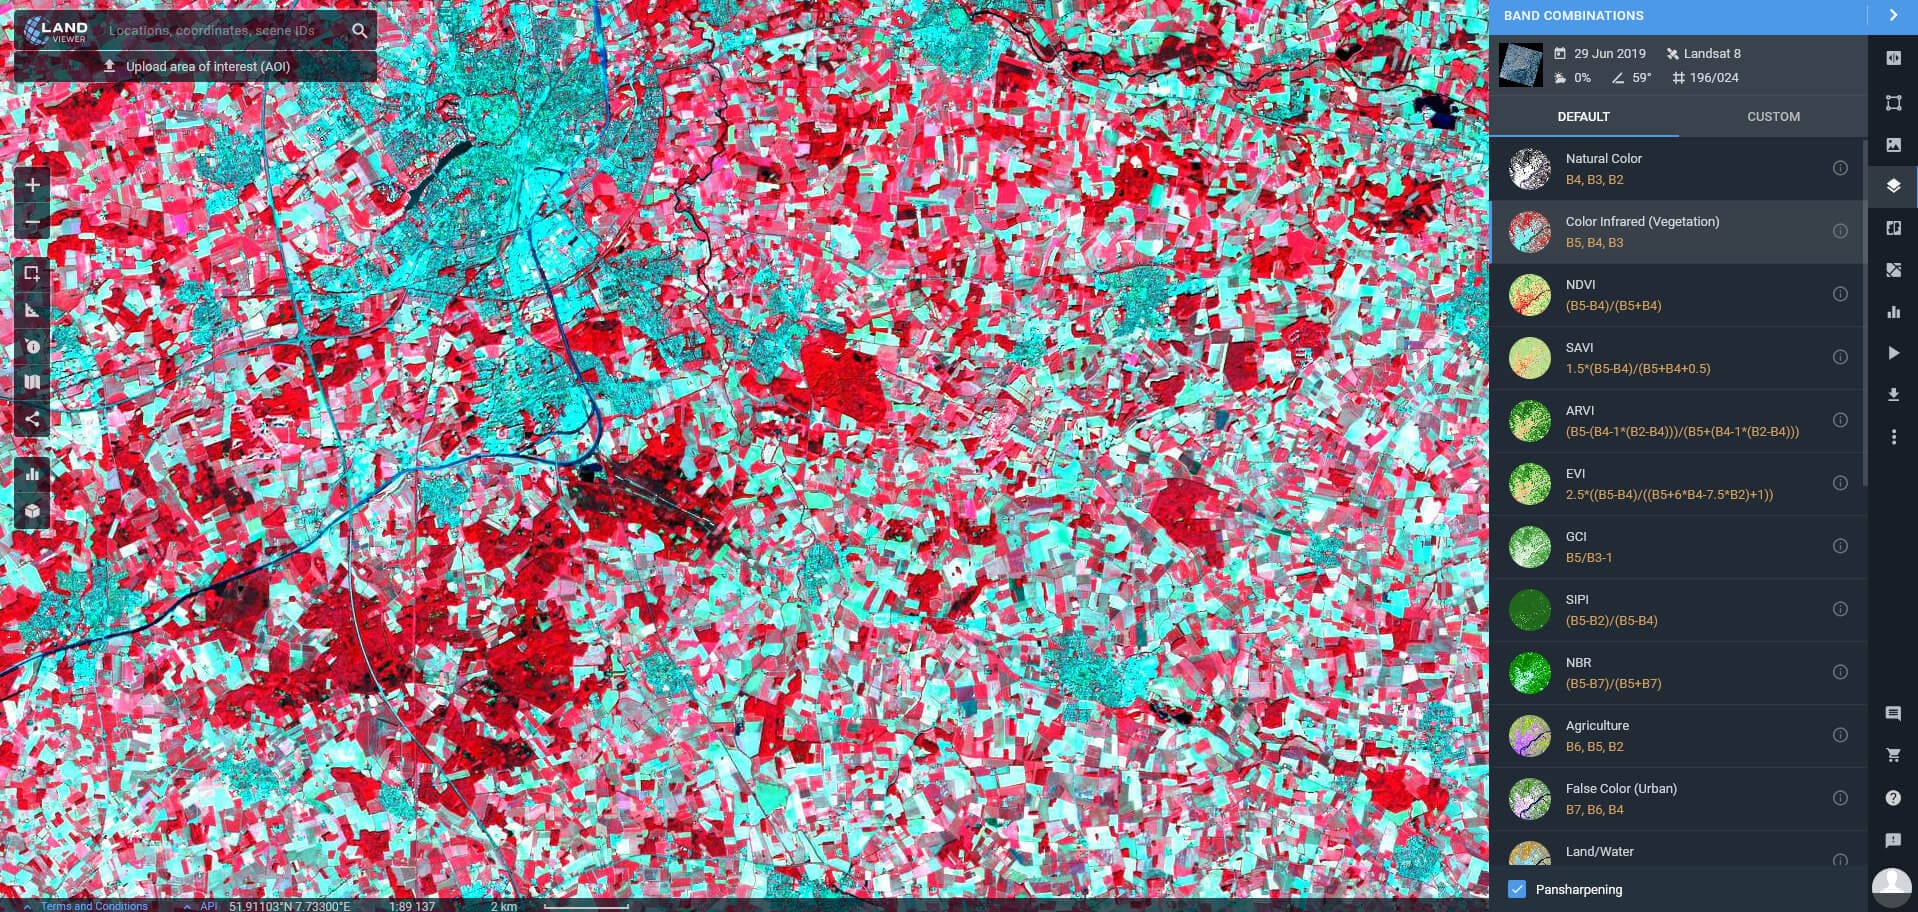
Band 5 (Near InfraRed) – is very important in terms of ecological monitoring as the Near InfraRed is the spectrum reflected from water contained in plants. Combination of bands 3, 4, 5 is used to monitor plants and forests more precisely than simply monitoring the greenness picture. This band combination is also useful for drainage and soils monitoring during the crops studies.
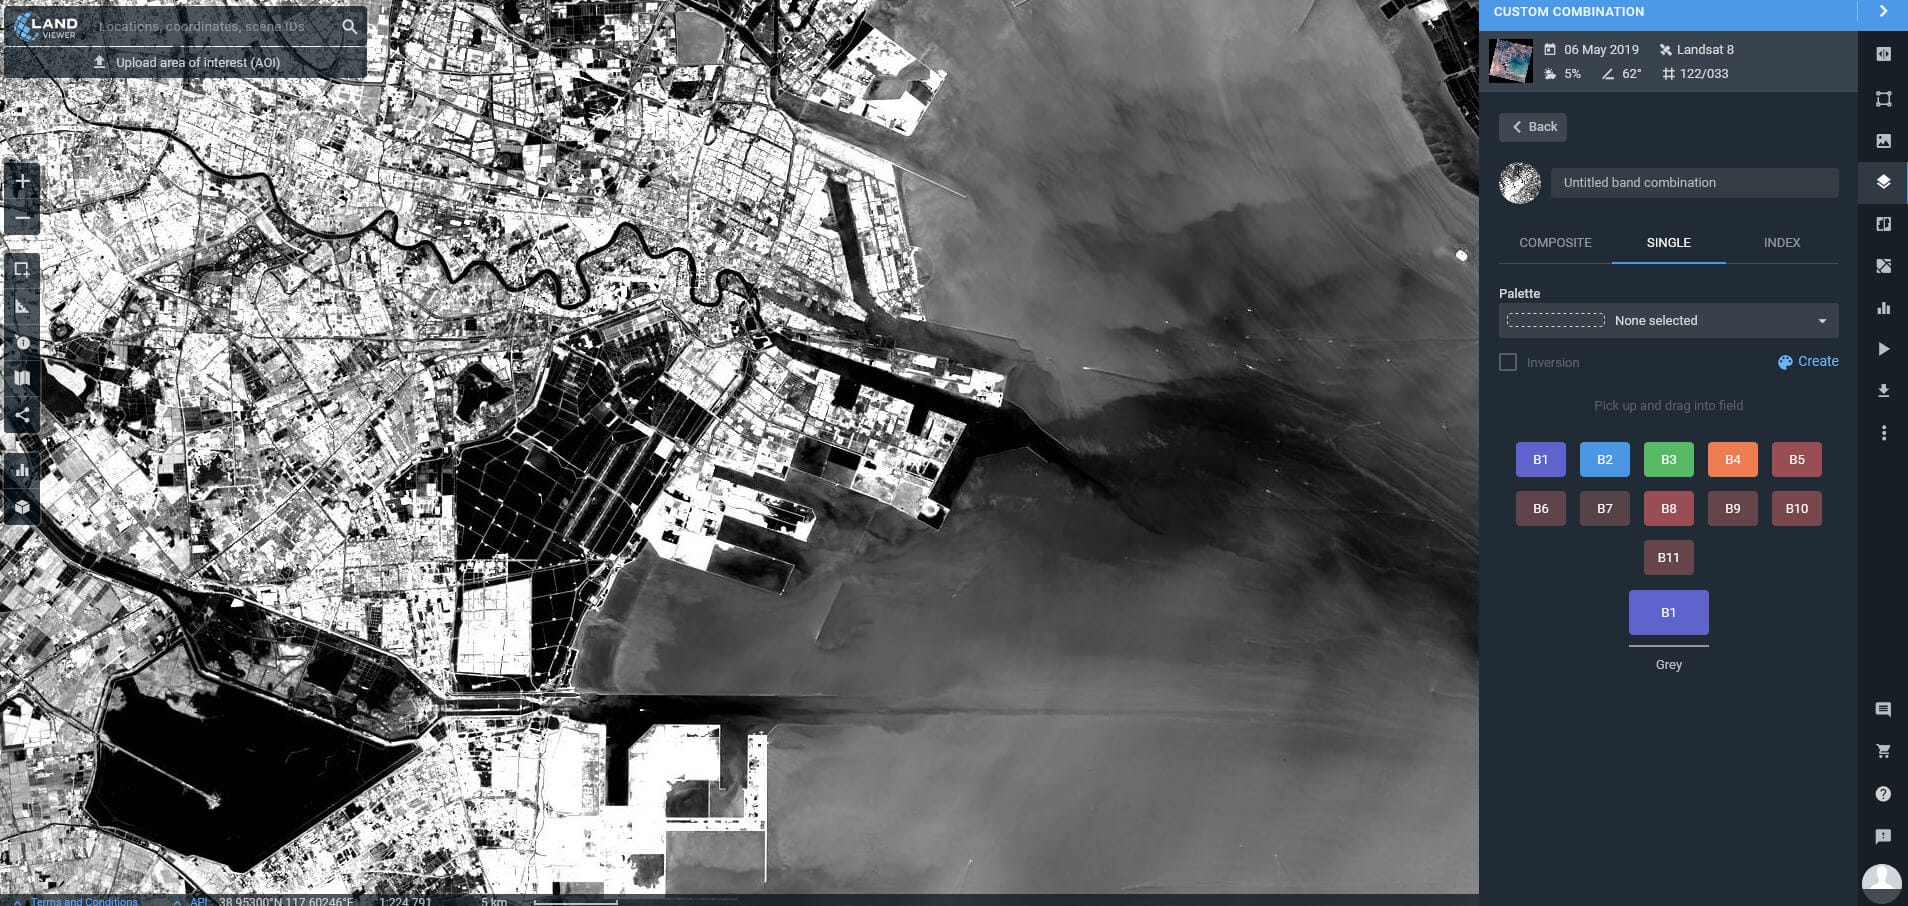
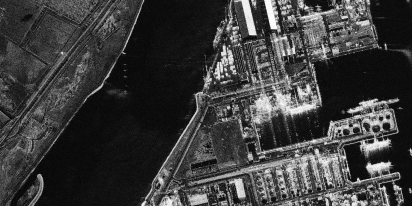
Band 1 (Deep Blue/Violet) –the sensor band in this operation mode is able to collect deep blue color and as a result, helps to monitor coasts as well as to distinguish the dust particles or smoke in the air.
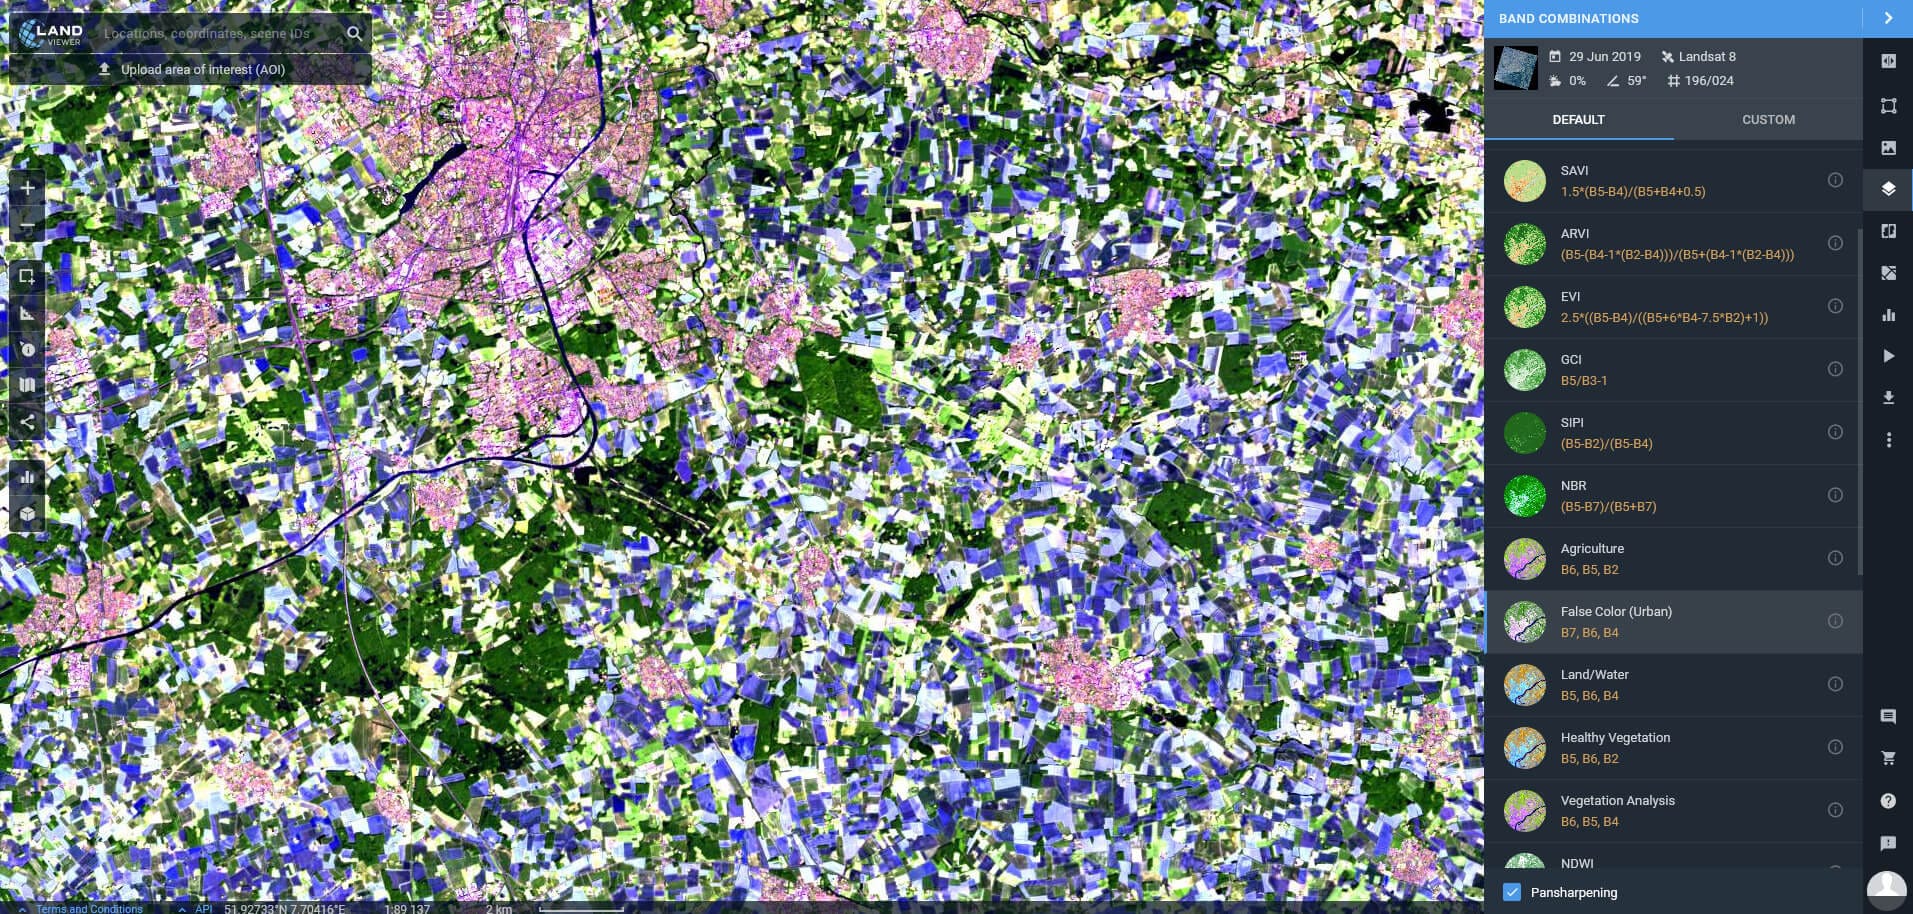
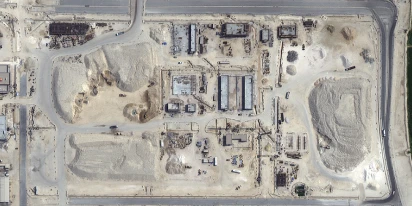
Bands 6 and 7 use different parts of shortwave infrared and are helpful in terms of monitoring rocks and soils. As the spectrum is almost fully absorbed by water it easily reflects the water sources when analyzing the image. These bands are also employed for ecological and geological researches due to their properties. The geological band combinations allow specifying the areas of interest for future geological study.
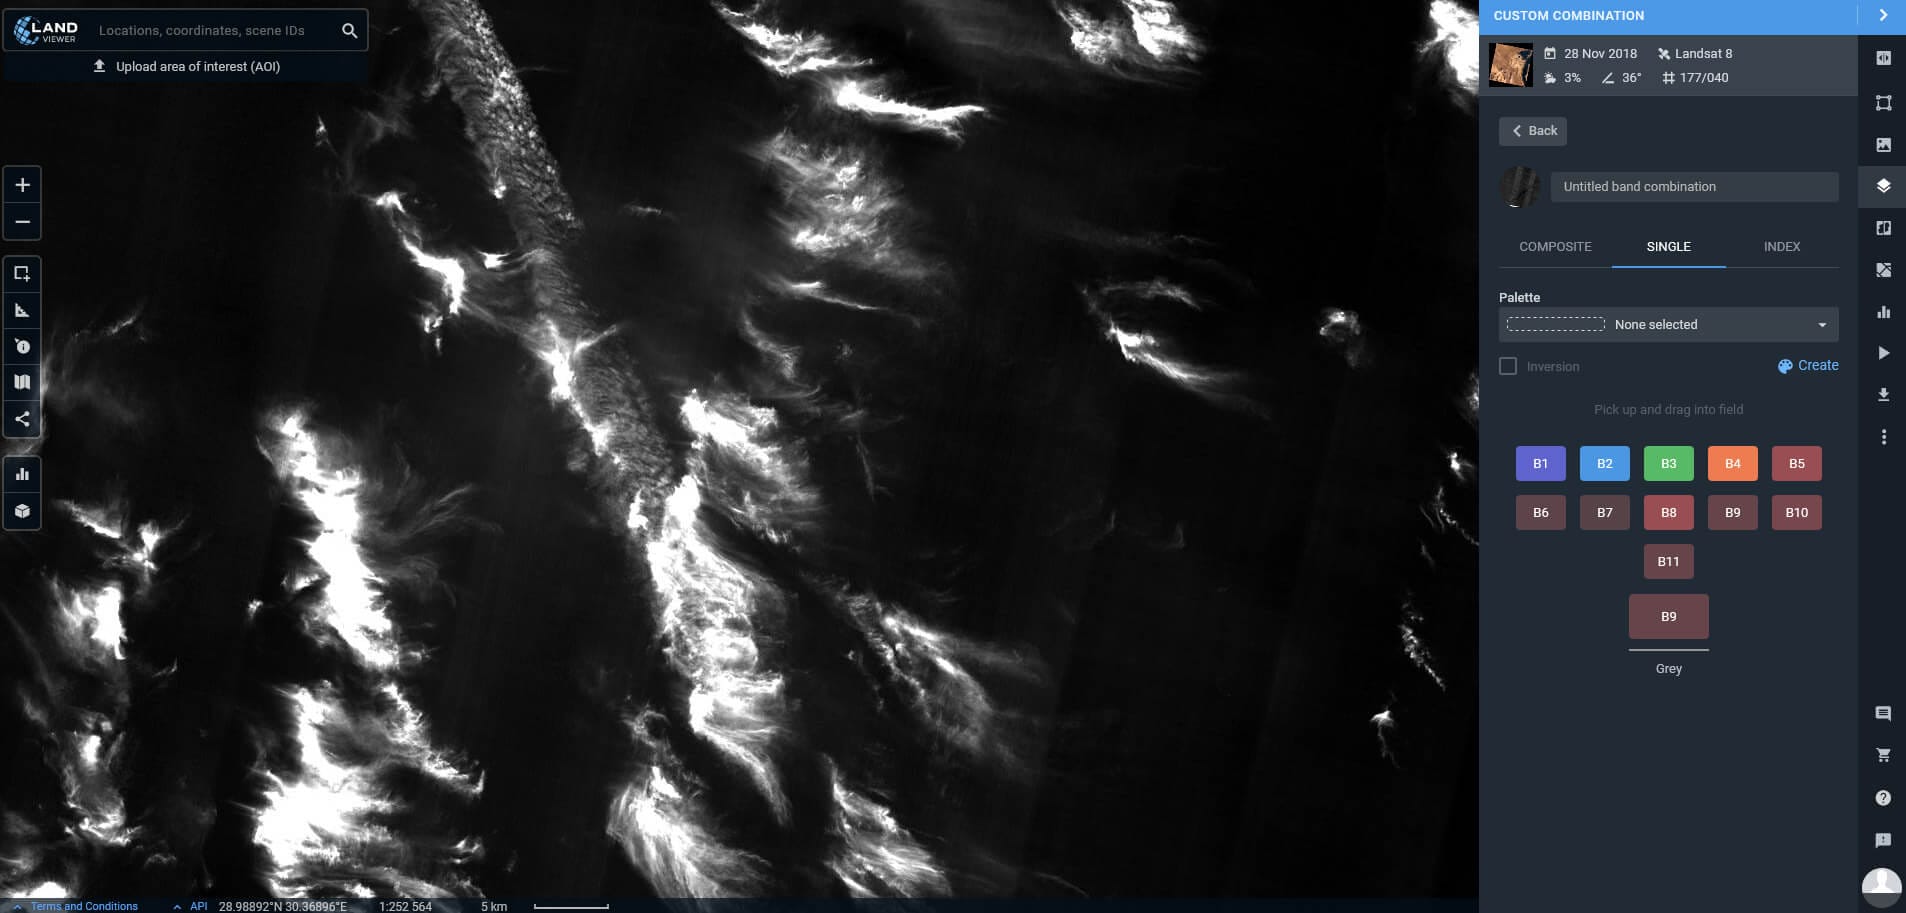
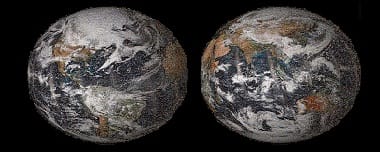
Band 9 is the “blindest” of the Landsat bands yet is no less interesting. This band covers a very narrow range of frequencies and taken the most of them are absorbed by the atmosphere anything in this band seen brightly is considered to be above the atmosphere. As the Earth is not visible in the spectrum, this band aims to identify clouds and helps to filter them off when required.
Band 10 and 11 are Thermal InfraRed bands and they can see heat. Unlike meteorological stations which can monitor the air temperature, these bands combination reflects the temperature mapping of the ground surface which is usually hotter than the air. This thermal bands combination are the most inaccurate ones due to heat dispersion (the pixel resolution is only 100 meters), but they proceed more information in false coloring. This feature is used for soil moisture and evapotranspiration assessment and therefore for water application rate defining.
About the author:
Petro Kogut has a PhD in Physics and Mathematics and is the author of multiple scientific publications. He is the Soros Associated Professor as well as the head of the department of differential equations in the Oles Honchar Dnipro National University and has received a number of grants, prizes, honorary decorations, medals, and other awards. Prof. Dr. Petro Kogut is a science advisor for EOSDA.
More news
Construction site monitoring: The guide to remote progress tracking with satellite images
From cameras and drones to satellites: a practical look at how construction site monitoring works, where each tool shines, and what a remote, orbital view actually adds.
SAR imagery: How synthetic aperture radar technology works
Want to monitor assets without weather delays? Learn how SAR imagery captures soil moisture, floods, and structural shifts through clouds and smoke for your monitoring projects.
Optical satellite imagery: Getting insights from space
Ground inspections can be slow and expensive. Discover how commercial optical satellite imagery simplifies remote site monitoring and supports daily operational decisions.