Global warming has not been kind to frigid zones of Earth, causing polar ice caps melting at increased rates. The rising ocean temperatures leave no chance to the Arctic that mostly consists of sea ice, while Antarctic ice mostly sits on land, which slows down the melting.
Radar satellite images provide invaluable data for monitoring the ice sheet state and knowing how fast the ice caps melting is developing. Remote sensing allows to keep track of all calving stages – from rift detection to iceberg breakaway – as well as trace the drifting icebergs and measure ice cover.
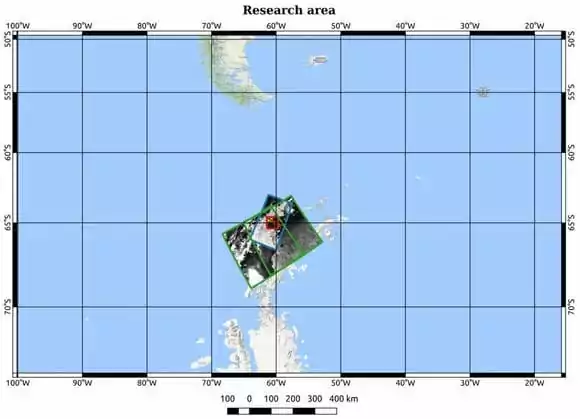
Scientific facts suggest that Antarctica melting tripled in the past 5 years, mainly due to West Antarctica ice losses triggered by the warm ocean currents. We used ESA’s Sentinel-1 radar imagery and EOSDA LandViewer to observe that region, and chose Larsen glacier to study in more detail.
If entirely melt, the Antarctic ice sheet will increase global sea levels by 190 feet (58 meters)
As observed from space, the glacier has been gradually melting since mid 90s. This led to the formation of large drifting icebergs, which pose threat to ships and contribute to increase in the world’s ocean level as they melt. The data from SAR (Synthetic aperture radar) instrument carried by Sentinel-1 satellite allowed us to watch one of the iceberg break-offs from Larsen glacier in more detail.
On 2017 New Year’s Eve, a 1,855 sq km iceberg split from the Larsen Ice Shelf. To study the event, two different satellite datasets were used: a pair of before and after images from Sentinel-1B with a 40-m spatial resolution – for tracing the break-off development, and post-split Landsat-8 satellite images with a 30-m spatial resolution – to compare results and validate the observations.
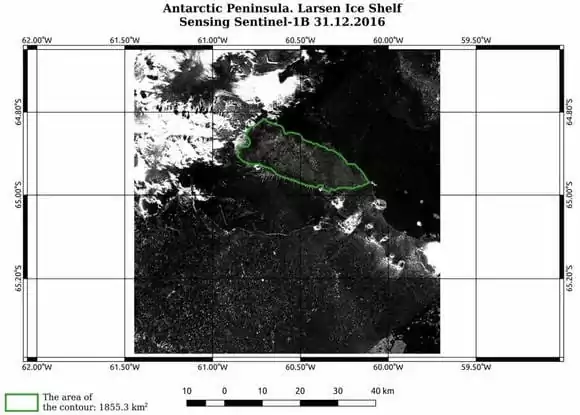
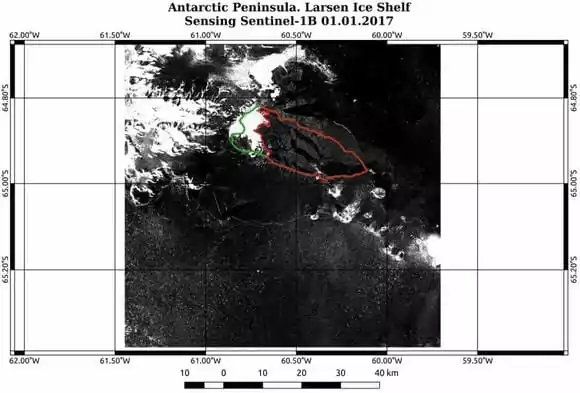
The Sentinel-1B satellite image on December 31 2016, in HH polarization, captured a visible outline of soon-to-be iceberg, originating from the ice break-off (marked green). The next image taken on January 1 depicts the effects of recent break-off: the drifting ice fragments are clearly visible against the simulated outline of Larsen glacier before the split (marked red).
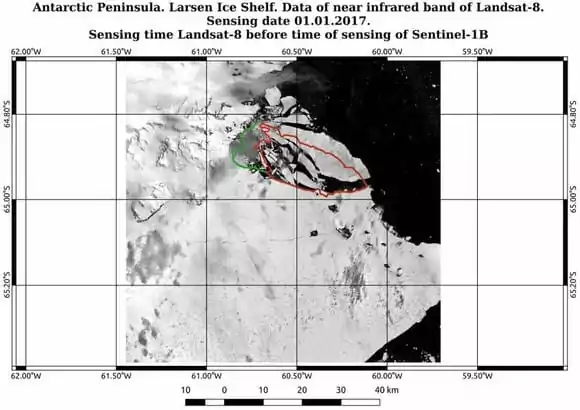
Despite a fair amount of clouds and almost 11-hour gap between image acquisition, the outline of the calved iceberg is nearly the same on Landsat 8 near infrared imagery. Slight difference can be explained by different timing of the image collecting: the glacier fragments could have regrouped before the next image was taken.
Further analysis of the area with radar imagery shows there are more things to watch on Larsen glacier. Ice cover is speckled with rifts of different size. One of them, which runs across the glacier, can as well be seen in Landsat images as thin black line.
That thin line grabbed the attention of scientists and big-name international media. The Independent, BBC, The Guardian, and Polar News wrote in January that there’s a risk of having a giant Delaware-sized iceberg break off due to sudden expansion of the rift. And it did break off in July 2017 – a 5,800 sq km ice giant A-68, slowly floated away, splintering into more new icebergs.
Antarctic ice melt is causing the formation of rifts, and calving of icebergs that often drift away to warm ocean waters; the icebergs melting further contributes to ocean level rise. This is a very significant global issue, which particularly affects countries that border on the world’s oceans and have a gently sloping terrain. On a positive note, radar remote sensing of ice cover has proved its worth, giving more knowledge of why are the polar ice caps melting and creating hope that we will never see Antarctica without ice.
About the author:
Kateryna Sergieieva has a Ph.D. in information technologies and 15 years of experience in remote sensing. She is a Senior Scientist at EOSDA responsible for developing technologies for satellite monitoring and surface feature change detection. Kateryna is an author of over 60 scientific publications.
More news
SAR imagery: How synthetic aperture radar technology works
Want to monitor assets without weather delays? Learn how SAR imagery captures soil moisture, floods, and structural shifts through clouds and smoke for your monitoring projects.
Optical satellite imagery: Getting insights from space
Ground inspections can be slow and expensive. Discover how commercial optical satellite imagery simplifies remote site monitoring and supports daily operational decisions.
Natural Disasters 2024: Extreme Weather On The Rise
Take a closer look at the 2024 natural disasters that shook the planet to reveal their causes, spread, and the massive challenges they created we all need to solve.