When it comes to the monitoring of extended territories which are located near or on the edges of scenes, the user faces a time-consuming and annoying process of manual selection and combining numerous suitable images so that they reliably cover their area of interest (AOI). And if the user has already selected the necessary images, he still needs to stitch them into one image using special software, or switch between them in-browser.
In addition, in case you need to obtain data for different time periods, the same procedure should be repeated manyfold. It takes time and effort, but still does not provide the expected accuracy as you would find from suitable images from Sentinel or Landsat, which would fully cover the entire territory.
Since it is hard, if not impossible, to find suitable images and manually combine them so that there are no blank spaces, further analysis results in a loss of valuable insights.
Your Challenge Fits Our Solution
Based on user feedback we have designed Mosaic – a powerful tool, which you can safely entrust with this work. Mosaic generates and automatically combines the data from two or more images into one, completely covering your AOI. Such an image can be processed and analyzed, like any single scene.
This feature fixes several issues simultaneously: it automatically provides the required data without blind zones left beyond the boundaries of the current area and without specific software, so that your insights aren’t lost and time is saved. Thus, the main challenge is to make the use of this imagery as simple and effective as possible within any task.
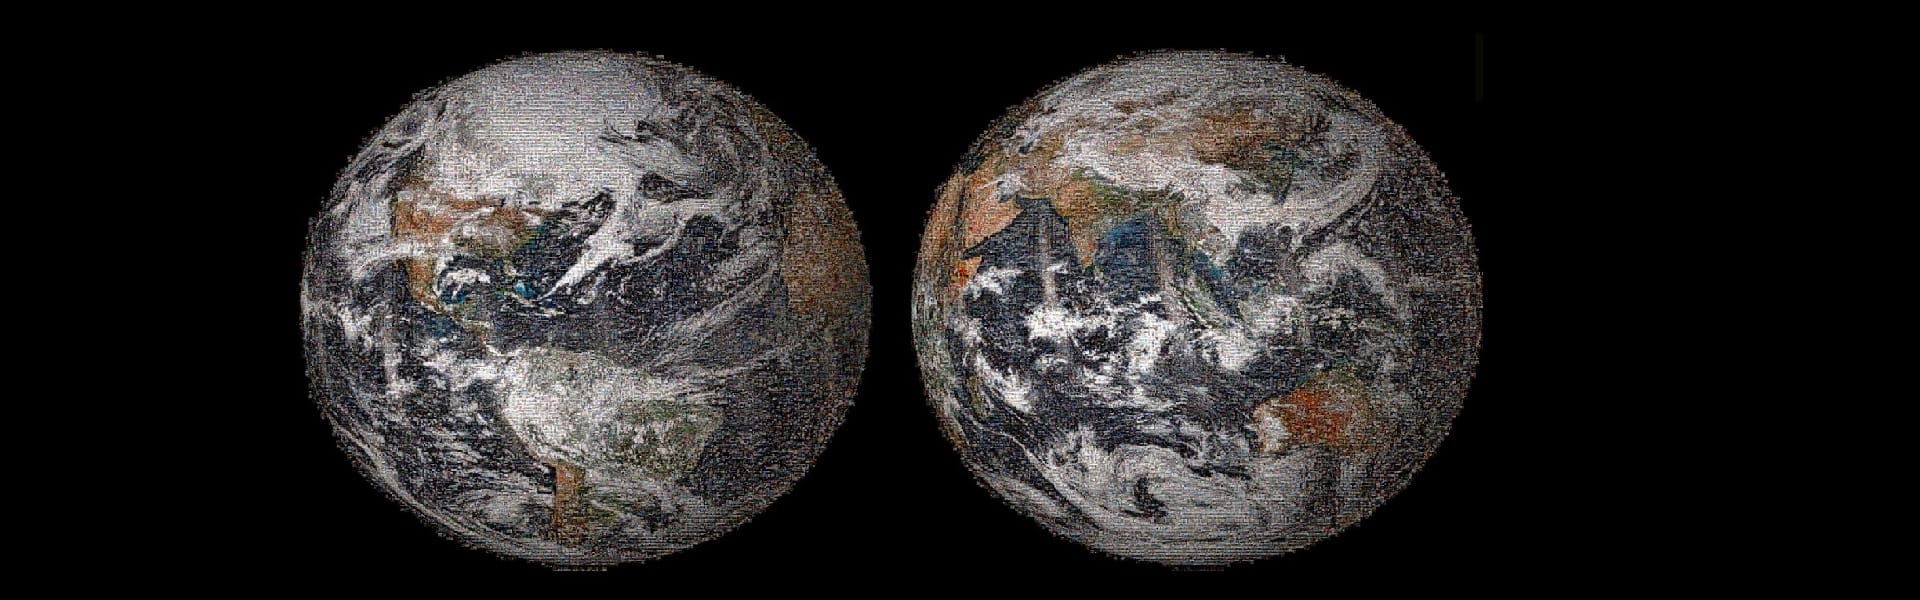
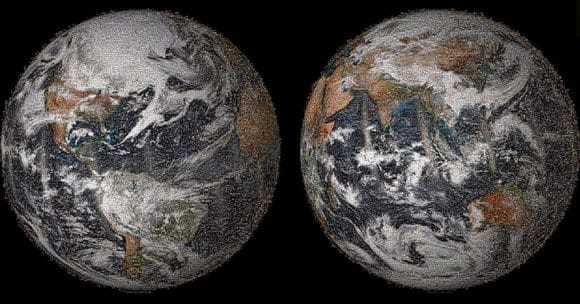
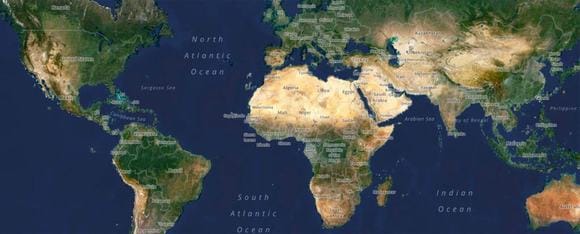
An interesting example is NASA’s Global selfie – photomosaic comprised of over 36,000 individual photographs taken on or around April 22, 2014, also known as Earth Day. Just imagine how long it would take to “manually” select the most suitable images and combine them into one.
Cut Your Lost Time And Energy With Our New Mosaic Tool
As it was mentioned above, occasionally some sections of your AOI, most notably in large AOI’s that cover several scenes, are not entirely covered:
EOSDA LandViewer provides you with a raster dataset created from several images with Mosaic. It is visualized on the map as an individual image that fully covers your AOI; the generated scenes are obtained from one sensor, for the required day. In the following image we can see how Mosaic 100% covers our AOI using six scenes from the same day:
Such an approach is efficiently employed for data visualization, mapping and monitoring of large areas. However, it varies considerably from app to app; some of them do not allow you to select the date, others create a Mosaic without considering your AOI. Let’s look at how the Mosaic feature is implemented in other GIS tools:
Mosaic Feature Among Currently Available GIS Platforms
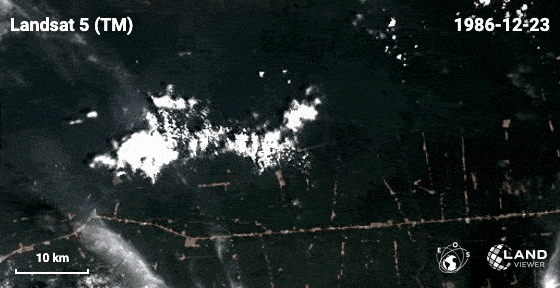
Global mosaic coverage (landsatexplorer.esri.com):
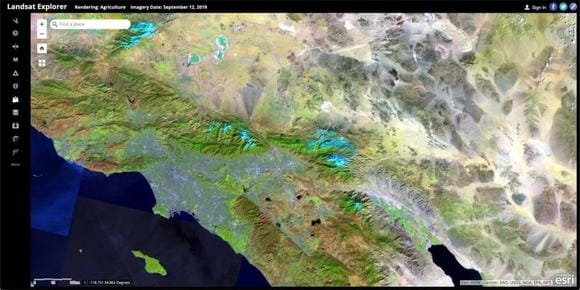
In this case, Mosaic is automatically created on the server side using images from the platform archive. Due to the fact that this type of Mosaic is updated every few months, it is definitely not an option for monitoring deforestation, construction sites, natural disasters, etc..
The next approach involves rendering Mosaic over all passes a satellites makes per day, such as Sentinel-hub’s:
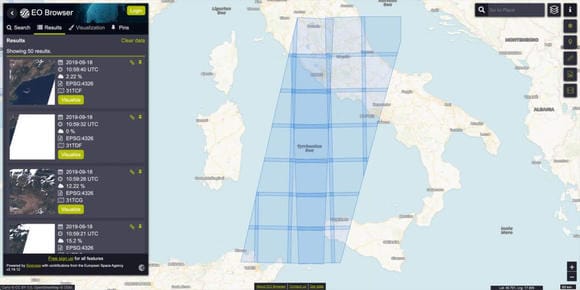
Since the distance between adjacent satellite passes is quite large, and your AOI is not reliably covered, this may lead to a loss of data that remains well-beyond the boundaries of the current zone.
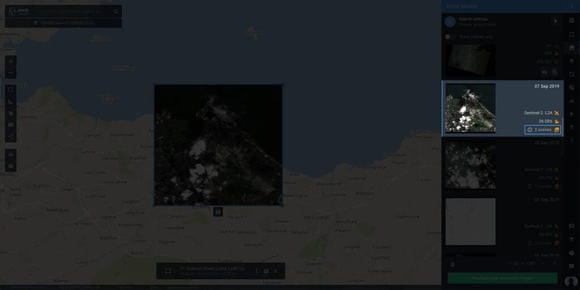
This approach allows you to create Mosaic within the set AOI, as it’s implemented at Planet.
Such an approach is considered to be the most successful, since it allows you to get valuable data while filtering out anything unnecessary.
EOSDA LandViewer Offers Its Own Concept For Mosaic
Our Mosaic is generated with proprietary algorithms within a set AOI and is exclusively available in EOSDA LandViewer. Therefore, in order to get an advanced Mosaic, you have to set (draw/upload) your AOI. Actually, it’s the only stipulation to launch Mosaic in EOSDA LandViewer. Select one of the available options that fits you most:
- If you drop a pin on the map, EOSDA LandViewer will generate a list of individual scenes, as it did before; the next step is to select the most suitable for your needs.
- If you draw a large AOI, which covers several scenes, Mosaic will be created automatically. The number of scenes used to create Mosaic is indicated in a preview card.
Thus, the results will be filtered according to your specific requirements, so that you don’t spend too much time searching for exactly what you need. You can specify the following settings: image date, cloud coverage, sun elevation, and data source.
NB: your AOI can be of any shape, not just rectangular or circular. In this case, the system will fit your AOI into a specific geometry (bbox), outlined around the AOI, according to which the images will be rendered.
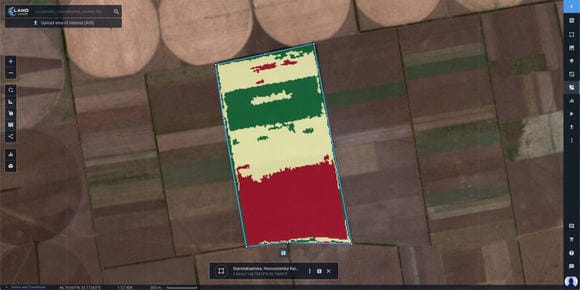
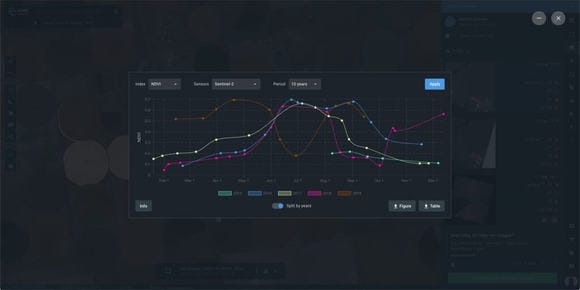
At the moment, various spectral indices and band combinations can be applied to Mosaic, just like to any regular scene in EOSDA LandViewer. In addition, Mosaic is integrated with the Time-lapse feature, so that now you can create GIFs or video stories and share them on the Internet.
Moreover, in the short run we will expand the analytical opportunities with the following tools:
- Clustering Enable effective zone management in accordance with index values range.
- Change detection track changes within your AOI for various time intervals.
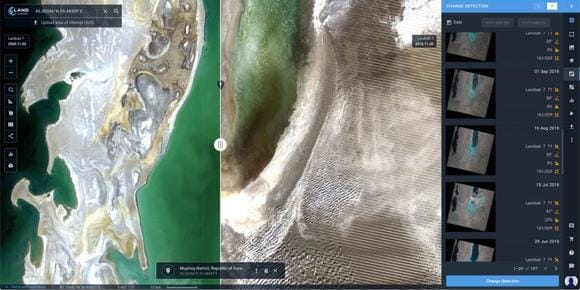
- Time series analysis Visualize historical data in dynamics and track changes within your AOI
All these analytics are already in the pipeline. Stay tuned!
EOSDA LandViewer
A vast online catalog of free satellite imagery for processing and downloading.
Mosaic Image Downloads Options
By default the system offers three options to download Mosaic: Visual, Analytics or Indices, depending on user request.
- In the event that you pick the Visual download type, the results will be delivered as JPEG, KMZ or GeoTIFF file formats, containing the merged scenes (all of the scenes that fall into your AOI);

- Downloading using the Analytics tab will result in an archive of the merged bands without metadata. Note that you are able to select the bands for downloading.

- You can pick the Indices type as well, in this case the download results will be in the form of a TIFF file with the specific spectral index applied. You can choose the one that suits you best from the eleven defaults, or create a custom one.
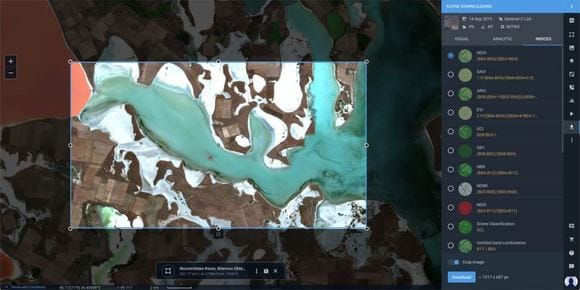
You can also crop the image prior to downloading. To use this option, activate the “Crop image” option and fit the “bbox” to the area you want to download. If cropping settings are not set, then the entire Mosaic will be downloaded automatically.
NB: You are also able to use “Mosaic” or “Fragments of bulk”. This means the system can either download the merged scenes with the “Mosaic” download option or download a set of individual scenes if the “Fragments of bulk” parameter is selected.
Mosaic In Action
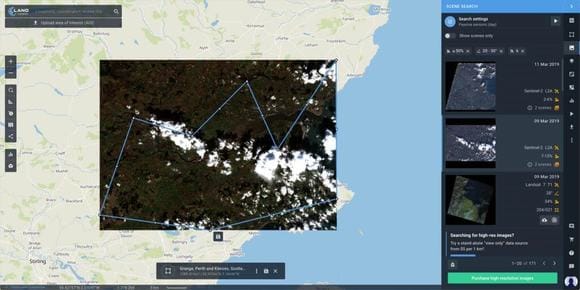
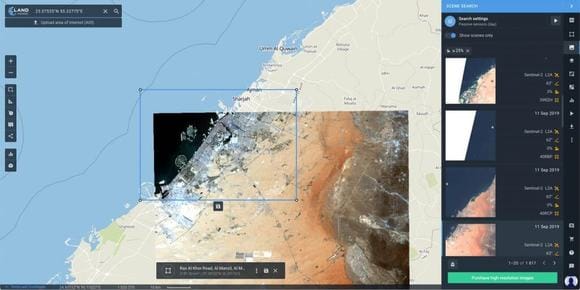
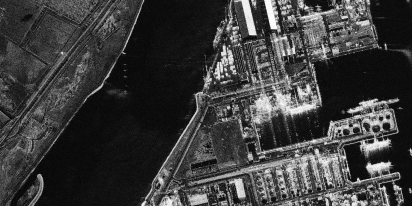
Use case 1 – Construction development monitoring, Dubai
Objective: To monitor the development of construction sites within a large area of interest (AOI)
Target audience: All construction companies
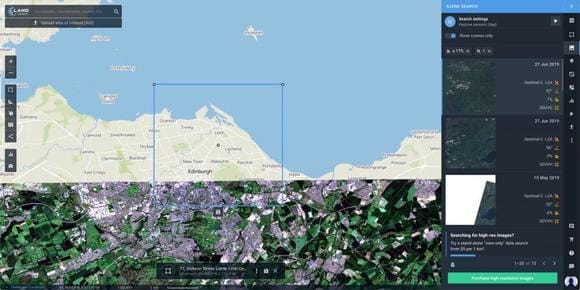
Problem: The user is a player in the construction market and has a need to constantly monitor the construction development ongoing in Dubai. He draws the area of interest and selects the image, taken on July 11, 2019. But eventually, as it can be seen in the screenshot, one image doesn’t cover his area of interest.
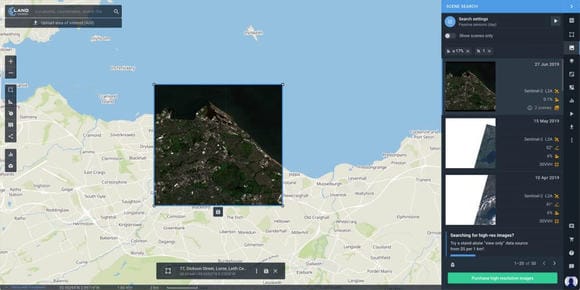
Solution: In order to cover the entire AOI, the user should perform several simple actions: specify the image date, cloud coverage, sun elevation, select the data source and pick a Mosaic that fully covers the AOI from the search results.
Result: AOI is completely covered with Mosaic comprised of six individual scenes.
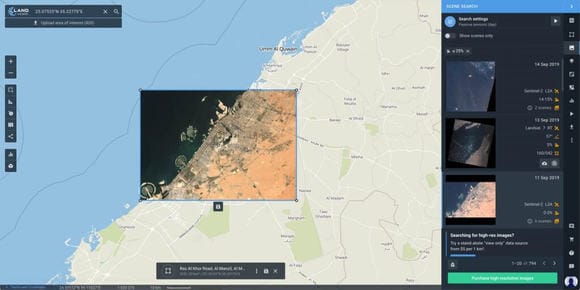
Conclusion: Prior to monitoring large areas, the user had to switch between several scenes or combine them manually into one, which was not an easy, as well as time-consuming task. Now, everything’s changed: just set your AOI and EOSDA LandViewer will automatically merge the scenes into one image to fully cover your area of interest.
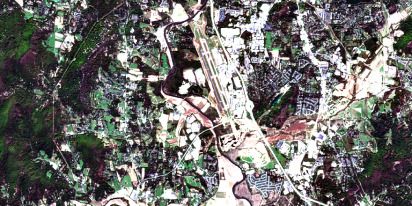
Use case 2 – Deforestation in Rondonia, Brazil
Objective: To monitor deforestation within a large area of interest over an extended period of time.
Target audience: All organizations dealing with deforestation issues
Problem: An organization dealing with illegal deforestation in Brazil wants to monitor vast areas of tropical forest. For this purpose they use satellite monitoring, but there’s no way to reliably cover the area of interest, since it always turns out larger than the available satellite image. In general, they have to deal with several images, but since they conduct monitoring at different time periods, the number of these images is increasing exponentially.
Solution: To solve the problem set the AOI, select the required parameters: time period, cloudiness, and sun elevation. Then select the Stories feature and pick the appropriate images. Edit the GIF animation and delete whatever is unnecessary.
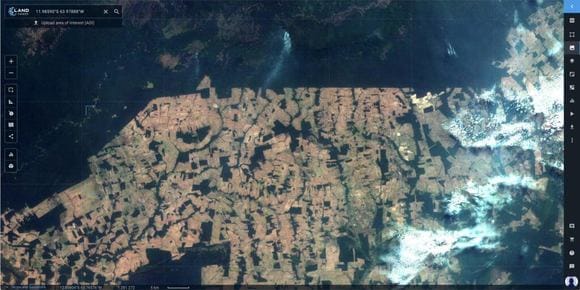
Result: The animation clearly shows the scale of deforestation in Rondonia, Brazil over the years. With this GIF you can assess the damage, conduct analysis, gather statistics, etc.
Conclusion: Earlier, to assess deforestation it was unavoidable to select images for each year, combine them and so forth. Now however, you can get an animation or video of the required AOI in simply a few clicks.
Work Easier With Mosaic
The Mosaic feature takes the grind and hardwork for itself and provides you with an off-the-shelf satellite image that reliably covers your AOI, no matter the size. Mosaic is created using data from one sensor and for the day you need – quick and simple. EOSDA LandViewer offers an automatic mosaic feature that frees you from manually processing a bunch of images, now that you can do it all in just a couple of clicks, leaving time for what is really important.
For detailed information on Mosaic, check EOSDA LandViewer’s user-guide or email us at sales@eosda.com
About the author:
Kateryna Sergieieva has a Ph.D. in information technologies and 15 years of experience in remote sensing. She is a Senior Scientist at EOSDA responsible for developing technologies for satellite monitoring and surface feature change detection. Kateryna is an author of over 60 scientific publications.
More news
SAR imagery: How synthetic aperture radar technology works
Want to monitor assets without weather delays? Learn how SAR imagery captures soil moisture, floods, and structural shifts through clouds and smoke for your monitoring projects.
Optical satellite imagery: Getting insights from space
Ground inspections can be slow and expensive. Discover how commercial optical satellite imagery simplifies remote site monitoring and supports daily operational decisions.
Natural Disasters 2024: Extreme Weather On The Rise
Take a closer look at the 2024 natural disasters that shook the planet to reveal their causes, spread, and the massive challenges they created we all need to solve.