We live in a wonderful era where free satellite imagery of Earth is accessible to anyone with a desire to explore. However, with so many online providers out there, it can be hard to discover the one that houses the specific data you require. So we’ve compiled a curated list of the best free satellite imagery platforms, each with its own unique set of capabilities geared to certain needs. Whether you seek real-time streaming of current satellite data, historical map archives, or high-resolution imagery for scientific research or personal projects, our list of providers will help you navigate the vast free satellite data options available.
EOSDA LandViewer: Free Access To Satellite Images
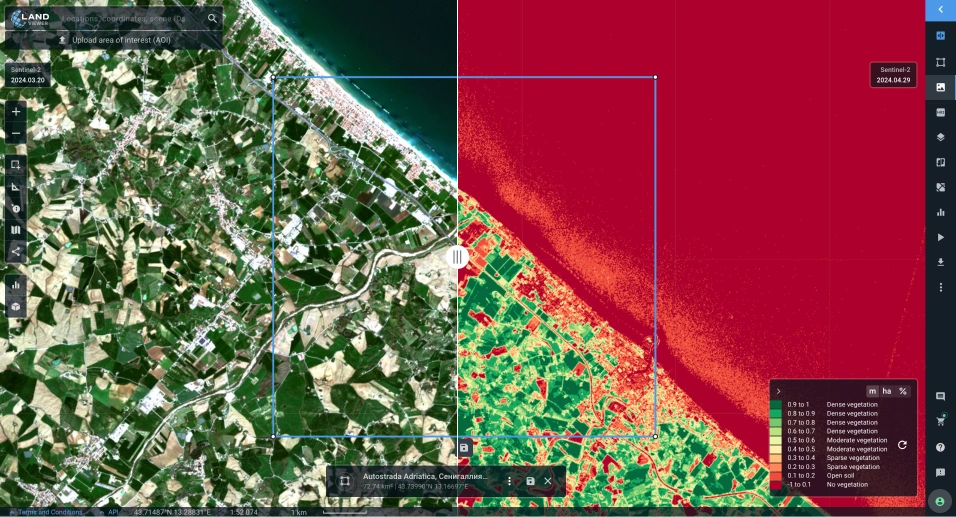
EOSDA LandViewer is a GIS database with an easy-to-master interface that gives free access to a catalog of historical and live satellite images alongside an extensive analytic tool. It also offers free previews for you to select and order only the pictures you require.
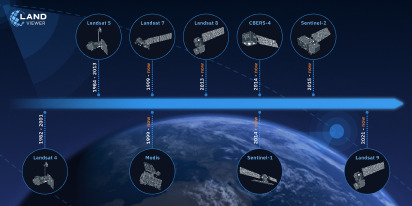
Imagery. EOSDA LandViewer offers miscellaneous global satellite imagery. You can get the most free satellite images from Landsat 8 and 7, Sentinel 1 and 2, CBERS-4, MODIS, aerial data from NAIP, or historical satellite imagery from Landsat 4 and 5.
On the platform, you may also search and preview for free high-resolution commercial satellite imagery from the world’s top providers before deciding which exact pieces to purchase. Some of the datasets from high-resolution satellite imagery providers you can find there include Kompsat-2, Kompsat-3, Kompsat-3A, SuperView-1, SuperView-2, SuperView-3, SuperView-4, Gaofen-1, Gaofen-2, Ziyuan-3, GEOSAT-2, and TripleSat; the best spatial resolution comes up to 40 cm per pixel.
Search. The search for free satellite topographic maps is simple and straightforward: once you set the Area of Interest using one of the multiple options (including file upload), select the type of sensor, and pick the dates. Additionally, you are free to apply cloud cover percentage, solar elevation, and AOI coverage percentage filters. Make sure to save your Area of Interest and subscribe to new scenes to get notifications about the latest satellite images, free of charge, available for your chosen territory.
Download. When it comes to downloading free satellite maps, EOSDA LandViewer has a lot to offer. Let’s imagine you’ve come for a free Sentinel satellite imagery. What are your options? First, you can download a free full or manually cropped Natural Color image in JPEG, KMZ, or GeoTIFF. If you need only specific spectral bands, use the Analytic download tab to get only those you will use. And the third option is downloading a processed image: a band combination or a calculated index.
If you don’t want to store satellite maps on your PC, use the WMS feature to streamline it for desktop GIS software.
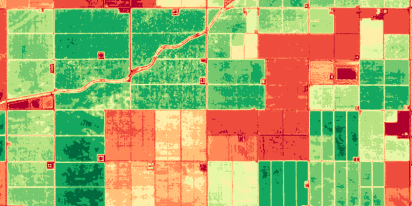
Analysis. Unlike most free satellite imagery providers, EOSDA LandViewer enables instant visualization and analysis of the maps you’ve found. Over twenty default band combinations and indices such as NDVI, NBR, and SAVI, the raster calculator-like custom index builder, time series analysis, clustering, change detection, and more of its tools are meant to help extract value from online satellite maps for free.
EOSDA LandViewer is the best free satellite imagery provider for GIS beginners and experts from other industries (agriculture, forestry, construction, mining, communications, environmental protection) who don’t use special GIS software and are looking for satellite maps with fast and accurate analytics included.
USGS EarthExplorer: Free-To-Use Satellite Imagery
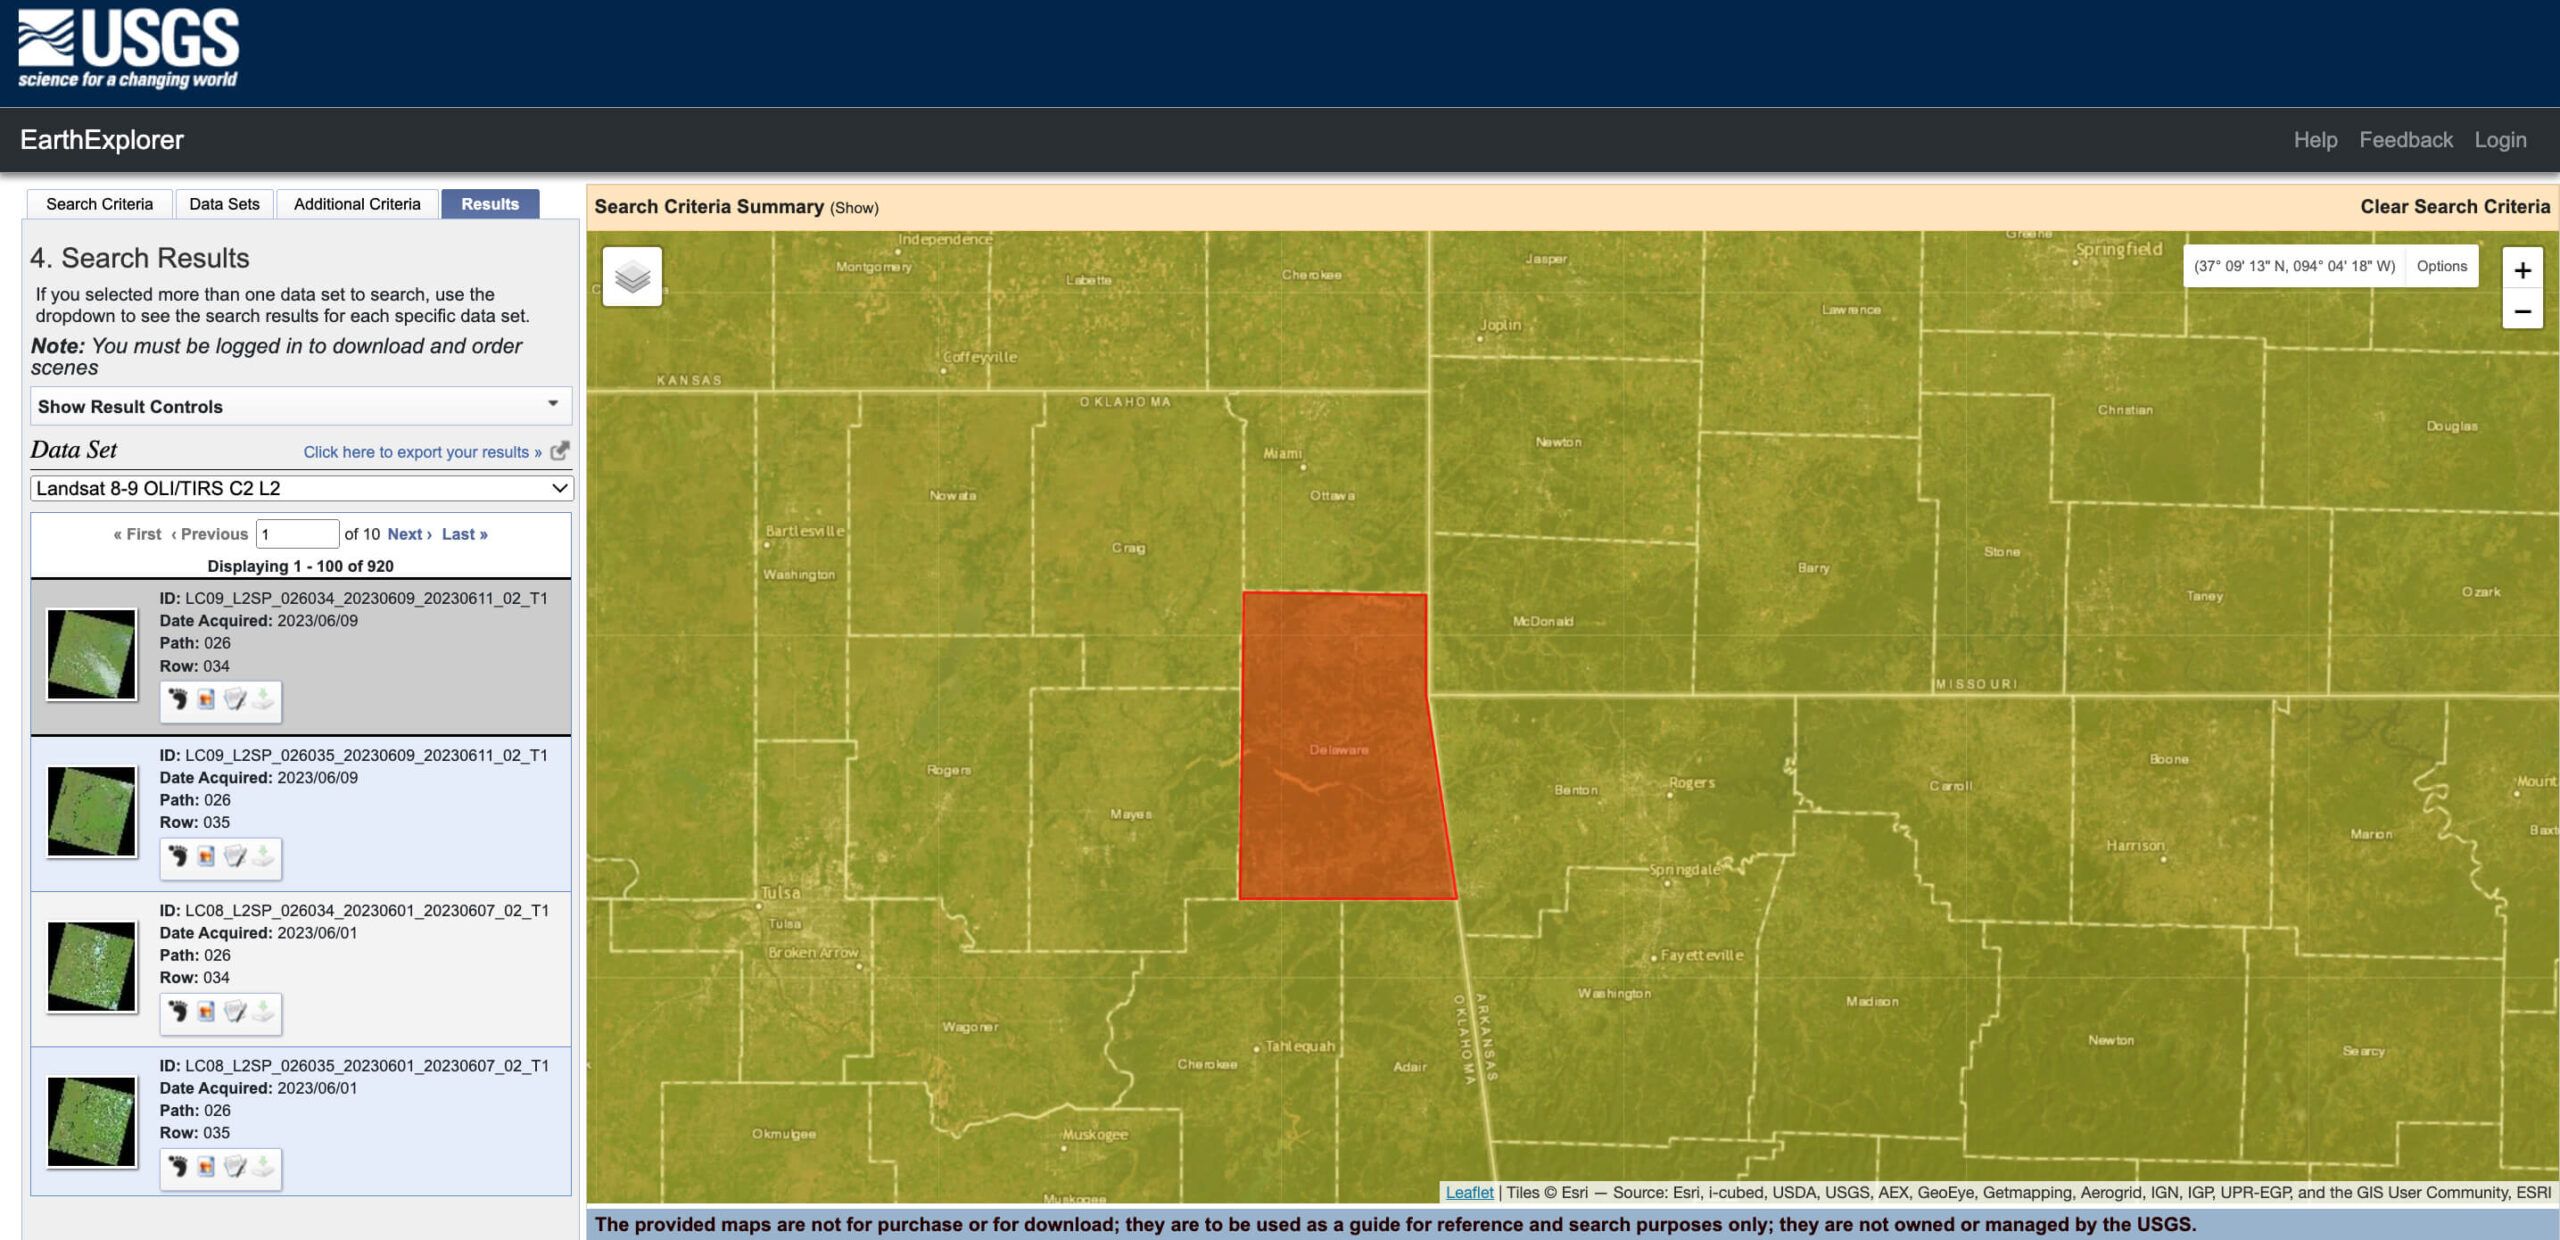
The USGS agency has the longest record of collecting free GIS data (satellite imagery, aerial, and UAV), which is made available via EarthExplorer (EE).
Imagery. The selection of space-derived imagery in EarthExplorer is overwhelming, from optical and radar data to weather satellite photos to digital elevation maps. Using this provider, you will find 40 years’ worth of free satellite images from USGS-NASA Landsat missions and a diversity of data from other NASA remote sensors (Terra and Aqua MODIS, ASTER, VIIRS, etc.). The provider also features free satellite map datasets provided in collaboration with ISRO (Resourcesat-1 and 2), ESA, and some commercial high-resolution space-based images (IKONOS-2, OrbView-3, historical SPOT data).
Search. The provider allows you to narrow down the search for free satellite imagery by area, date, and cloud cover percentage. All the found tiles can be conveniently previewed one by one or all at once.
On top of the standard Area of Interest (AOI) selection options (address, coordinates, file upload, or drawing), the provider’s interface offers a feature-based search, which is pretty fun to test. For free, on satellite maps, you can find all possible features, even less common ones — like ancient roads or graves — anywhere in the world.
Download. For downloading large amounts of the USGS’s free satellite images of Earth at once, you will need to install the Bulk Download Application. Depending on the sensor, various free data products can be downloaded (Level 1-3, natural color and thermal imagery, etc.).
Analysis. The provider’s interface can be used for search, preview, and free GIS map download purposes only. If you want to analyze the retrieved free satellite imagery and maps, you will need special software.
EarthExplorer is an undisputed leader among free satellite imagery providers in terms of data variety, but it is not the most user-friendly, especially for a non-expert. It may take a while to familiarize yourself with all the buttons, menu options, and map datasets available on the provider’s platform. So be prepared that your first search for the required free satellite images and maps can be quite time-consuming.
NASA Earthdata Search: Access To Historical And New Satellite Images For Free
NASA’s Earthdata Search is the provider of online access to multiple collections of NASA’s EOSDIS (Earth Observing System Data and Information System) satellite imagery.
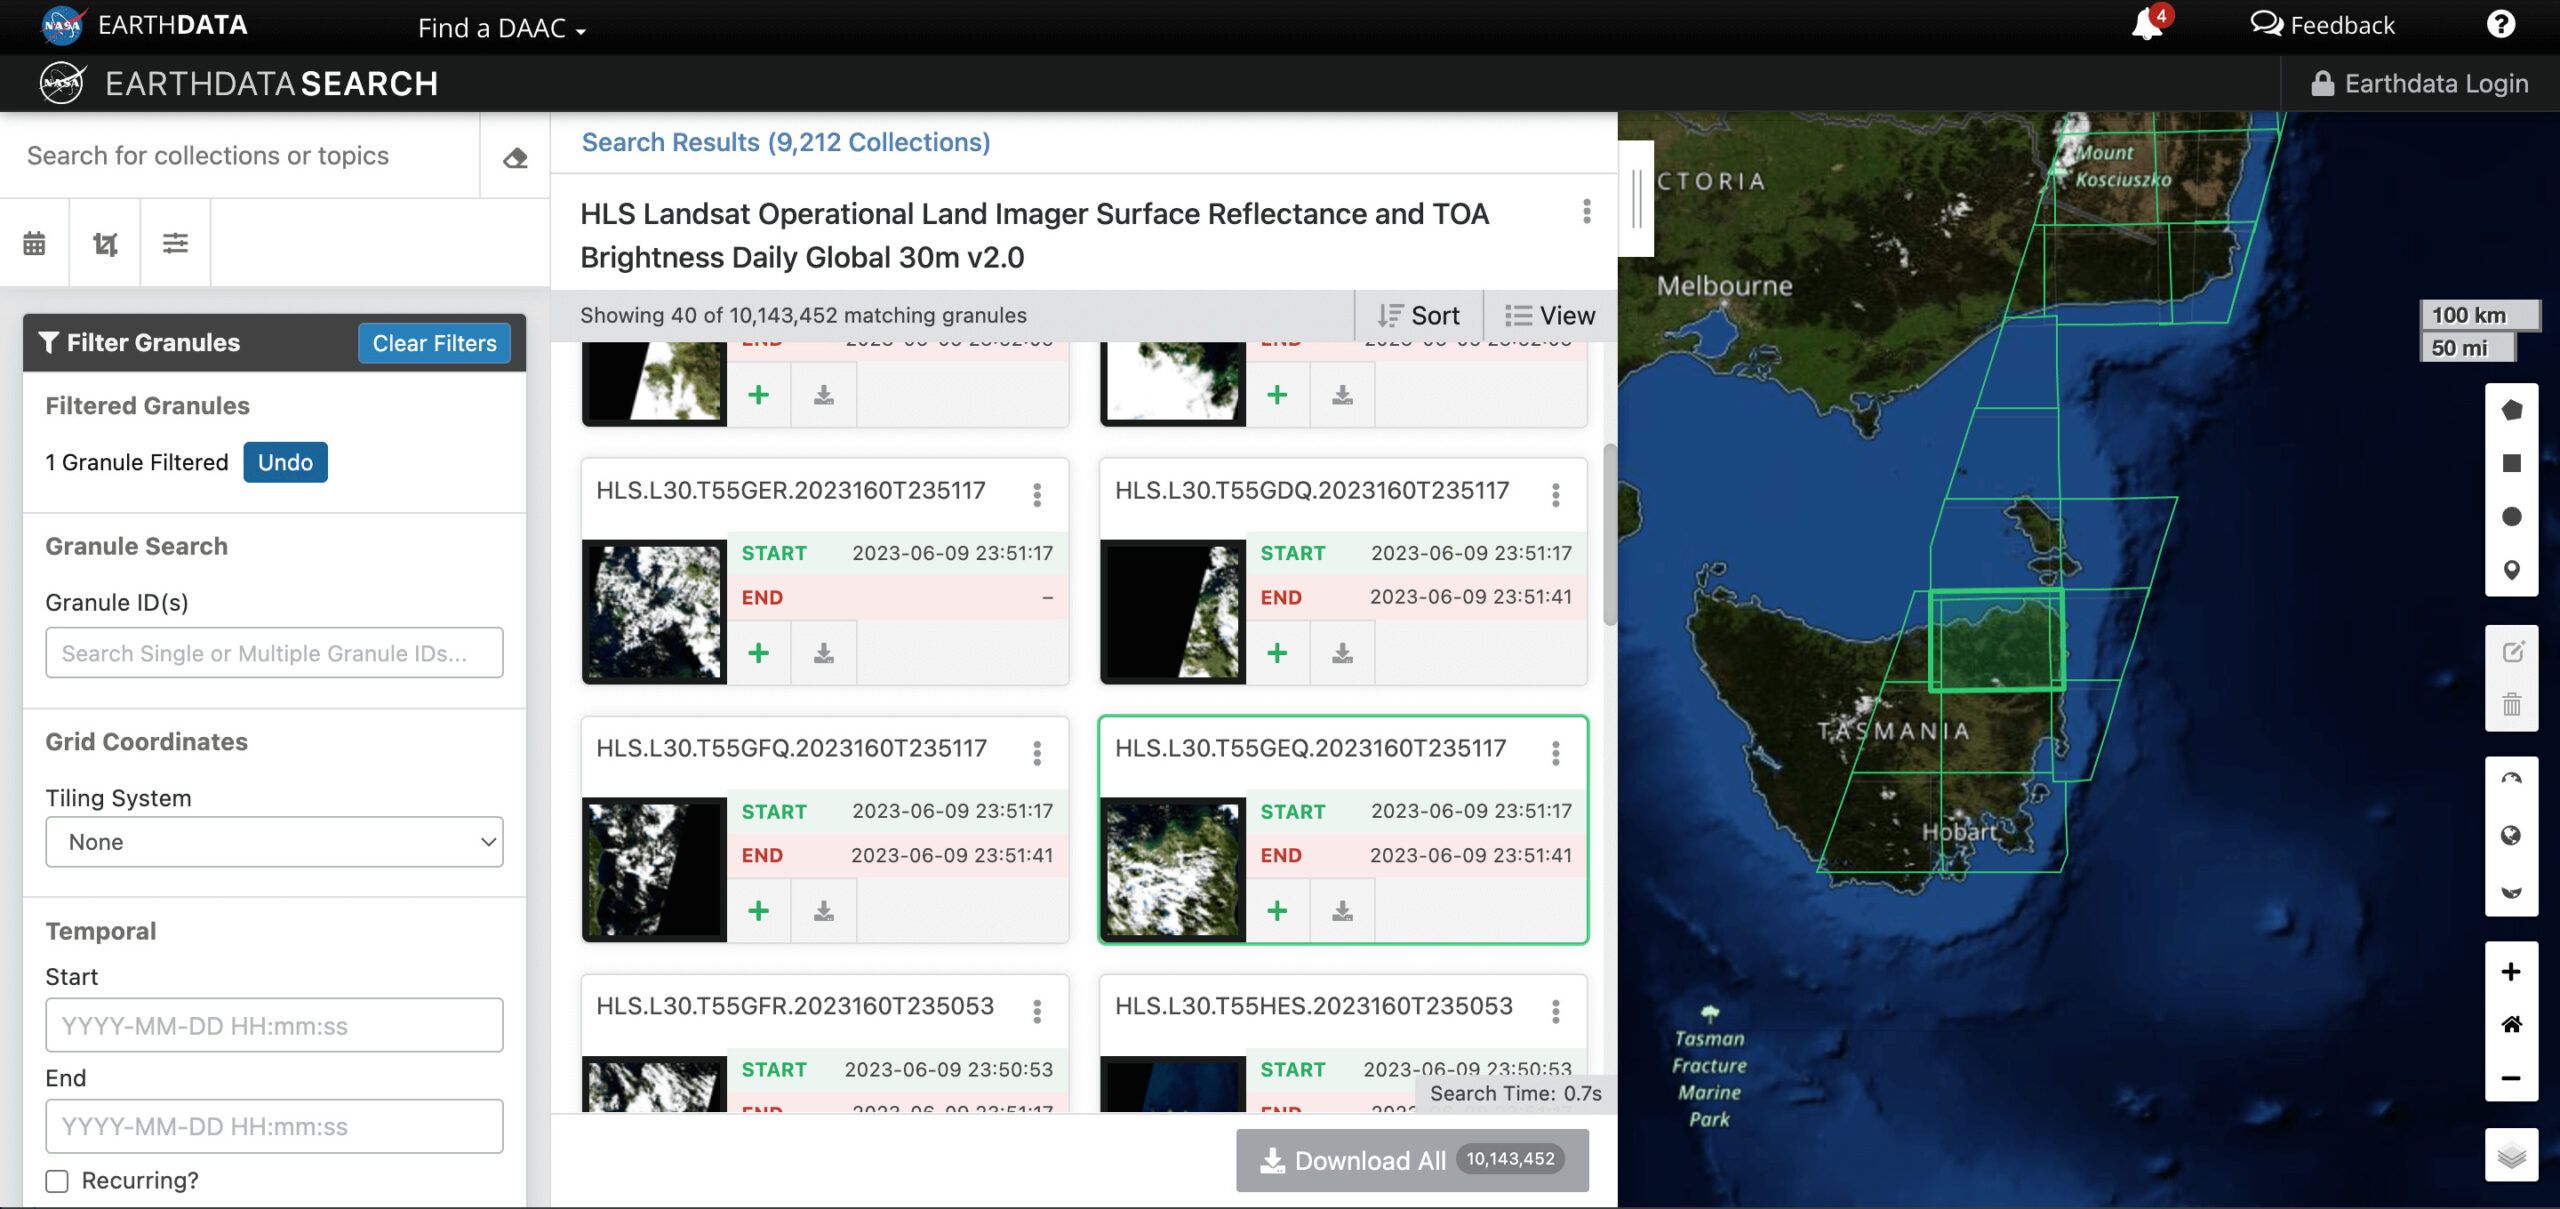
Imagery. In Earthdata Search, you will find a plethora of free NASA Earth science data from different sources, including satellites, aircraft, field measurements, and other programs. The amount of free real-time and historical satellite images enlisted in the “Platforms” tab of this provider is impressive: Aqua and Terra, ENVISAT, GOES, NOAA satellites, METEOSAT, Suomi-NPP, Nimbus, CALIPSO, Landsat, and much more free GIS maps that enable the study of the atmosphere, environment, ocean and sea, land cover, vegetation, ice cover, and topography.
Search. You will need plenty of patience to learn to navigate and find free satellite maps using the Earthdata Search provider. There are tutorials and detailed descriptions for every GIS data collection, but they are of little help unless you know exactly what you’re looking for. The selection of satellite images (granules) from a long list of collections that match your search criteria seems especially difficult to grasp. But the diversity of the provider’s free imagery and maps compensates for this inconvenience.
Download. Depending on the dataset, free satellite imagery download may require a few extra clicks to approve certain applications. Also, not all the free data from the provider can be previewed prior to saving to the PC.
Analysis. Unfortunately, this provider doesn’t feature any built-in tools for analysis.
Earthdata Search is truly an ocean of free NASA Earth observation data a researcher or scientist can dive into. However, it’s not the best free satellite imagery provider for amateurs, who may start with more user-friendly data providers and probably come back to it later to fill the gaps.
INPE Image Catalog: The Portuguese Portal With High-Quality Satellite Imagery
Brazil’s National Institute for Space Research (INPE in Portuguese) has its own online catalog of free current and historical satellite imagery. The INPE Image Catalog features nearly twenty free online satellite map collections for land cover, vegetation, water resources monitoring, and meteorological observations.
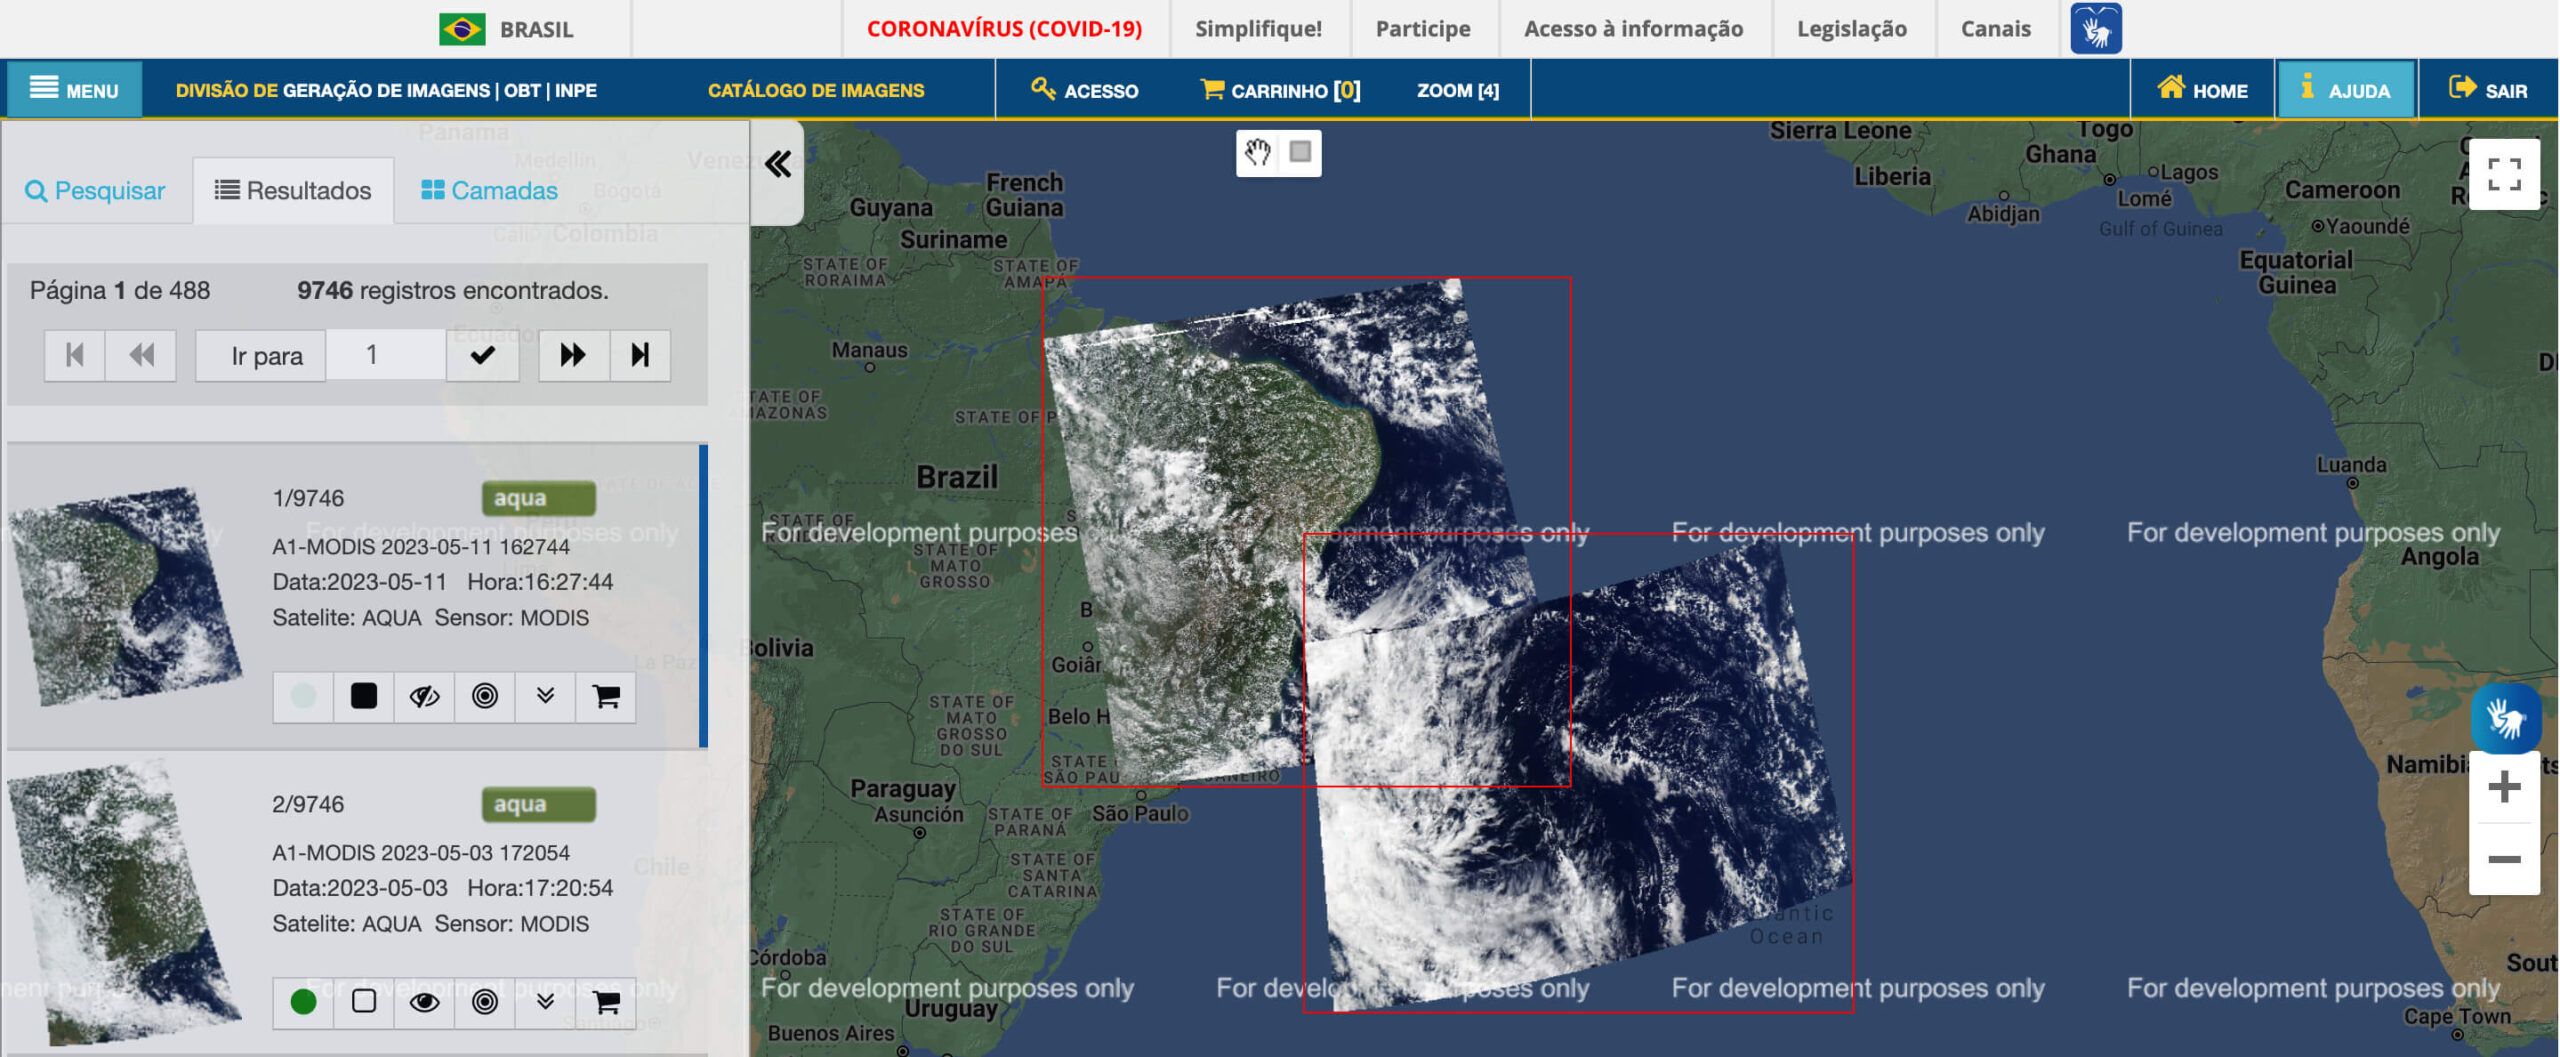
Imagery. The INPE Image Catalog is the go-to free satellite imagery source of maps of South and Central America and Africa only. The provider features satellite data from Brazil and China’s joint mission, CBERS-4, alongside the U.S., UK, and India’s Earth-observing missions: Aqua, Terra, Landsat-8, ResourceSat, Suomi-NPP, DEIMOS, and UK-DMC 2. Additional free GIS datasets from CBERS-2, Landsat 1-3, 5, and 7 satellites can be found in their a bit dated-looking cadastre.
Search. This free catalog is simple and laconic. The search can be conveniently limited to specific countries/areas, dates, or cloud cover percentages. You are free to preview the found tiles on a map, both separately and all at once.
Download. To access the provider’s high-resolution satellite images for free download, you need to add them to your cart and place an order. The downloading is carried out via an FTP link sent to your email address.
Analysis. As the word “catalog” in the provider’s name implies, this is merely a collection of photos with no accompanying analytical tools.
The INPE Image Catalog is recommended for users whose main interest lies in South and Central America or Africa. Unfortunately, this service provider doesn’t offer free global satellite imagery but, overall, is a good user-friendly option for quick search and download of satellite maps that can be later analyzed using another software.
Google Earth: Free Historical Satellite Imagery At Hand
The platform was previously known as Earth Viewer and belonged to Keyhole Inc., which was bought by Google in 2004. In 2005, the platform’s name was changed to Google Earth. The program is available in two versions: ordinary (free) and Pro, and works on Windows, Linux, macOS, Android, and iOS.
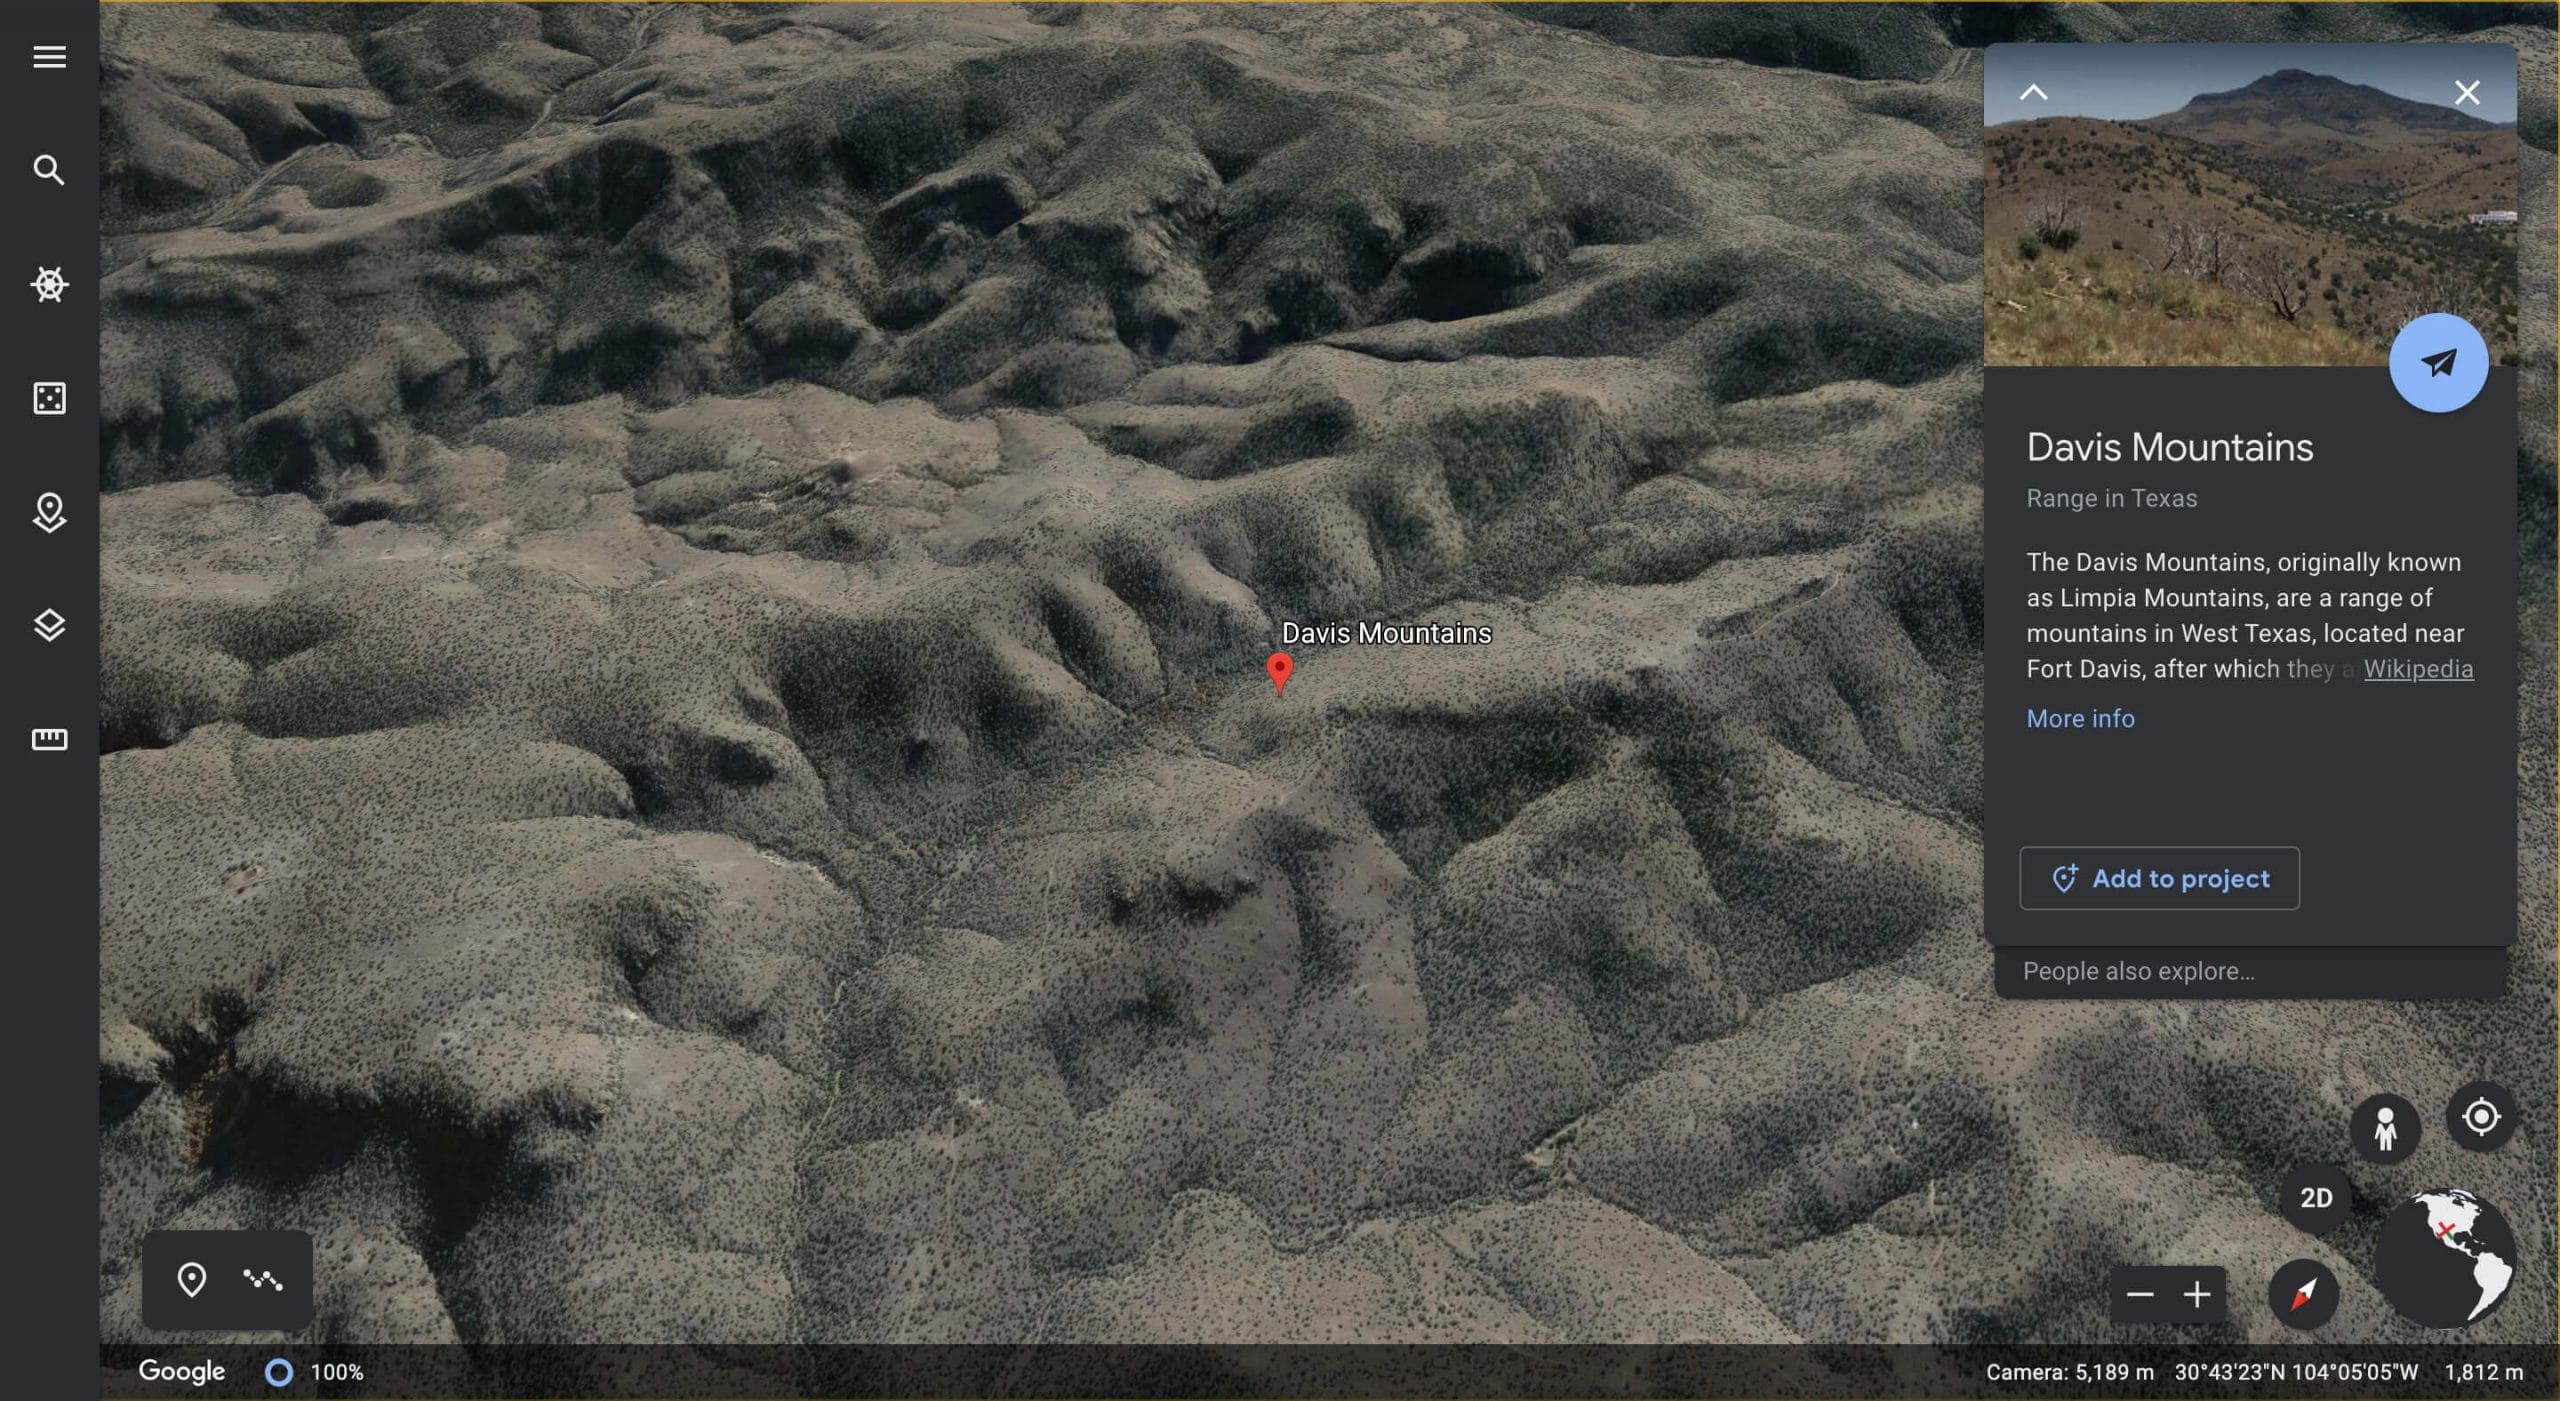
Imagery. The spatial resolution depends on the area, and the most precisely captured regions are Las Vegas, Nevada, and Cambridge (15 cm). Free satellite images from this provider come from Landsat-8 as well as aircraft, drones, kites, and balloons.
Search. The program allows entering the geographic location and hovering the mouse to zoom. Some satellite maps offered by the provider may be decades old. You can also see a 2D and 3D representation of Earth for free.
Download. The default file for free satellite imagery is KML or KMZ (zipped). The free version of the provider’s service allows printing images as they appear on the screen, while Google Earth Pro gives access to premium-quality photos and extended datasets, including historical data and importing and exporting GIS maps.
Analysis. To make up for the absence of analytical tools in Google Earth, the provider offers a separate platform, Earth Engine, as a free resource to the academic, research, and development communities.
Copernicus Data Space Ecosystem: Satellite Images For Free
Access to all free Sentinel data, along with new visualization and processing tools, is now available through the Copernicus Data Space Ecosystem, which went live in January 2023. Taking over from the Copernicus Open Access Hub, the ESA’s ecosystem is able to quench anyone’s thirst for the satellite imagery and maps free of charge.
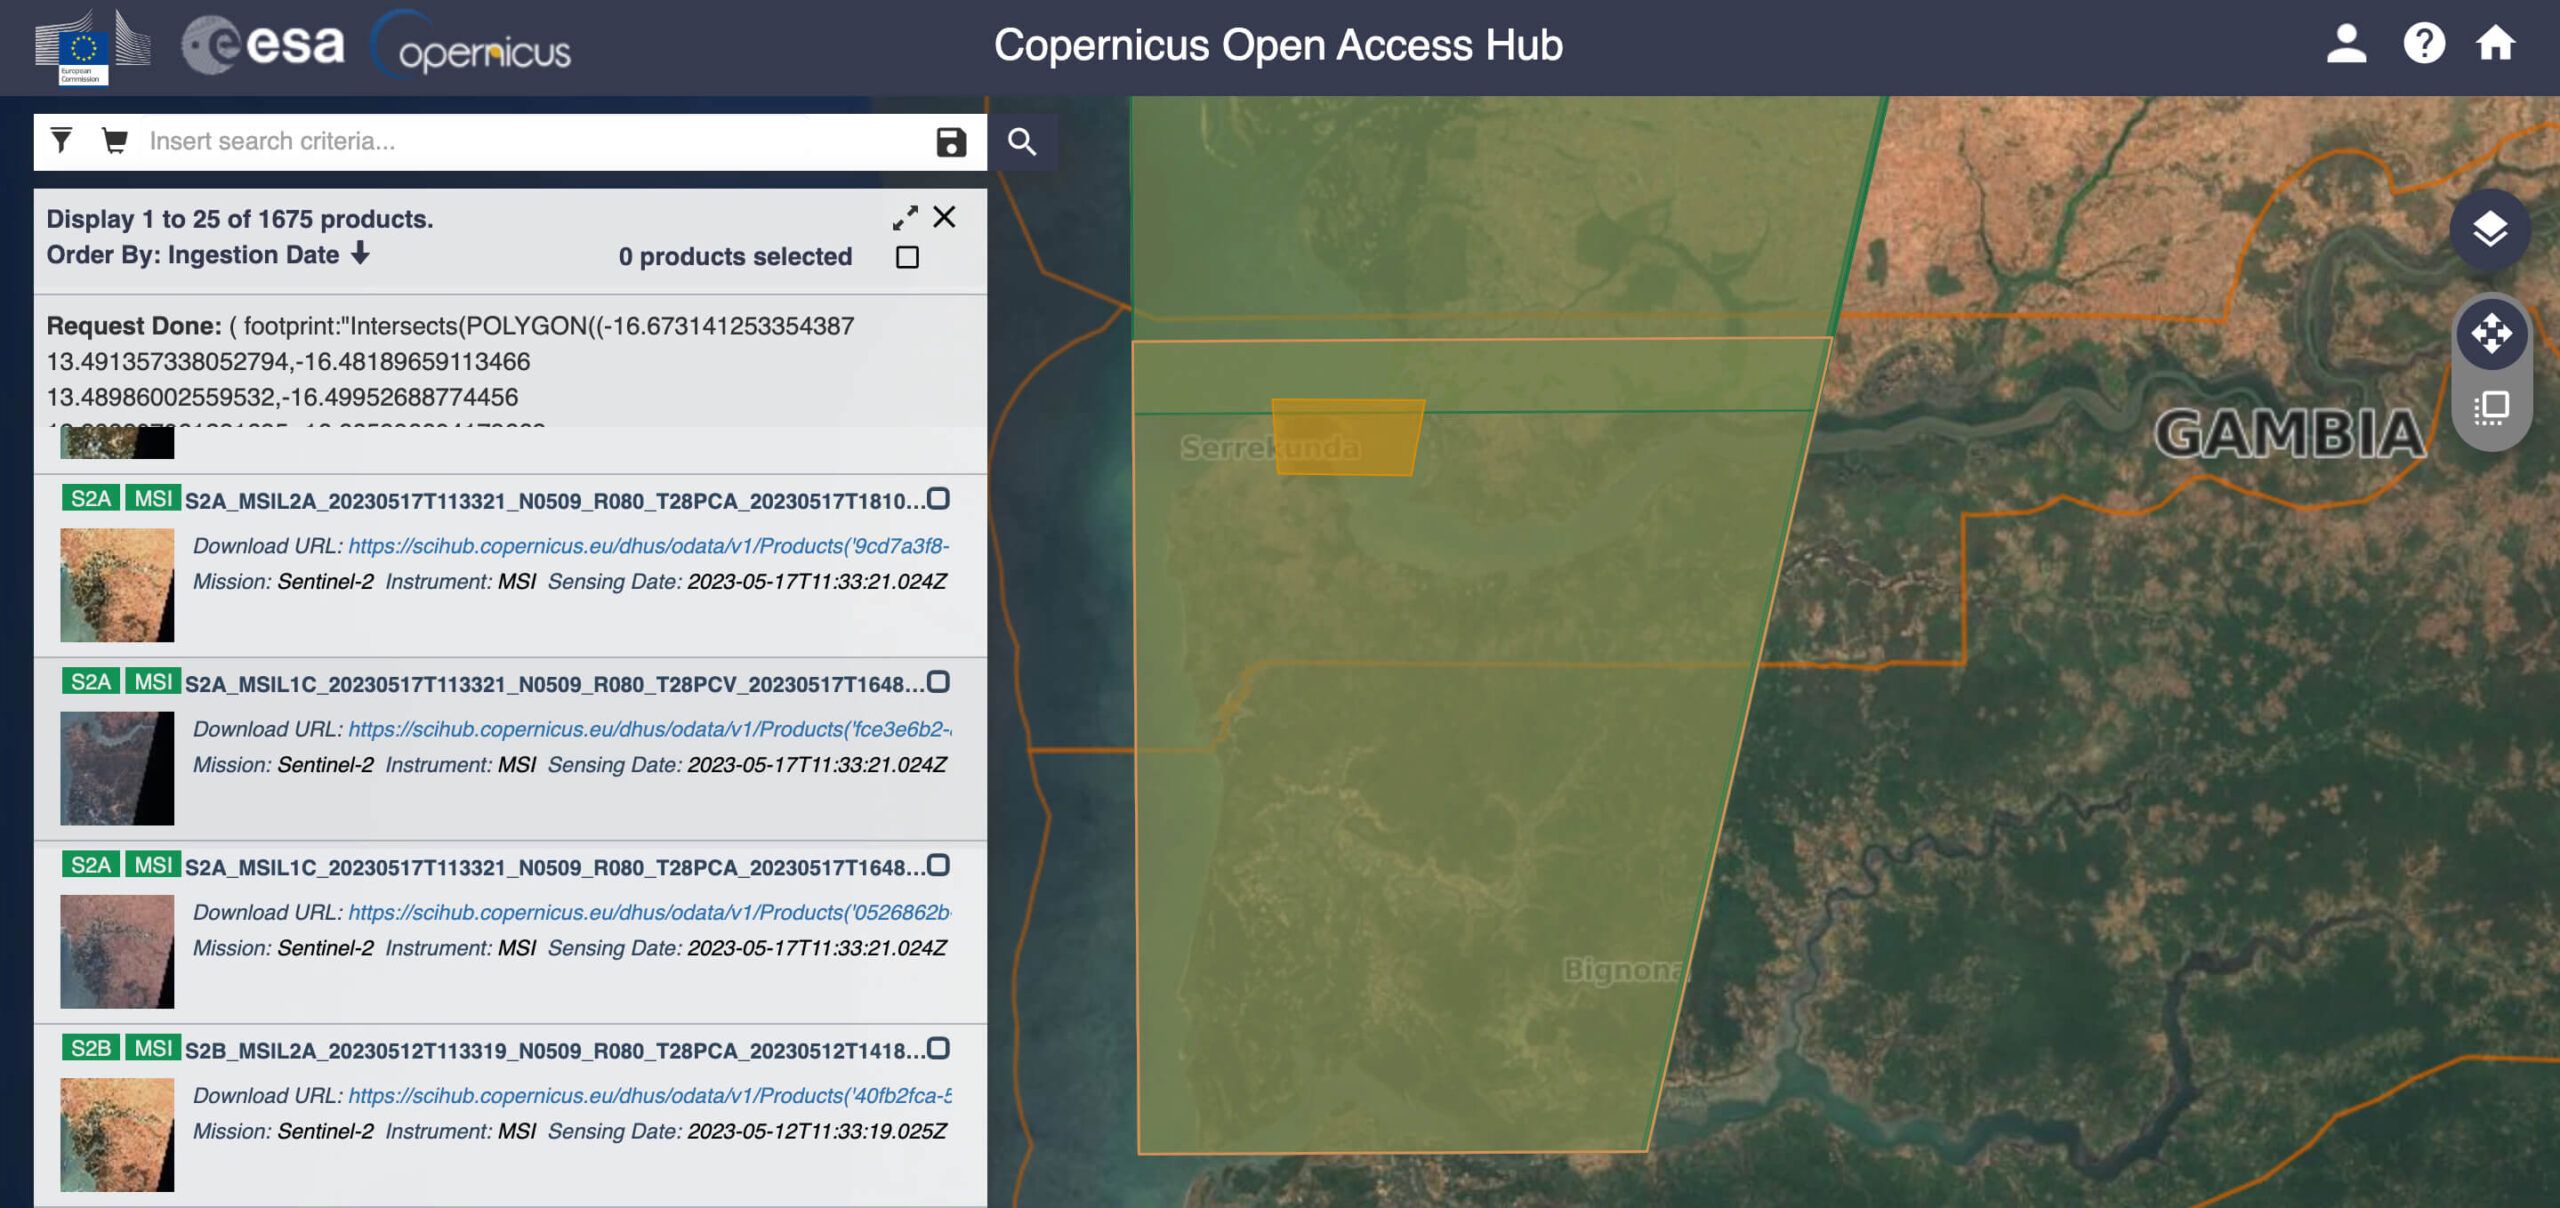
Imagery. Currently, the provider brings to users free satellite imagery from all active Sentinels for the access to their radar data, optical multispectral data, land products data for environmental monitoring, and atmosphere and air quality data.
Search. Since the Copernicus Hub’s interface gives way to the Copernicus Browser, it is now simpler for non-specialists to locate free online satellite maps from this provider. Users can begin by selecting a group of desired satellite missions and then further narrow their choices with the available filters. An AOI can be created from a user-selected bounding box or polygon or imported from a file containing vector geometry. However, not all of the Copernicus Browser’s capabilities and satellite datasets are now accessible.
Download. In the Browser, it is possible to download free satellite images in a few different ways. One of them allows you to save the particular visualization or user-created layers for free.
Analysis. The Browser provides a free visual representation of the search results. It also has several features to facilitate spatial analysis. Some examples are pinning specific locations, measuring distances between two points on the map, and comparing two photos.
The Copernicus Data Space Ecosystem can be recommended as a provider of all the Sentinels’ free satellite imagery. In the meantime, though, you should be ready to play the part of a tester for this service provider while the new ecosystem is still in its infancy.
Sentinel Hub: High-Quality Satellite Images From Multiple Sources
This hub can be regarded as a provider of free access to extensive open-source satellite imagery data via its two services: EO Browser and Sentinel Playground.
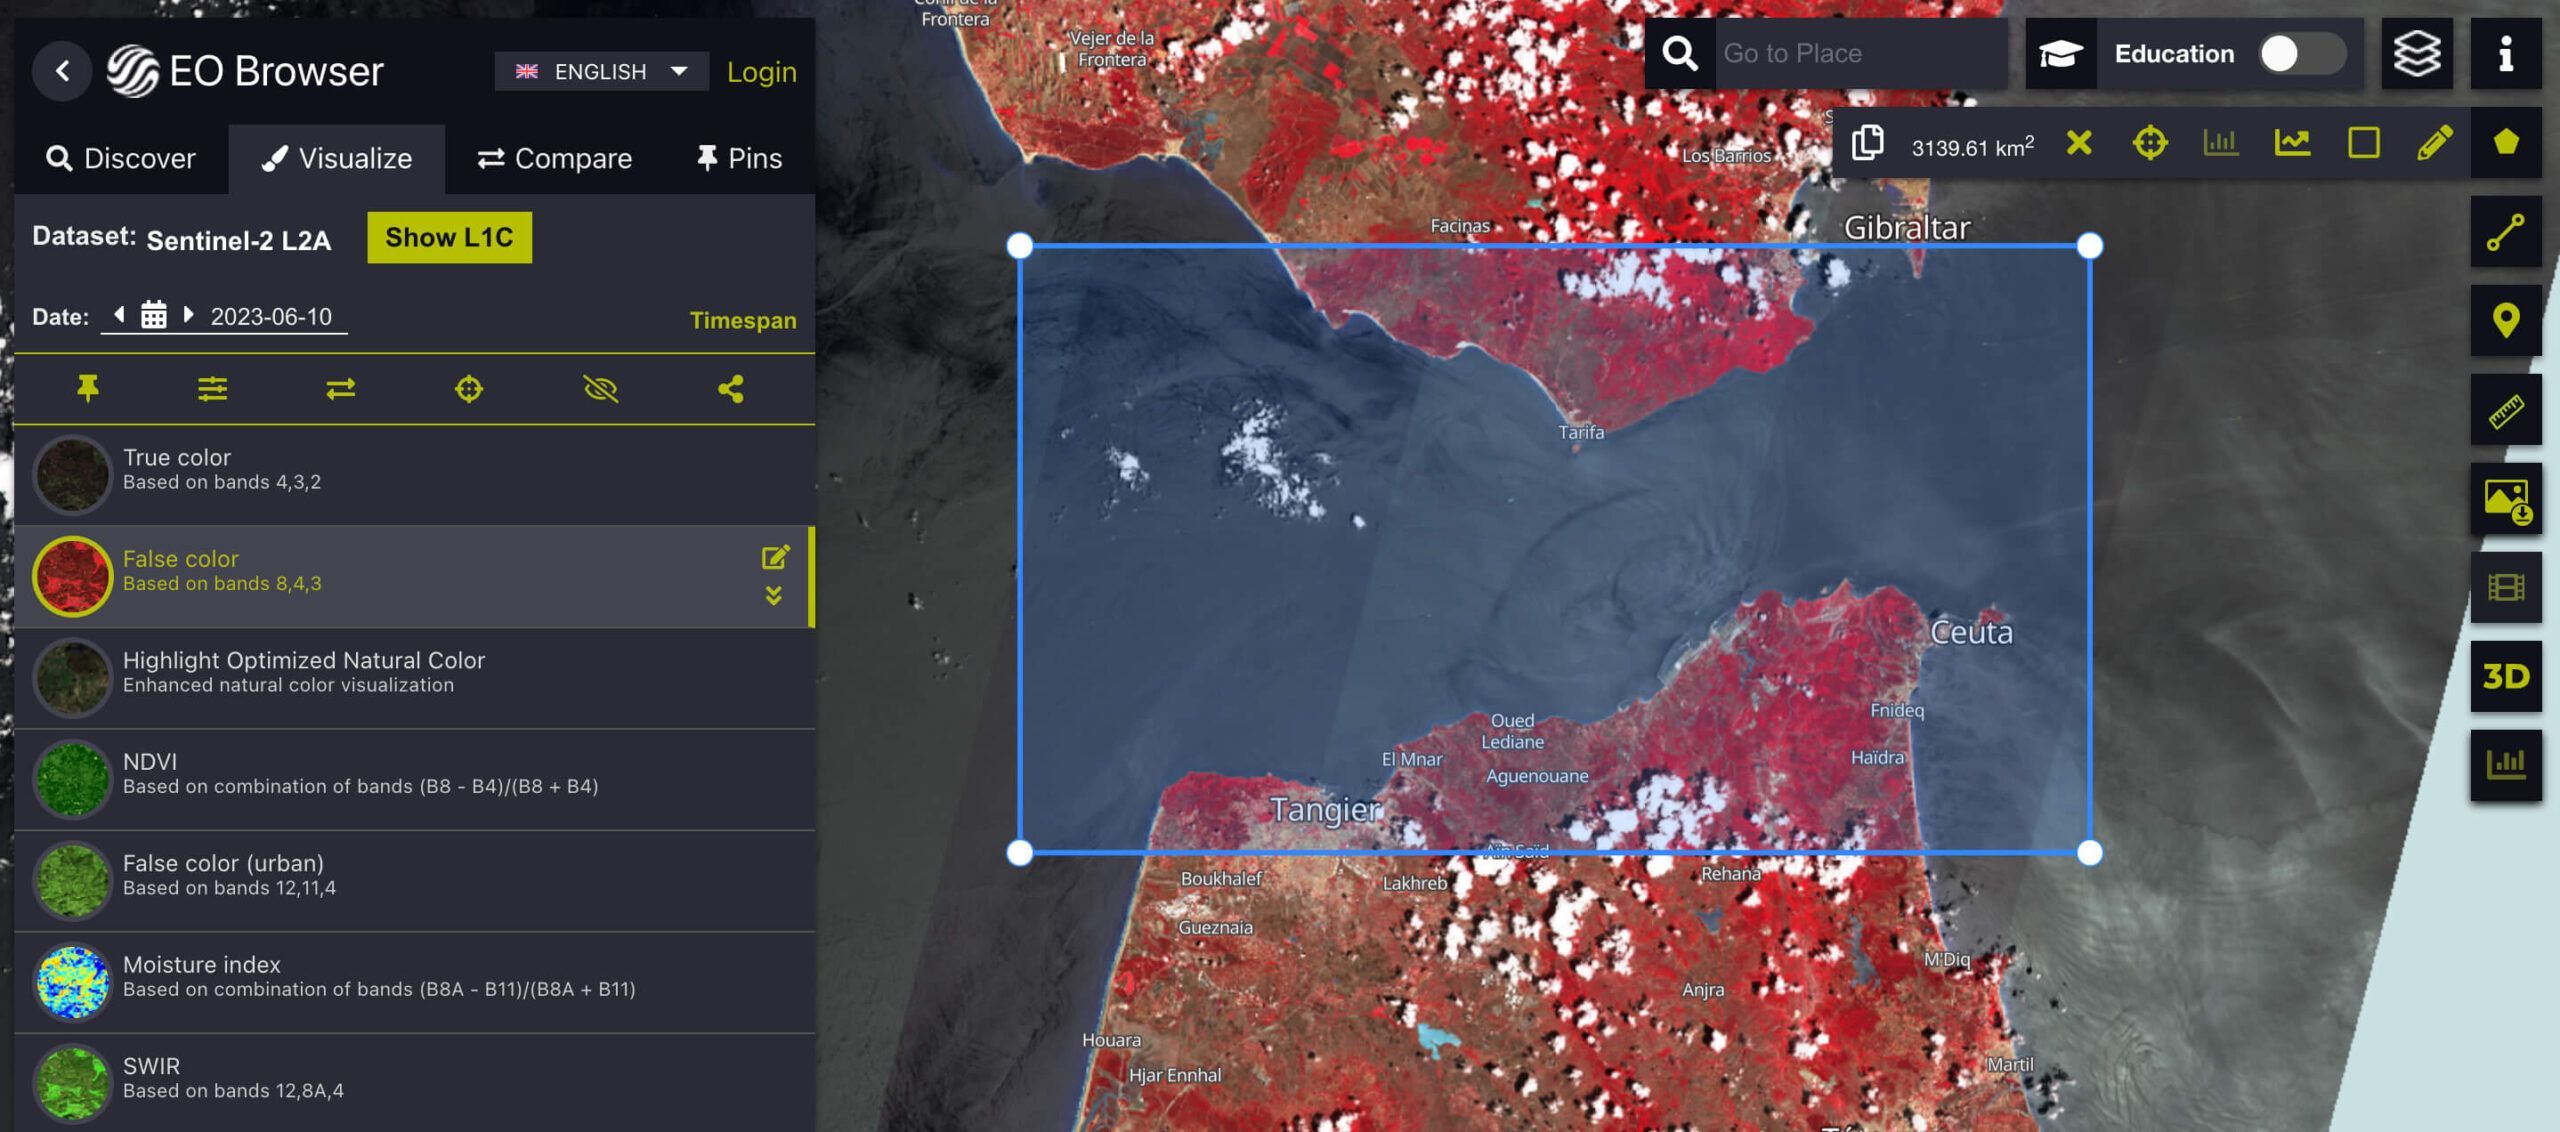
Imagery. EO Browser holds around a dozen medium- and low-resolution free satellite imagery sets, including complete archives of all the MODIS satellite imagery data, Sentinel missions, Landsat 5-8, Envisat Meris, Proba-V, and GIBS products. Sentinel Playground, in turn, contains a satellite imagery mosaic of the globe derived from Sentinel-2, Landsat 8, MODIS, or DEM.
Search. Both provider’s services have an intuitive interface and convenient search options. EO Browser offers for free all the basic search filters to ease satellite map discovery. The only caveat is that some datasets are only rendered at a certain scale; for example, a Landsat image won’t start showing until a 20-km zoom.
Download. With Sentinel Playground, you can obtain parts of the mosaic (JPEG); EO Browser enables the downloading of full-resolution photos in various formats (JPEG, KMZ, GeoTIFF) or separate bands and band combinations.
Analysis. EO Browser has tools for free satellite imagery visualization and analysis. For instance, you can select one of several band combinations and indexes, as well as create your own. It can also generate the time series, but compared to other providers’ services (e.g., EOSDA LandViewer), it won’t let you visualize all the data used.
EO Browser is an easy-to-master web service with a decent selection of free medium-resolution satellite imagery. One of its advantages is the ability to analyze and visualize data. Sentinel Playground is more of a free service for having fun exploring and sharing fragments of the satellite imagery mosaic of the world.
NOAA Data Access Viewer: Free Satellite Imagery Of The Coastal U.S.
The free software provider belongs to the NOAA Office for Coastal Management and gives access to satellite imagery of the coastal regions of the contiguous United States, Alaska, Hawaii, and the territories.
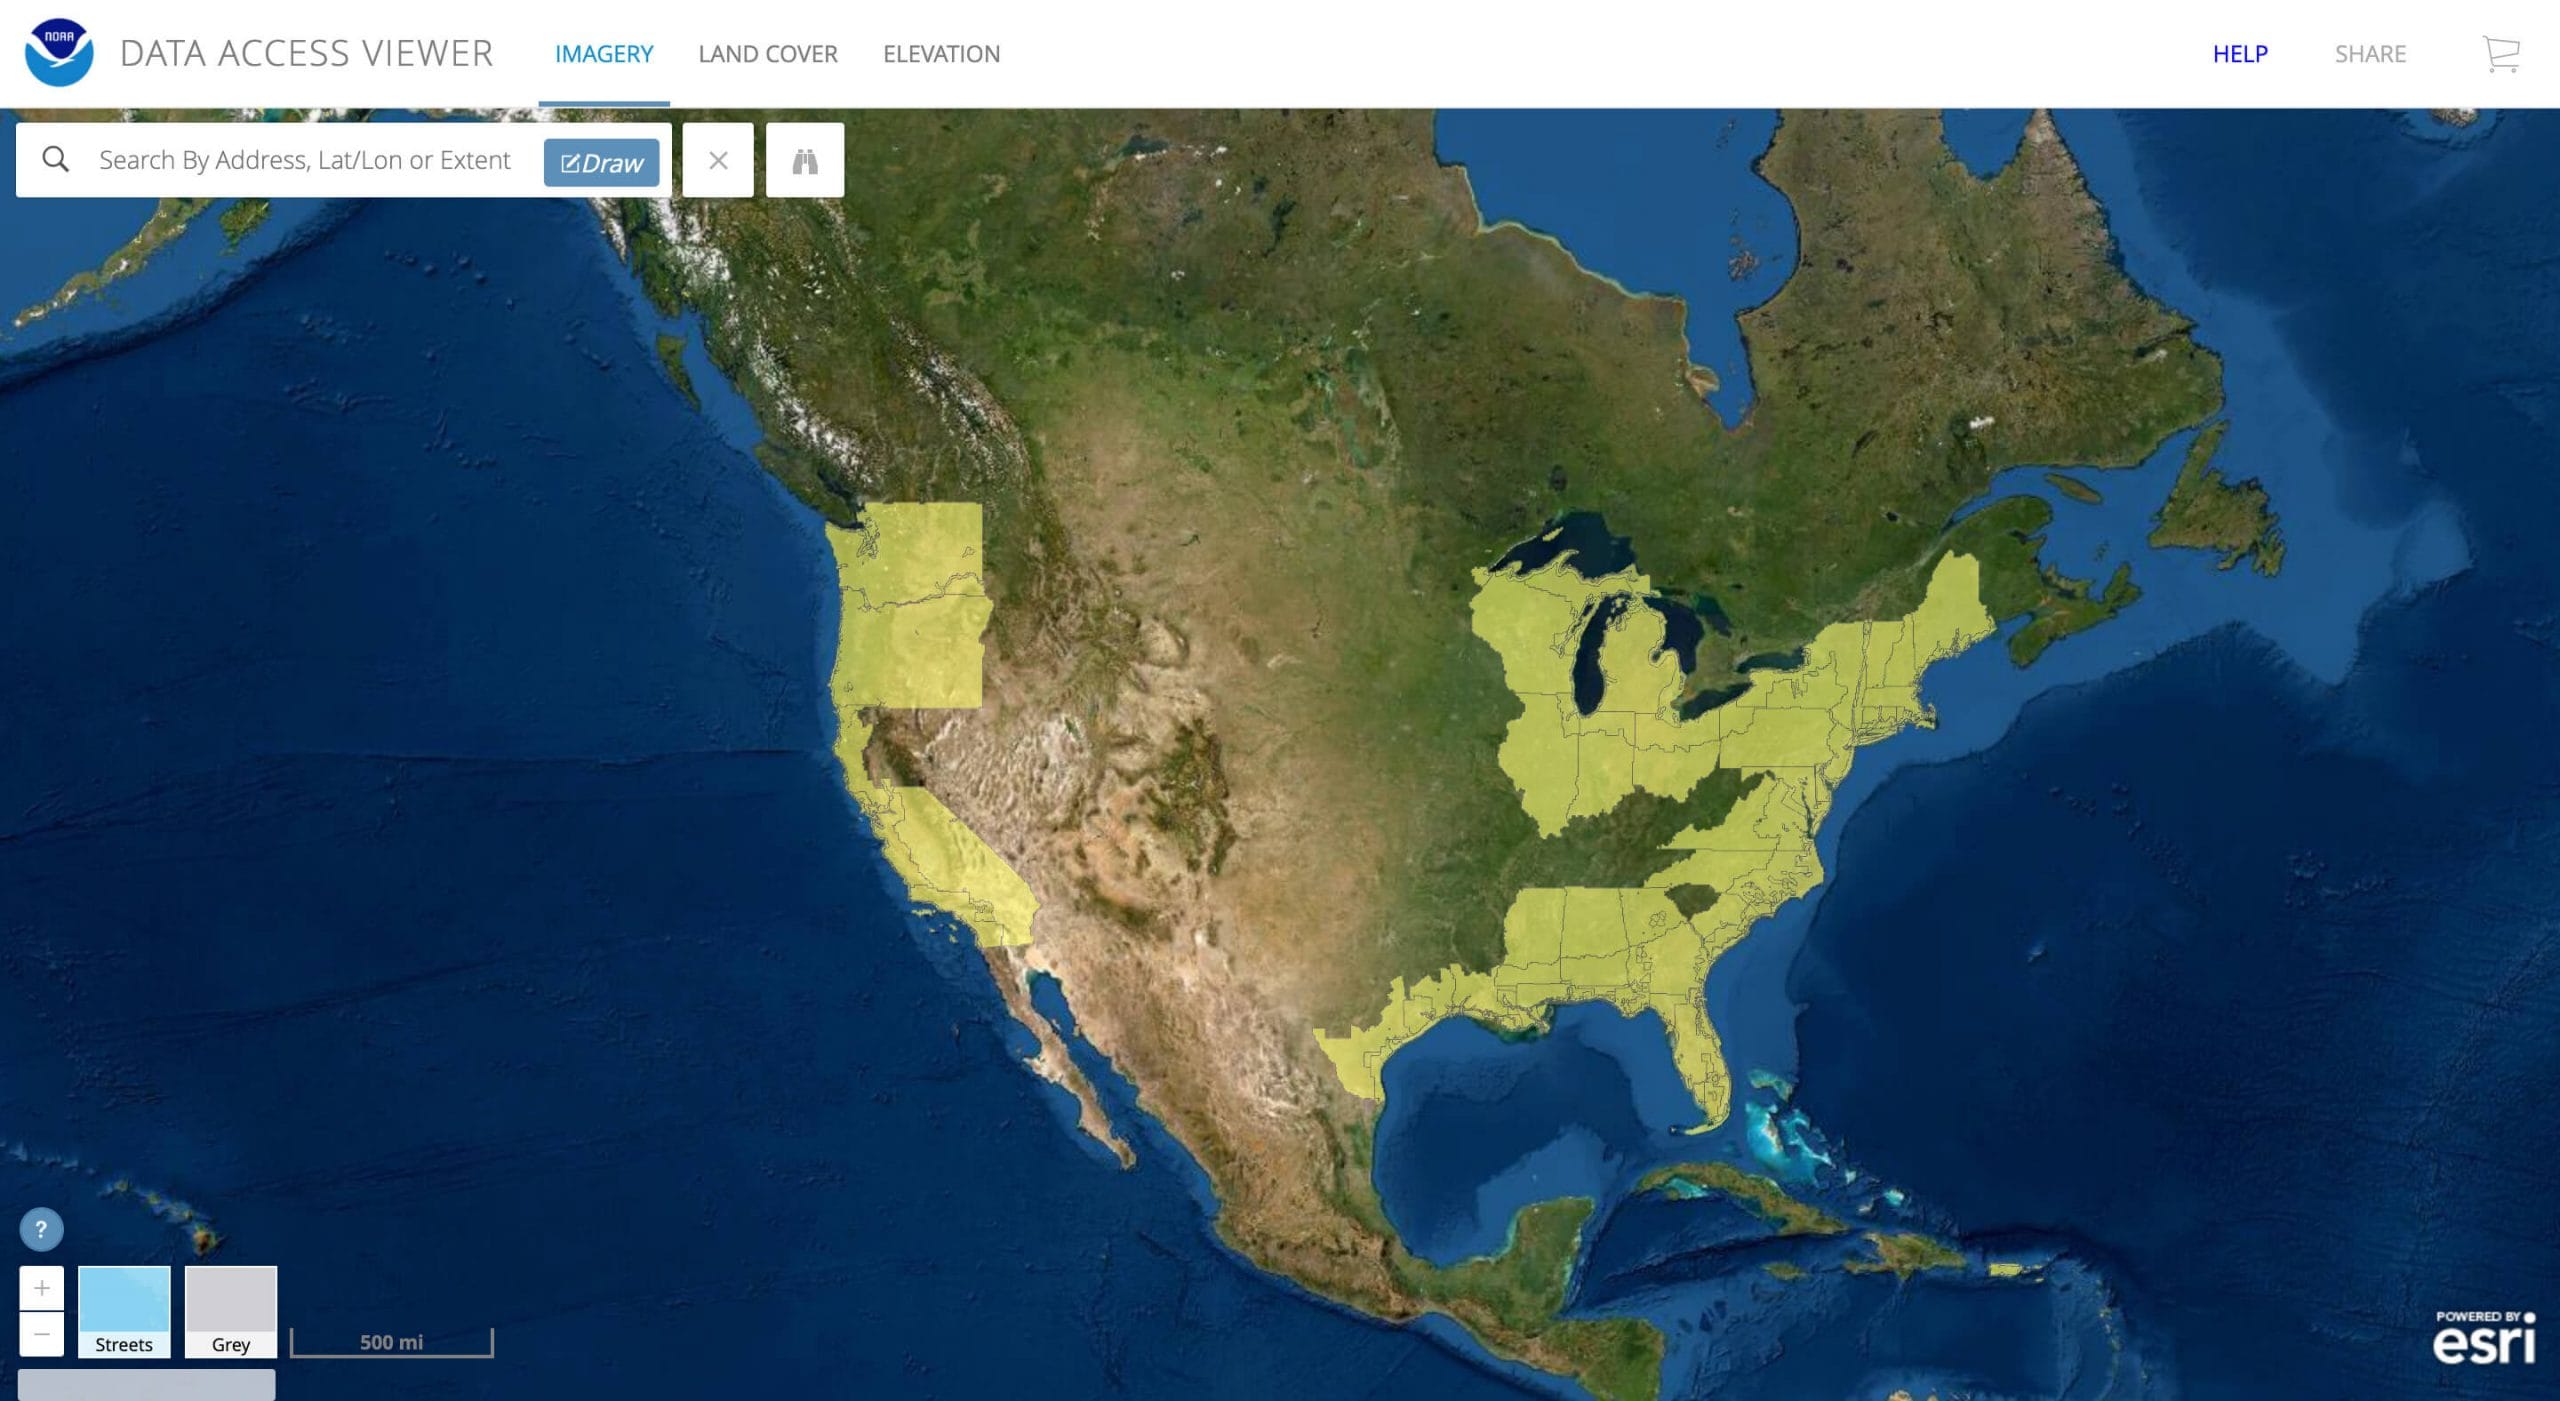
Imagery. Free of charge, the user can choose between three satellite data types: imagery, land cover, and elevation/lidar. The data is sorted out by provider, year (ascending or descending), and dataset name. Free imagery is available in infrared and natural color.
Search. The search options for free satellite maps include entering an address, longitude/latitude coordinates, or extent.
Download. To download photos from this provider, you need to add them to the cart, get a link, and select the required file format. The free bulk imagery download is also available.
Analysis. Customized satellite data is provided upon request and shared with an email link. Standard data can be accessed through the link in the Viewer.
NOAA CLASS: Free Satellite Images Of Earth Environment
CLASS is the acronym for the Comprehensive Large Array-data Stewardship System by NOAA. This is a free electronic library containing satellite data on our planet’s environment.
Imagery. Some free datasets of the provider are derived from POES and GOES (Polar-orbiting Operational Environmental Satellite and Geostationary Operational Environmental Satellite, correspondingly). Other popular satellite systems made available by the provider include the Global Navigation Satellite System, the Defense Meteorological Satellite Program, Radarsat, and some others. Users are free to select resolutions (e.g., 1 m or 4 m).
Search. To search for free satellite imagery, you need to register on the provider’s site and customize your preferences. The options comprise searching by data product, dataset name, or UUID. The scope of observations embraces real-time data on weather, oceans, fisheries, and climate (the so-called image of the day).
Download is available for free by pressing the download button and saving the picture under the condition of crediting the provider, NOAA.
Analysis. For data extraction, users are free to choose the output format, bands, channel number, resolution, map overlay, and bit/pixels. Order status can be tracked in the navigation panel and with email notifications from the provider.
Earth On AWS: A Huge Registry Of Free Satellite Imagery Data Sources And Use Cases
The registry of AWS resources enables users to view or share available datasets from various providers as well as apply them in various fields of interest. Most datasets are maintained and provided by third-party providers.
Imagery. Free spatial collections originate from different types of satellites (Sentinel-2, Landsat-8, NEXRAD, GOES-16 and 17, CBERS on AWS, and many others). The platform highlights usage examples referring to agriculture, disaster response, geospatial technology, and more.
Search. In the registry of providers, for certain tags, you can find as many as 80 free satellite imagery datasets in various formats. For example, Sentinel-2 products include multispectral mosaic data (GeoPackage or MapCache SQLite files) or GeoTIFFs (RGB or RGB/NIR).
Download. If you want to download free satellite imagery from one of the service providers on the list, go to the specific product. In the case of Sentinel-2 cloudless, select the area and get a picture in a new window, which you can save on your PC or send to a mobile device.
Analysis. The tool includes multiple applications and use cases. Besides, you are free to add your own layers to the maps, tailoring them to your needs.
Zoom Earth: Instant Sharing Of Satellite Imagery Free Of Charge
With the help of this service provider, users can check the current situation regarding weather, storms, and wildfires or date back to 2000 or later (depending on the location), setting the year, month, date, and time.
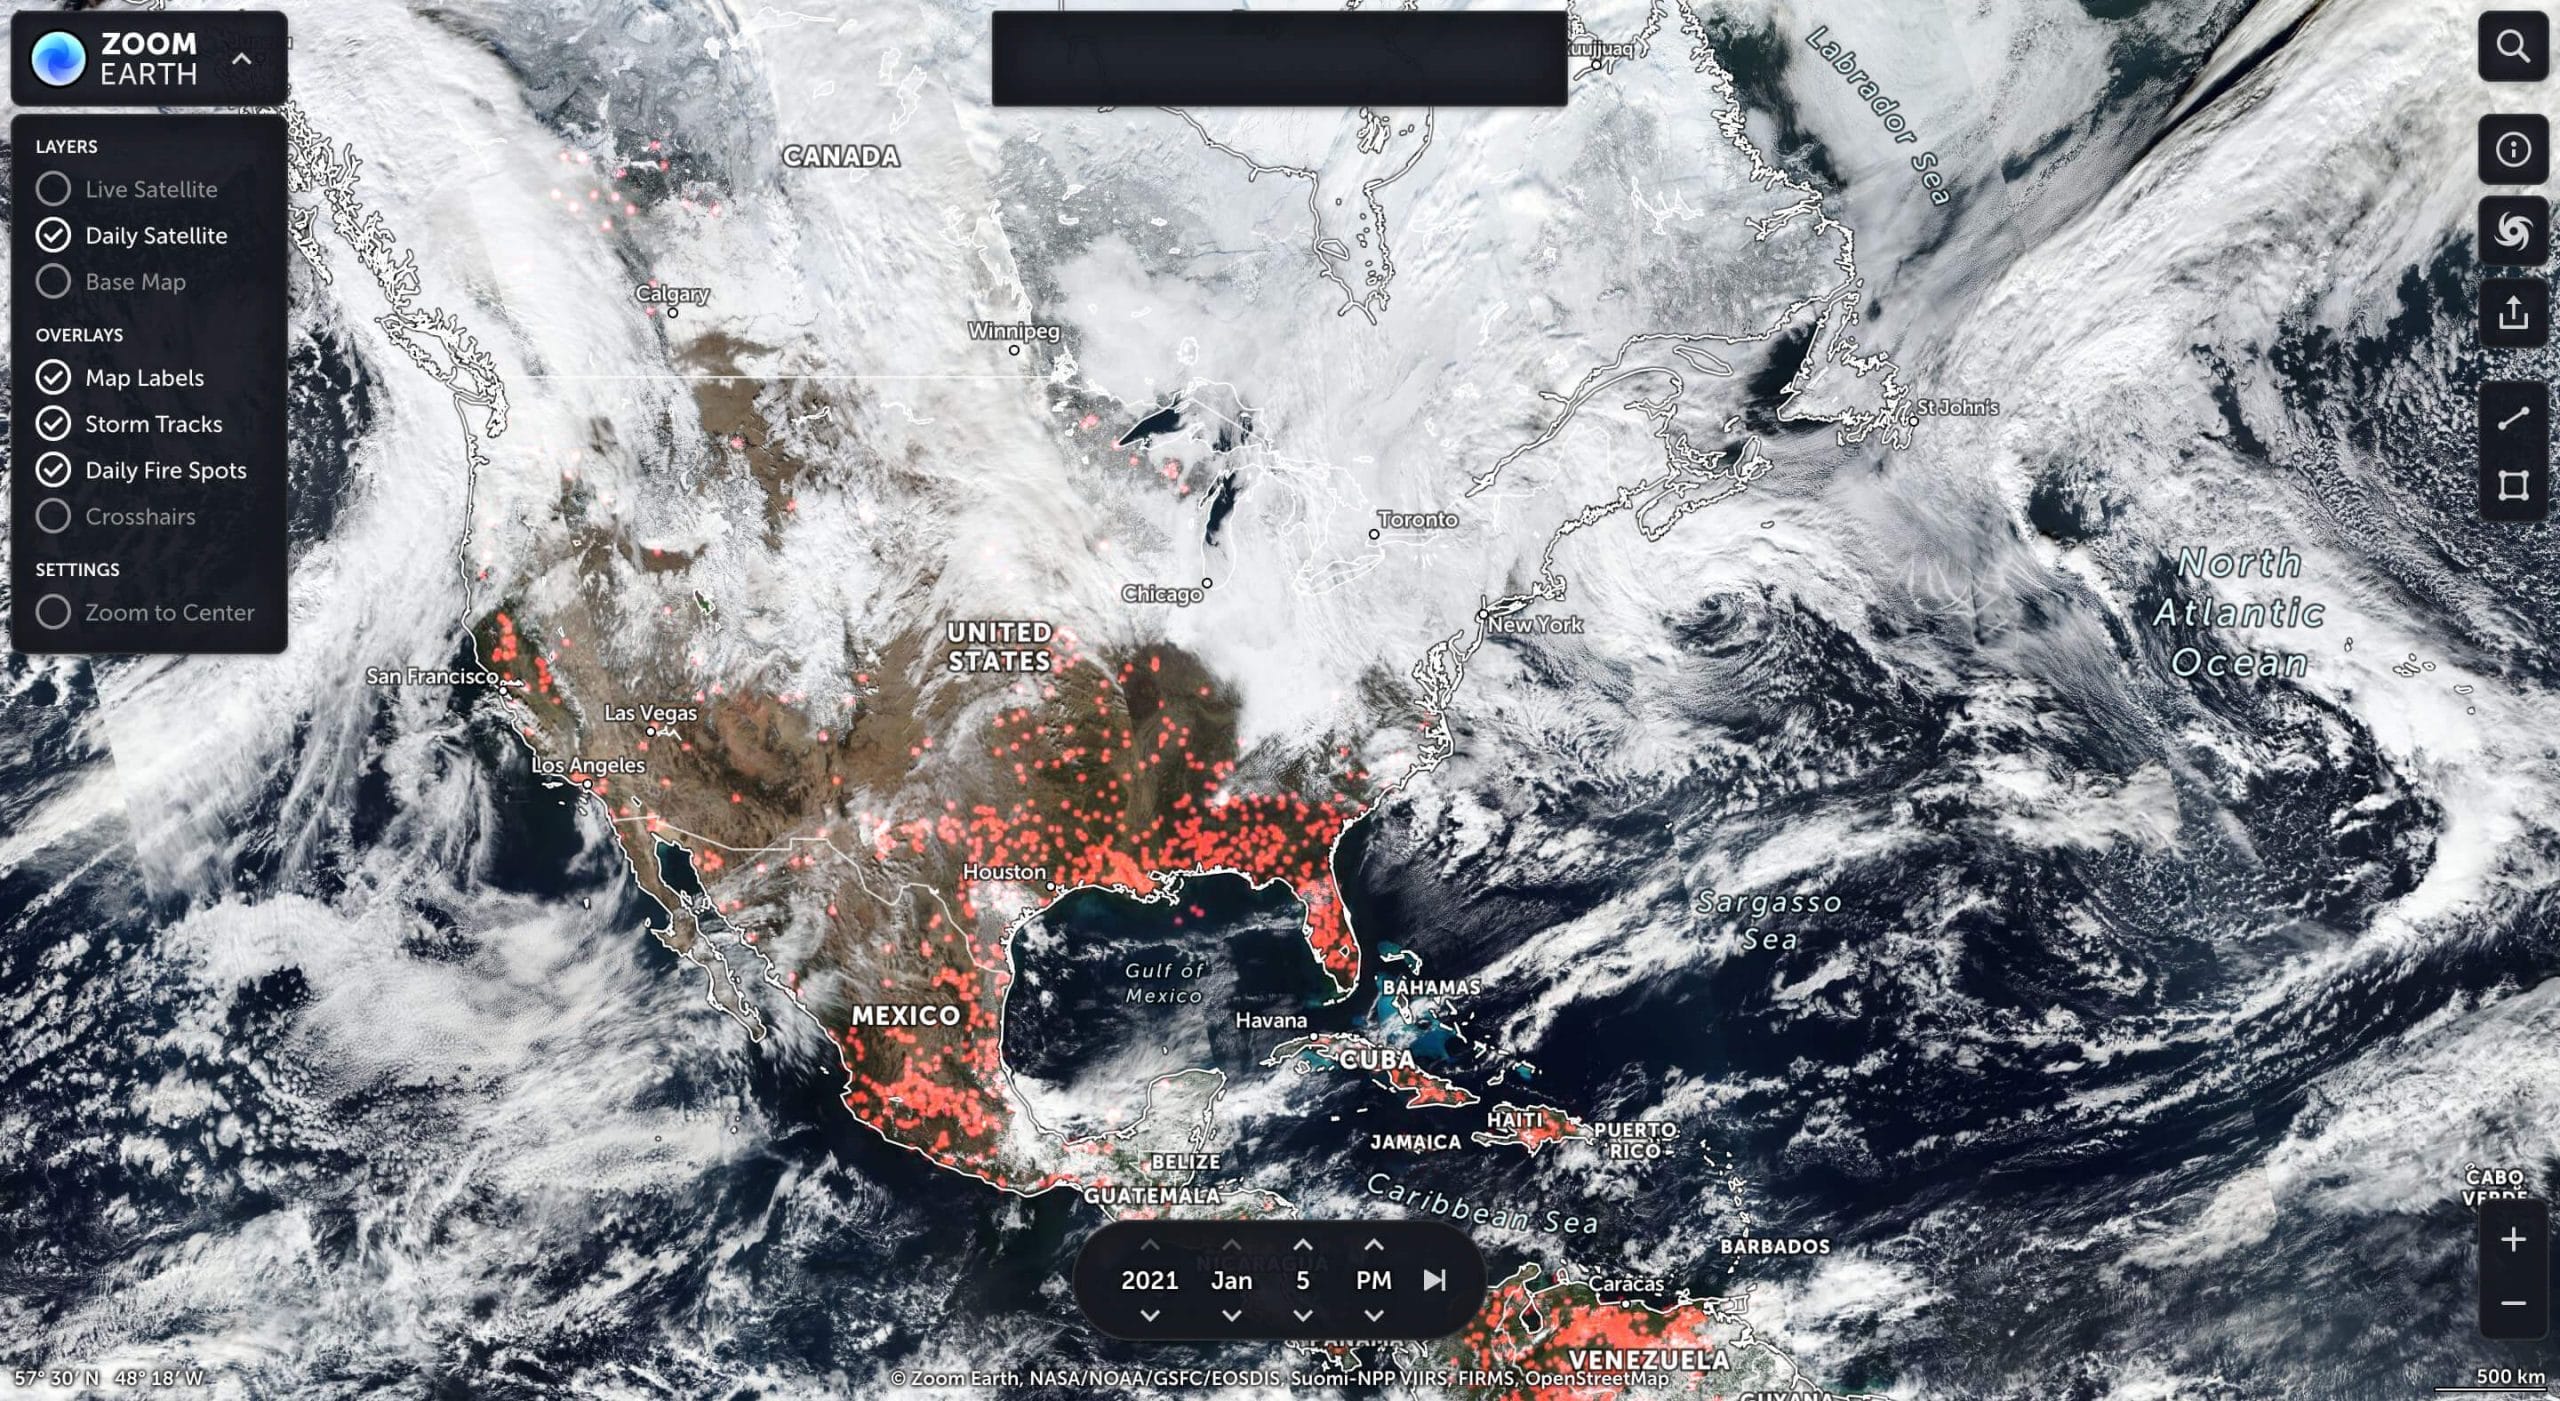
Imagery. Zoom Earth shows the newest free satellite imagery, which is updated every 10–15 minutes.
Search. Free satellite maps come from NOAA GOES, JMA Himawari-8, EUMETSAT Meteosat, GIBS, Suomi-NPP, MODIS Aqua, and Terra. Historical archives of the provider are credited to Bing and Esri. To search for a location, you just need to enter it in the field.
Download. There is no possibility of downloading free satellite imagery, but the provider allows free sharing of data on social media sites like Facebook, WhatsApp, Telegram, Twitter, or via email.
Analysis. The provider offers no specific features for imagery analysis apart from sorting out map labels, live and daily satellites, daily fire spots, or storm tracks. There is an option to measure area and distance on the map and zoom to the center, as well as to pass to your location, all for free.
Maxar Open Data Program: Satellite Imagery Catalog For Rescue In Action
The product is designated to help rescue missions manage disasters and respond to emergencies. It is a reputable provider of free information on natural calamities like hurricanes, typhoons, wildfires, floods, explosions, and earthquakes, with brief descriptions and photos.
Imagery. Maxar satellites provide high-resolution online satellite imagery free of charge.
Search. Using the provider’s interface, you can search for disaster events by their name and date, from the most recent back to 2010. Earlier data is available in the archive. By clicking “Learn more”, you will get a list of available free satellite imagery sorted by their IDs and dates.
Download. You can save imagery to your computer for free with a preview as TIFF files.
Analysis. The provider does not offer any in-app analytical tools.
NASA Worldview: About 900 Online Hi-Res Satellite Images For Keen Studying
The app from NASA’s EOSDIS allows interactive browsing of full-resolution satellite imagery available globally in near real-time (after three hours of retrieval). With this provider, you can access free up-to-date information on disaster management (fires, floods) and air quality. Browsing is available on a PC, tablet, or smartphone.
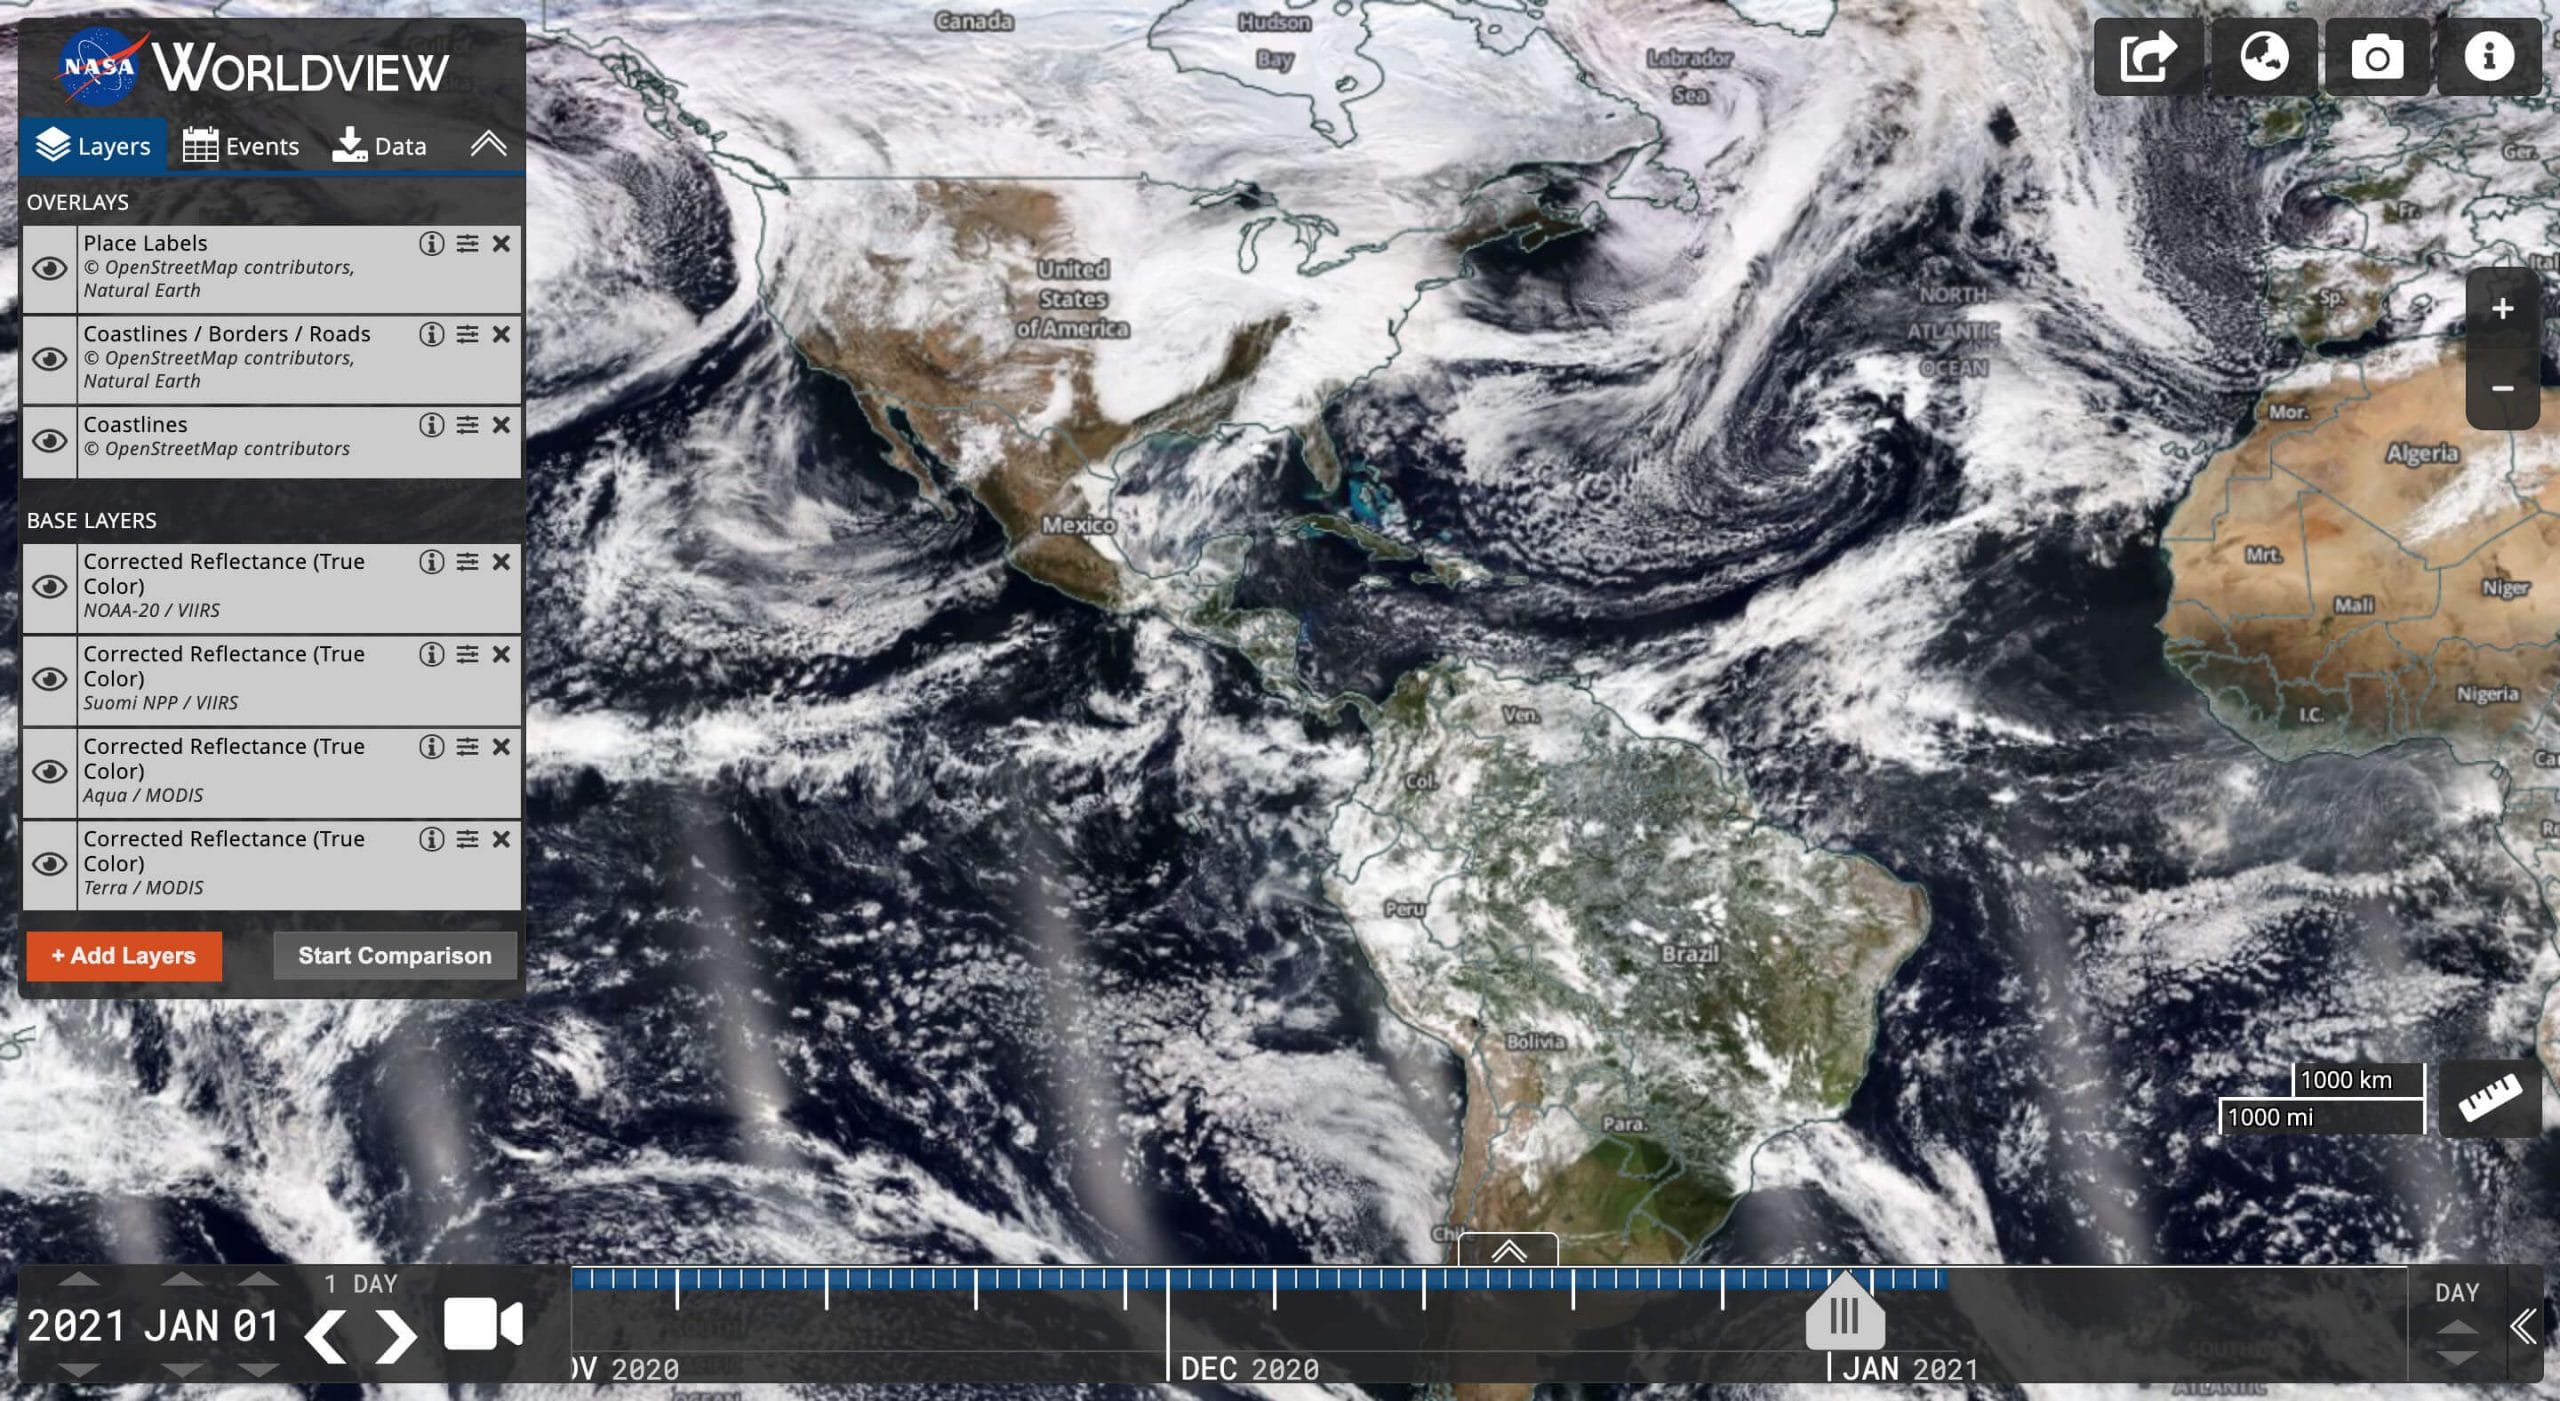
Imagery. The satellite imagery provider offers free high-resolution data from MODIS, NASA’s LANCE, EOSDIS DAACs, NOAA, etc.
Search. Searching by events and dates is possible by clicking or swiping the timescale. Most of the photos are available in standard geospatial projection, including those of the Arctic and Antarctic.
Download. Users of the service provider can share a permanent link or download the required free satellite imagery via the snapshot option, selecting the preferred resolution (30 m–10 km), file format (JPEG, KMZ, GeoTiff, PNG), zipping, and clicking the download button.
Analysis. The provider gives you a plethora of overlays, base layers, and additional map layers for multiple modifications to check air quality, dust storms, droughts, floods, vegetation, ash plumes, and shipping, among others.
Detailed online tutorials on how to use and download free satellite imagery help the provider’s users navigate the tool, highlighting its multiple features.
JAXA’s ALOS World 3D: A Digital Model Of Our Planet Earth
ALOS World 3D is a free for non-commercial use digital model of our planet’s surface created by the Japan Aerospace Exploration Agency (JAXA).
Imagery. It has a 30-m horizontal resolution (hence the acronym AW3D30). The free satellite imagery provider is built on over 3 million images obtained with the PRISM tool onboard DAICHI, the Advanced Land Observing Satellite (ALOS, for short). The mission lasted from 2006 to 2011.
Search. You can zoom in and out or move the map with a mouse. The program has several release versions. The newest one is 4.0.
Download. The free satellite imagery of the provider can be loaded via the link to the dataset; registration is required. The original DSM files are displayed in the GeoTiff format, which can be further converted to SRTM HGT.
Analysis. This provider does not offer any kind of analytical tool.
VITO Vision: Download Satellite Imagery From A Wide Range Of Optical Missions
VITO is a provider of free satellite imagery on its product distribution portal, available with and without a subscription. The provider’s subscription offers advanced search features as well as the possibility of getting the required data in the future once it is available.
Imagery. It is grouped into several collections on the provider’s portal. Resolution ranges from 100 m to 1 km.
Search. In each category and subcategory, the users define their search criteria, like the region of interest, by dragging or typing the country or continent in the search field, specifying the date range, and clicking the search button. The provider gives a free demo tutorial explaining how to use the portal.
Download. Viewing free satellite imagery is allowed anonymously, while downloading requires registration and acceptance of the provider’s terms and conditions. The files can be retrieved in KML format. The search results come with a thumbnail and can be downloaded one by one or all together. For large data amounts, it is best to place an order and get an email link from the provider. For a quick download, install an FTP client.
Analysis. Some free collections offered by the provider (e.g., Proba-V 300 m) include red band and NDVI projections. File stitching and band combinations are performed upon request in customized order deliveries (for specific users).
Global Land Cover Facility: Over A Petabyte Resource To Download Satellite Images
The portal is a large repository for free satellite imagery housed and operated by the Department of Geographical Sciences at the University of Maryland, U.S. The provider can come in handy for anyone interested in global environmental systems.
Imagery. The satellite imagery provider shows the land cover and its changes on a local and global scale. It embraces forests, crops, grasses, sands, and urban constructions.
Search. You can use text-based, temporal, and/or spatial queries to search through a shopping cart.
Download. Free satellite imagery download is available from GBLF via an FTP client. On a larger scale, free, detailed satellite maps can be retrieved via the Earth Science Data Interface (ESDI). The provider’s data applications include science, environment studies, resource and disaster management, and computer science.
Analysis. A comparison of the same terrain on different dates, made available by the imagery provider, allows for the detection of the slightest changes on the Earth’s surface.
UNAVCO: Live And Historical Satellite Data For Actionable Insights
UNAVCO is a University consortium headquartered in Colorado, U.S. It is a provider of free geoscience data.
Imagery. Through this provider, satellite images are available in BINEX, RINEX, and RTCM formats.
Search. Data types are grouped as GPS/GNSS, SAR, Lidar/SfM, seismic, and tropospheric, both already downloaded and currently streaming. Each data category offered by the provider has a video tutorial with user guidelines. For example, free GPS satellite imagery is filtered by network and station name and temporal availability.
Download. To save your recent search results, add them to the cart and pre-install the UNAVCO downloader or some other clients for advanced data access and customization (Java, Web services, FTP, GSAC). Free satellite imagery is available upon email request to the provider.
As for SAR data, the Seamless SAR Archive is recommended. Via it, users can select the orbit, swath, and satellite name. Access to SAR results downloading is granted to affiliates of SAR-research establishments.
Analysis. The provider additionally offers software to process the acquired free data (GPS/GNSS, SAR, and TLS).
Bhuvan Indian Geo-Platform Of ISRO-NRSC: India’s Contribution To Remote Sensing
Bhuvan is a free remote sensing data provider jointly operated by the Indian Space Research Organization and the National Remote Sensing Center.
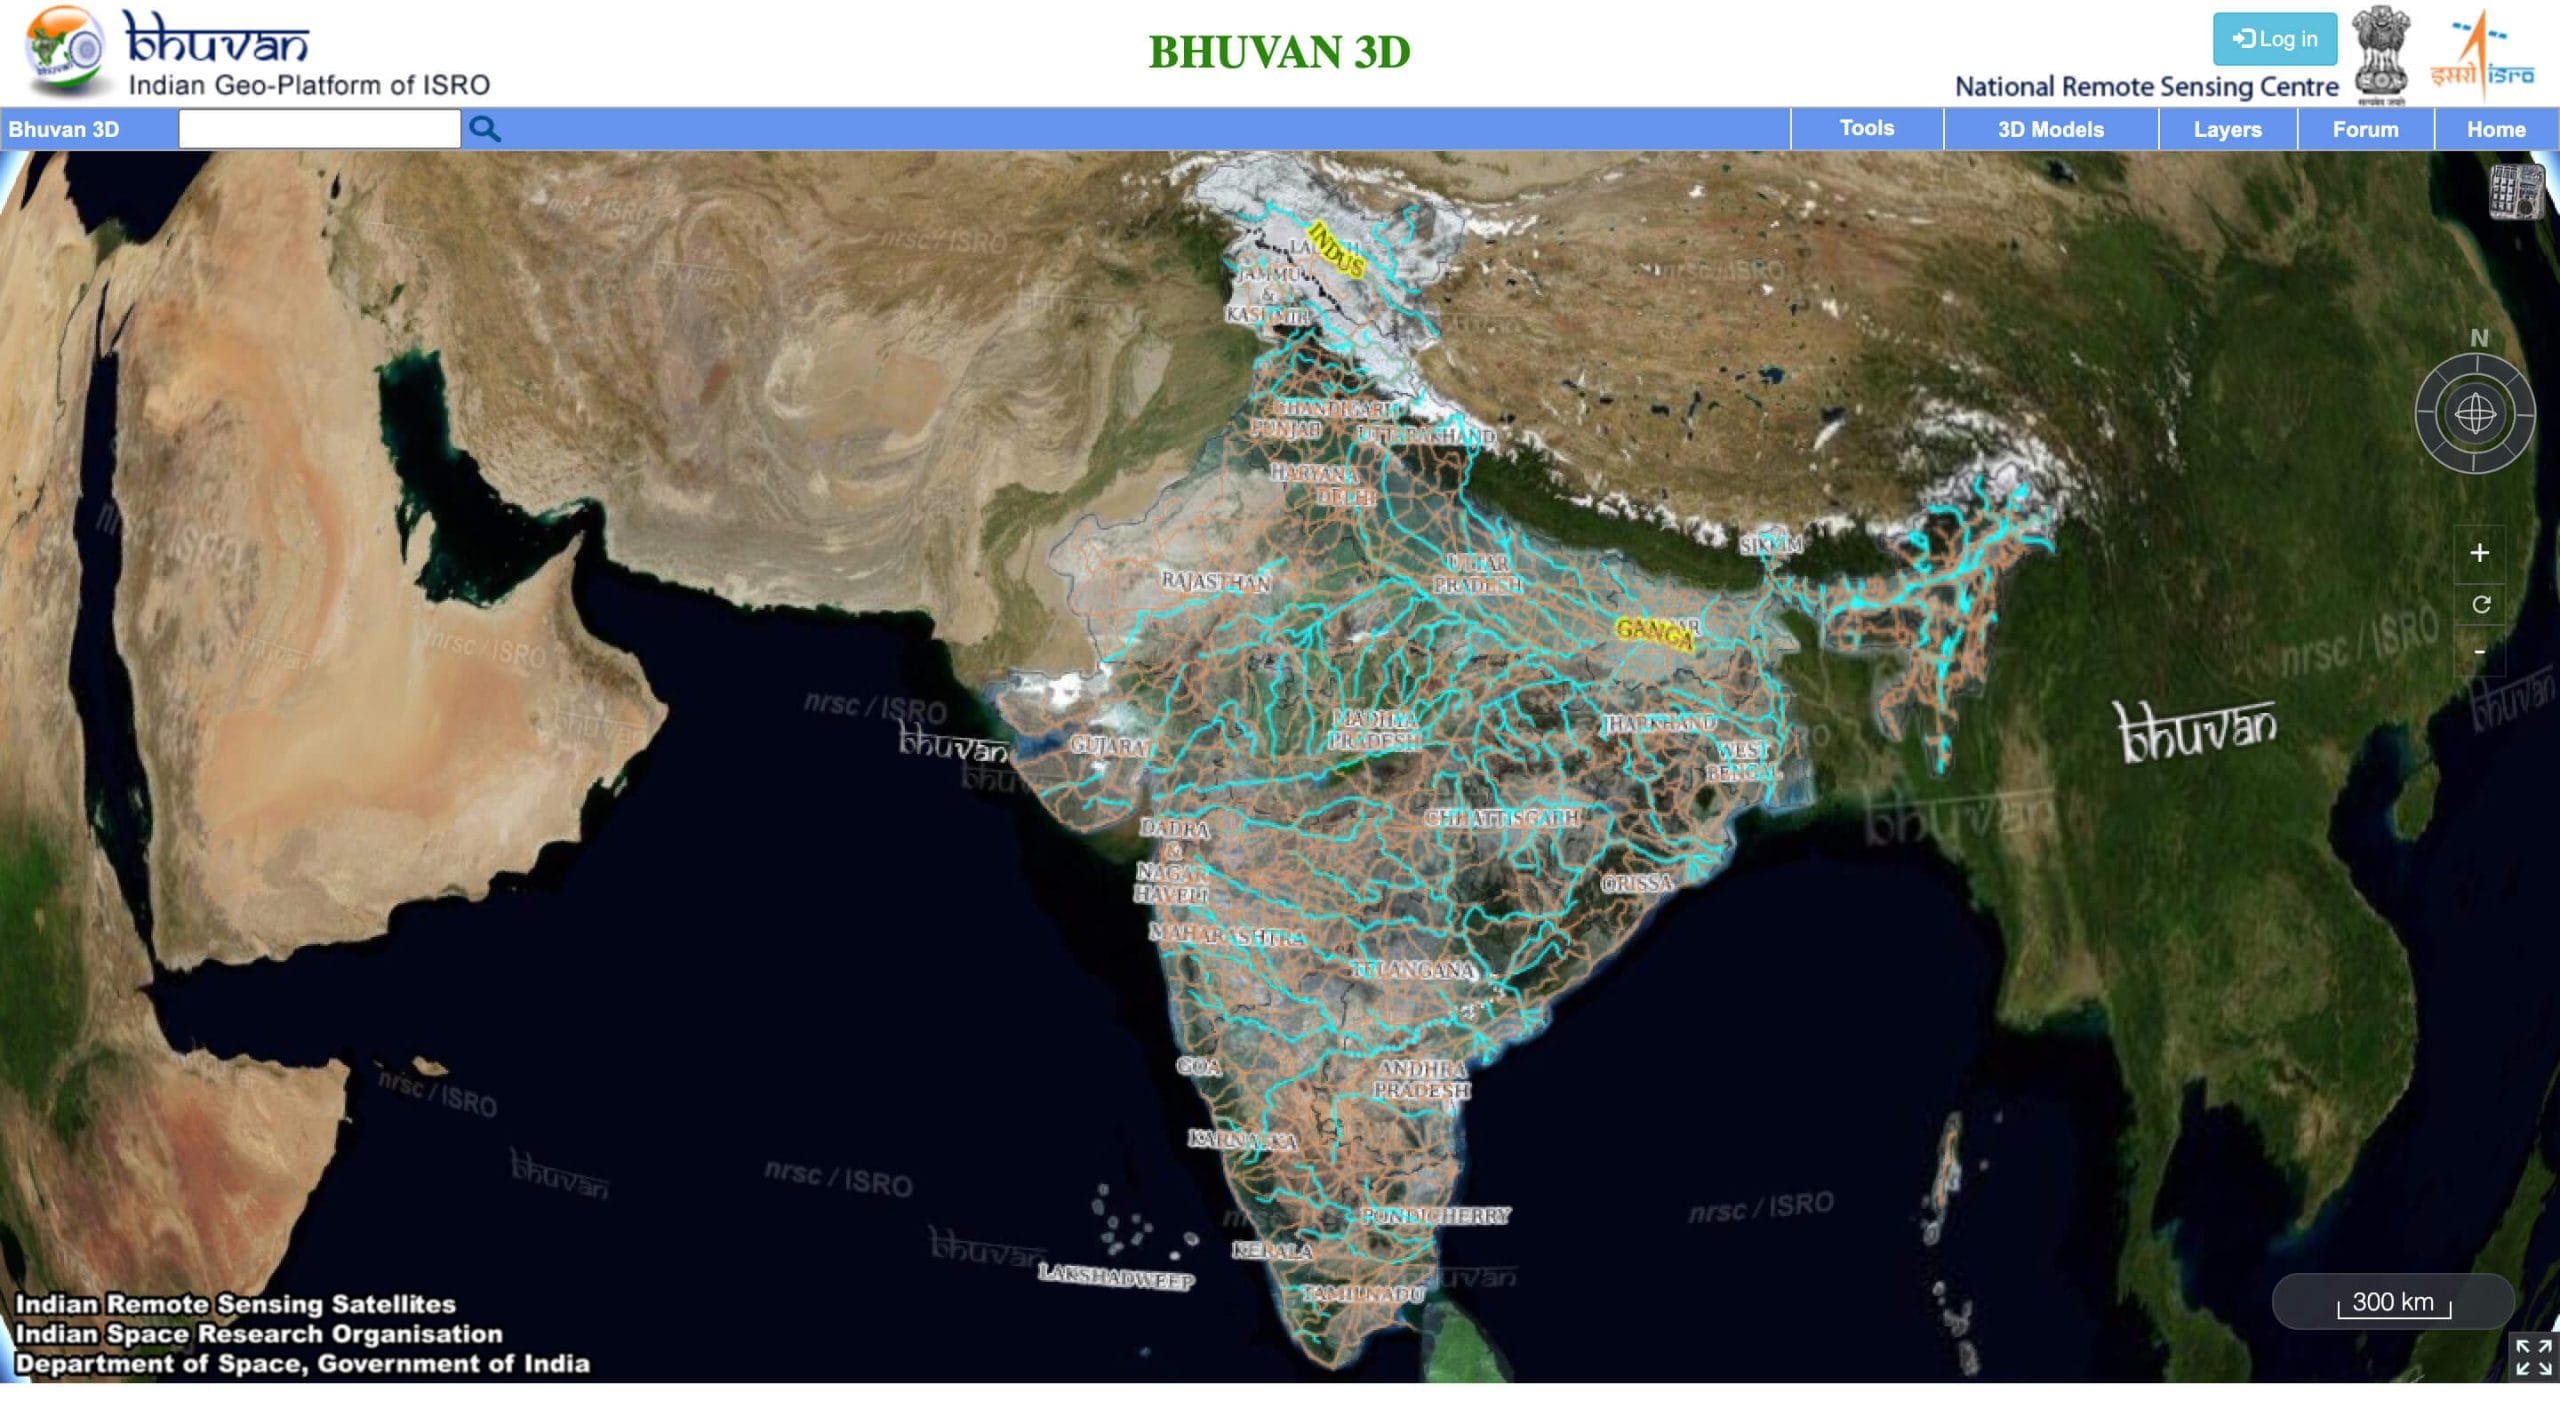
Imagery. The provider’s data is derived from Indian satellites (including IMS, Oceansat, Cartosat, and Resourcesat). It comprises free satellite imagery mainly within the scope of the Indian continent, with several features applicable for global use (e.g., NDVI global coverage).
Search. You can acquire free satellite maps by selecting satellites/sensors, themes/products, and programs/projects. In particular, the provider accumulates maps in the following groups: land and terrain, ocean and physical, land and vegetation (local and global NDVI or vegetation fraction).
Download. The free portal gives detailed instructions, yet the data is available for registered users only.
Analysis. Bhuvan provider offers a number of free interactive features like bounding box, mapsheet, tiles, and interactive drawing.
Tips For Making Use Of Free Satellite Imagery Platforms
To wrap things up, here are some tips for choosing and making the most of free or commercial satellite imagery providers:
- Find the platforms. To save you time, we’ve compiled the above list of major satellite imagery providers, including well-known reliable platforms, government agencies, and academic institutions. There are many other free medium- and high-resolution satellite imagery providers out there, but we suggest that you start with these GIS data services for the best experience.
- Learn about the capabilities of different platforms. Explore the features and capabilities of each provider to understand their data offerings, resolution, temporal coverage, and supported data formats.
- Narrow your search. Determine your specific requirements for free satellite imagery, such as the Area of Interest, temporal range, spatial resolution, and spectral bands, and apply the platform’s search filters to refine your findings.
- Explore visualization and analytical tools. Ensure that the available options can give you the required level of data quality, clarity, coverage, and insight to meet your needs.
- Download selectively. Select tiles or Areas of Interest instead of downloading the entire large provider’s datasets. By filtering out irrelevant imagery, you can save time and storage space without sacrificing the information you need for your project.
Always read the provider’s resolution caps, license limitations, and terms of service to ensure that your intended use is in compliance with its acceptable parameters. Following the above guidelines will help you choose the best free satellite map and imagery providers for your needs.
About the author:
Kateryna Sergieieva has a Ph.D. in information technologies and 15 years of experience in remote sensing. She is a Senior Scientist at EOSDA responsible for developing technologies for satellite monitoring and surface feature change detection. Kateryna is an author of over 60 scientific publications.
More news

Optical satellite imagery: Getting insights from space
Ground inspections can be slow and expensive. Discover how commercial optical satellite imagery simplifies remote site monitoring and supports daily operational decisions.
Natural Disasters 2024: Extreme Weather On The Rise
Take a closer look at the 2024 natural disasters that shook the planet to reveal their causes, spread, and the massive challenges they created we all need to solve.
Historical Satellite Images: Accessing The Old Data
Decades of space-based imagery are now at your fingertips. Historical satellite images reveal the past and can guide your next move — whether you’re a farmer, eco-activist, city planner, or scientist.