Historical Satellite Images: Accessing The Old Data
Historical satellite images aren’t just records of the past — they’re tools for understanding long-term change in ways that ground data alone can’t match. The bigger picture often lies in the patterns you only notice when looking across months or years.
In this article, we look at how to access and work with old satellite imagery using EOSDA LandViewer, with a focus on practical use cases: from observing irrigation trends in Saudi Arabia to monitoring melting glaciers in Alaska. Analyzing historical satellite maps is not just about seeing what was, but finding what still matters today.
Where To Find Old Satellite Images?
Most databases for historical satellite views focus on a single mission. However, EOSDA LandViewer provides live satellite images and old ones from different collections in one place.
Historical satellite imagery on EOSDA LandViewer dates back to 1982 and is obtained from eleven sources. To get started, define your area of interest (AOI) — you can search for a location, draw it on the map, or upload your AOI file. Then, filter old imagery by date, cloud cover, sensor, and AOI coverage to quickly narrow down relevant results. Finally, select the old image that meets your needs by reviewing the available options and choosing the most suitable one for your project.
The old imagery from each source has its specifics, so the collection can fit everyone’s needs:
- location — historical images of Earth globally;
- revisiting time — from several days to two weeks;
- spatial resolution — free historical satellite imagery of low and medium with a 100 to 10 m/pixel grid and high-resolution images by request).
In addition to old satellite-derived data, EOSDA LandViewer provides historical datasets captured by another medium — aircraft. Aerial imagery covers a smaller territory but has a higher resolution. For example, you can access 1-meter detailed, free historical NAIP areal images on the platform.
How To View Old Satellite Images On EOSDA LandViewer
EOSDA LandViewer is an online service that provides access to historical satellite images, both free and commercial. Its intuitive interface allows users to select an AOI and date range, returning a list of matching old images in a jiffy.
There are several types of historical imagery on EOSDA LandViewer:
- passive (day / night / low resolution);
- active;
- terrain tiles (to build 3D images / models of an AOI);
- high-resolution images (for detailed analytics).
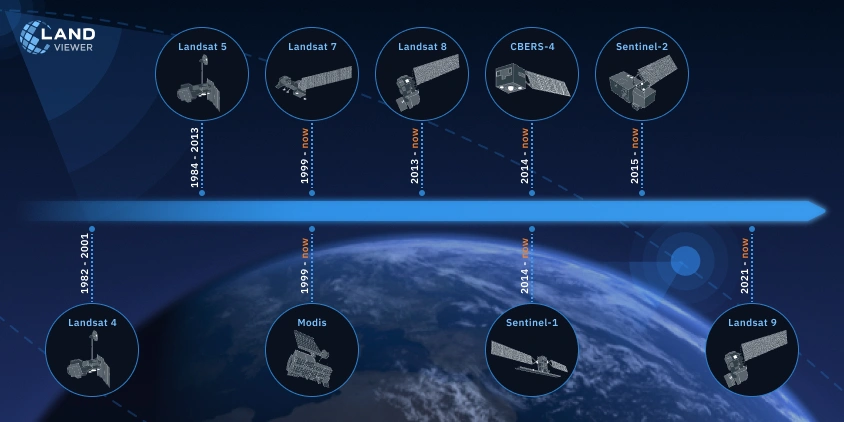
The following sensors and sources contribute to the large collection of historical satellite images on the platform:
- Sentinel-2 MSI (Multispectral Instrument);
- Landsat-8 OLI (Operational Land Imager) and TIRS (Thermal Infrared Sensor);
- Landsat-9 OLI-2 (Operational Land Imager-2) and TIRS-2 (Thermal Infrared Sensor-2);
- Landsat-7 ETM+ (Enhanced Thematic Mapper);
- Landsat 4-5 MSS (Multispectral Scanner);
- Landsat 4-5 TM (Thematic Mapper);
- CBERS-4 MUX (Multispectral Camera);
- CBERS-4 WFI (Wide-Field Imager);
- CBERS-4 PAN5 (Panchromatic and Multispectral Camera, 5-meter resolution);
- CBERS-4 PAN10 (Panchromatic and Multispectral Camera, 10-meter resolution);
- NAIP (National Agricultural Imagery Program — film and digital cameras).
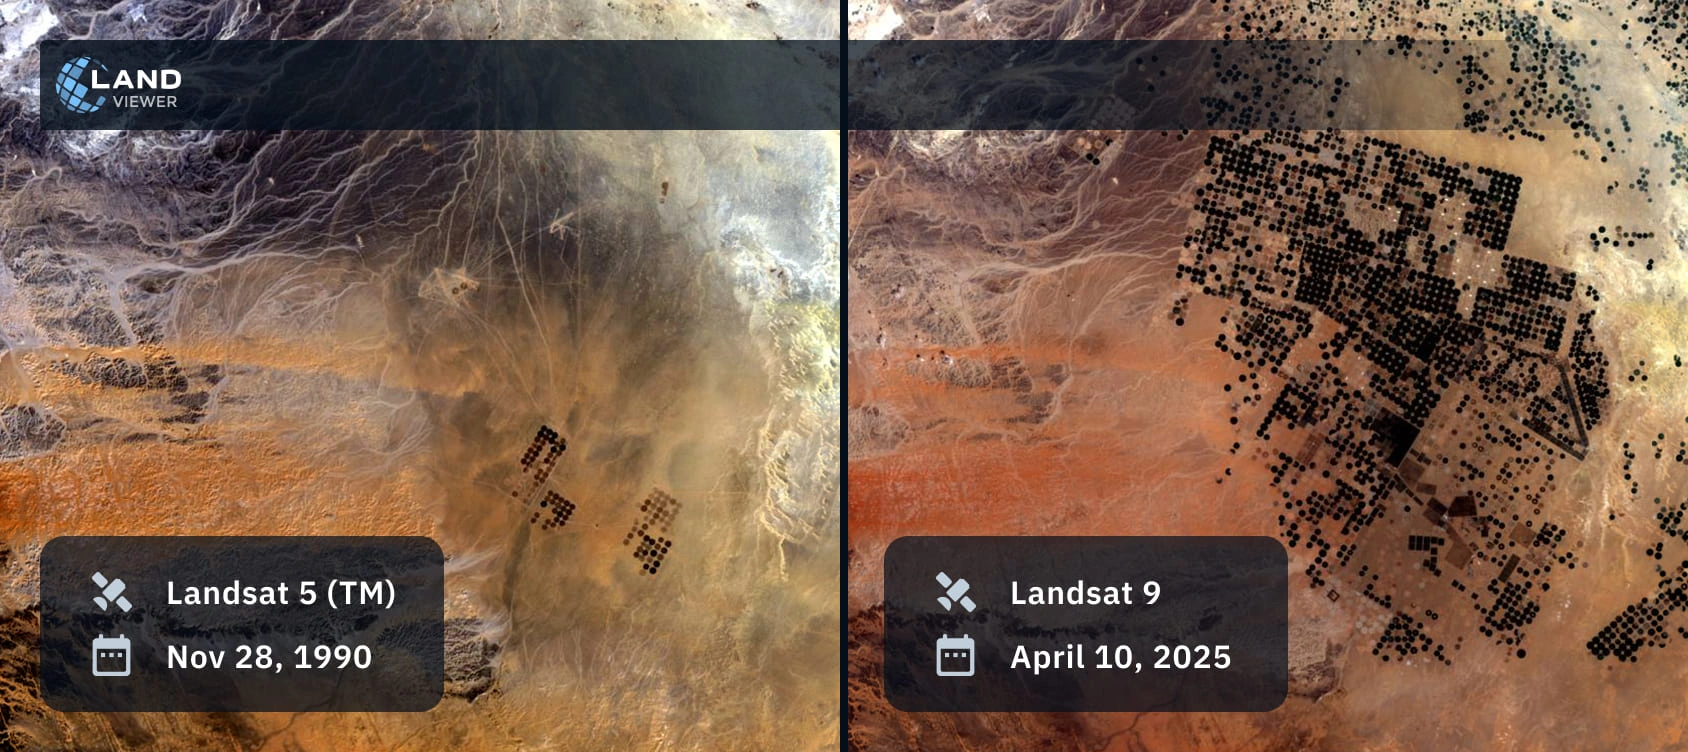
There’s no better way to understand the capabilities of EOSDA LandViewer’s historical imagery than by seeing it in action. Take, for instance, the transformation of Saudi Arabia’s desert through center-pivot irrigation, which forms signature circles across the sand seen from space. With EOSDA LandViewer, you can compare historical satellite images from as far back as 1990 to recent captures from 2025, visually tracing the expansion of these circles across the northwestern desert.
How To Download Old Satellite Images From EOSDA LandViewer
You can browse and download historical low-resolution (e.g., MODIS data) and medium-resolution images (e.g., from Landsat 8 or Sentinel-2) on EOSDA LandViewer, with JPEG files available for free. For more advanced historical imagery formats like KMZ or GeoTIFF, a PRO subscription is required. This flexibility ensures that both casual users and professionals can find the right format for their needs. Unlike many platforms that either restrict data downloads or offer limited options, EOSDA LandViewer makes historical imagery significantly more accessible and affordable.
EOSDA LandViewer’s Features For Analysing Historical Satellite Images
EOSDA LandViewer is equipped with practical features for anyone working with old satellite imagery — be it for personal interest, research, or commercial use. You can analyze changes over time, compare historical images from different dates, or extract specific information depending on your needs. Those features are designed to be intuitive and flexible, making it easier to work with historical space-derived images regardless of experience level.
Change Detection
Whether you want to explore how a forest has grown, how urban areas have expanded, or how your city looked ten years ago — the Change detection feature on EOSDA LandViewer applied to old satellite data makes it easy to visualize changes over time.
But it’s not just for curiosity. Detecting changes also helps minimize risks from natural disasters like wildfires, tornadoes, floods, and volcanic eruptions. Comparing old satellite images from different dates allows you to assess damage and inform recovery decisions.
Follow these simple steps and let the Change detection feature do the rest:
- select your AOI using the available drawing tools or upload a shapefile;
- choose two historical satellite images from different dates for comparison;
- open the Change detection menu by clicking on the corresponding button;
- select a relevant index (like NDVI or NBR) depending on the type of change you want to track and click the Calculate button;
- adjust the opacity to highlight changes.

Once done, you can save the results or download them for sharing on social media, including in reports, or embedding on a website.
Time-Series Analysis
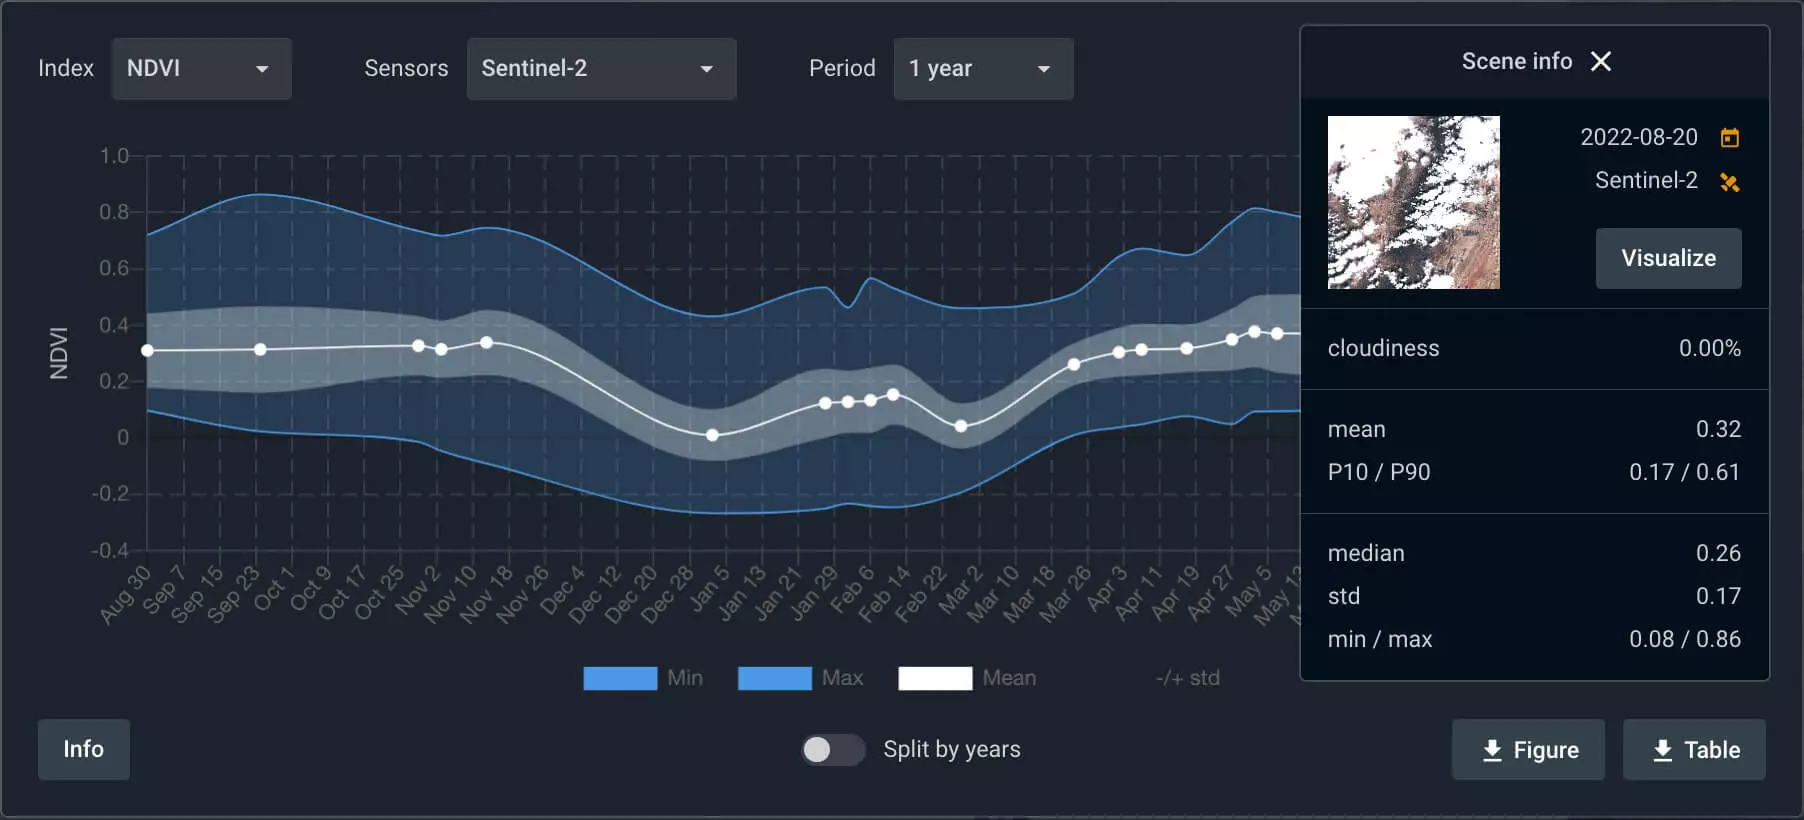
Time series analysis allows for data dynamics visualization with a spatiotemporal vegetation index graph based on NDVI, as well as index graphs for NDWI and NDSI . The feature can be applied to old images to monitor vegetation growth, changes in land use, identification of crop development stages, and more.
Visualization graphs of historical satellite images are generated after filtering the sensor (most often Sentinel-2 and Landsat 8 data) and the time interval for analysis. A specified AOI must not exceed 200 square kilometers. A graph allows for tracking the dynamics of changes in index values. Each point on the graph corresponds to a certain old image within the selected time frameworks. To view old satellite maps online in detail, zoom in at any point by clicking.
Time-Lapse Animation
The Change detection feature shows the dynamics of events over a span of time, be it centuries, decades, or years. But static old images can’t quite match the impact of watching change unfold in motion. EOSDA LandViewer offers such an opportunity with the Time-lapse animation tool. It turns old images into compelling GIFs or videos, useful in both science and business — and just as engaging for everyday exploration. Thus, the historical time-lapse of space-derived images provides valuable insights into oil spills, urban growth, deforestation, ice sheet cracking and melting, and more.
A great example is the dramatic retreat of Columbia Glacier in Alaska, captured from 1984 to 2025 using historical satellite imagery from Landsat 4, 5, 7, 8 and Sentinel-2. Access to historical data from multiple satellite missions on EOSDA LandViewer makes it easy to find the clearest and most relevant old images visualizing this specific phenomenon and any other features or events.
Trace dynamics and identify patterns to predict future
Historical satellite images are now in high demand across various industries, with agriculture being one of the earliest to benefit from comparing old and present data. Access to old images from previous growing seasons makes it possible to generate historical NDVI time series, assess field productivity, identify trends, and forecast yields.
Commercial Historical Satellite Imagery For Professional Use
Historical images with low or medium resolution are often insufficient for accurate analysis. Purchasing high-resolution old satellite images provides greater opportunities for detailed research. High-resolution old satellite imagery is especially valuable for environmental monitoring (including natural disasters), pollution assessment, and studying the effects of climate change. Commercial old imagery also provides numerous benefits for industries like mining, construction, and infrastructure development.
On EOSDA LandViewer, historical high-resolution images — from KOMPSAT, SuperView, Gaofen, Beijing, and other satellites — are available at resolutions ranging from 0.3 to 2 meters per pixel, and can be downloaded in GeoTIFF format.
If you have any questions about our historical imagery archive or the features of EOSDA LandViewer, feel free to reach out to us at sales@eosda.com — our experts will be glad to provide more information.
About the author:
Kateryna Sergieieva has a Ph.D. in information technologies and 15 years of experience in remote sensing. She is a Senior Scientist at EOSDA responsible for developing technologies for satellite monitoring and surface feature change detection. Kateryna is an author of over 60 scientific publications.
Recent articles
EOSDA to Monitor Wildfires in Portugal Using Satellite Data Under ESA’s InCubed Programme
The company signed a contract with ESA to create an innovative satellite-based solution for forest monitoring and wildfire prevention.
EOSDA Forecasts Yields For 2025 In Saskatchewan
EOSDA created RM-level crop yield forecasts for Saskatchewan to address limitations of official data. The project shows how satellite and weather inputs reveal local yield changes during the season.
Digital Tools Improve Soil Health And Yields In Mexico
EOSDA and ITTA supported a Guanajuato farm with contour-line planning, monitoring tools, and practical guidance to reduce soil erosion and improve yields in the long run.