NAIP aerial images for the US: Easy access and analysis
-
Spatial resolution
1 m
-
Revisit time
once in 2–3 years
-
Spectral bands
Red, Green, Blue, and NIR
-
Processing grid
5 km x 5 km
-
Data archives
From 2003 to present
-
Analytical tools
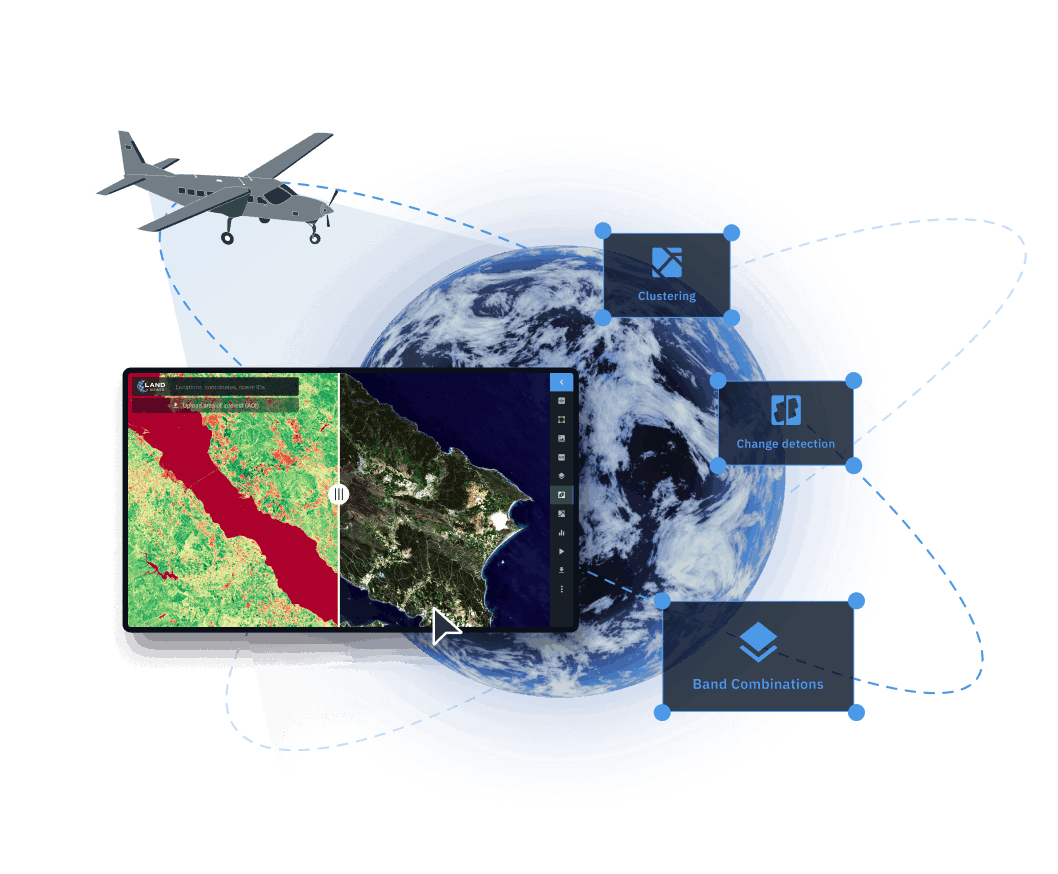
Change detection, clustering, time series analysis
How to find, analyze, and download NAIP imagery on LandViewer
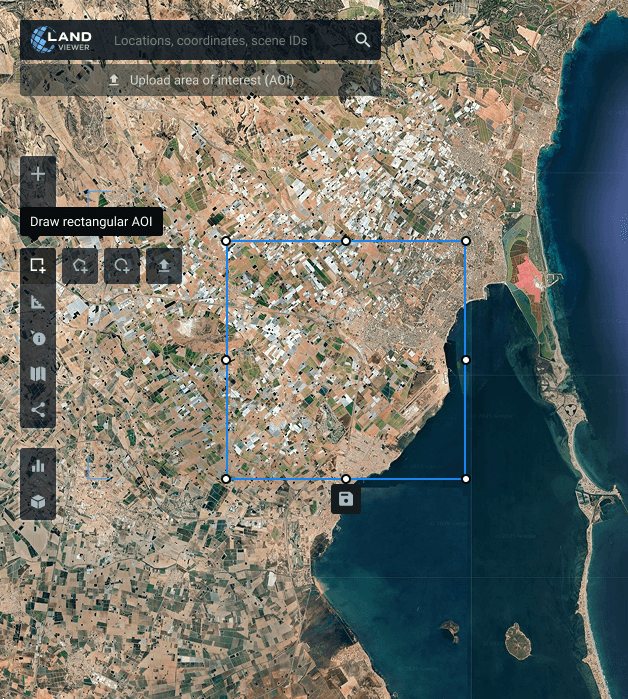
Define your monitoring area within the US
Specify the area to monitor in the US only: find your location on the map, draw a custom AOI, or upload an existing boundary file.
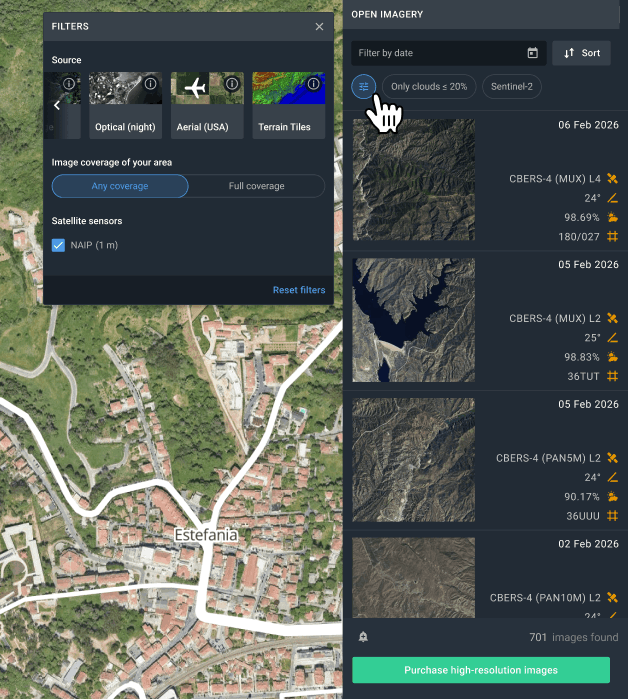
Fine-tune aerial imagery search
Apply filters to find relevant NAIP imagery based on capture date and AOI coverage, fast and simple.
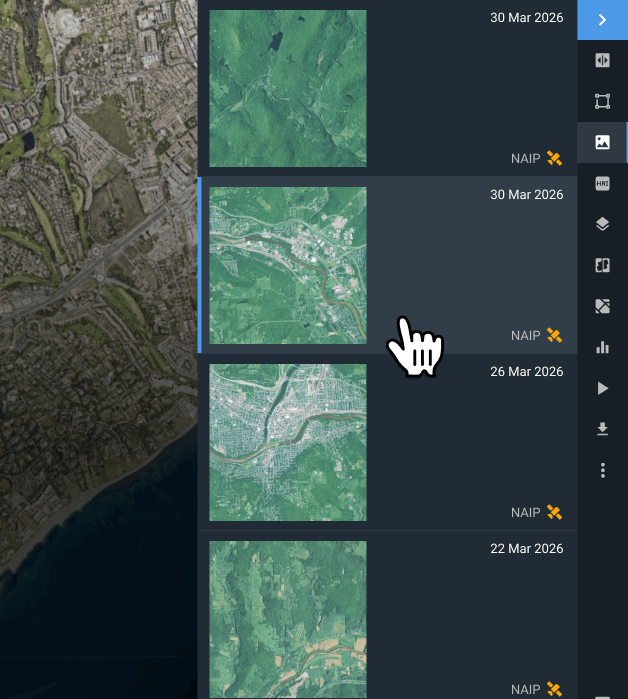
Pick imagery that fits your needs
Choose the most pertinent results among all filtered options in the NAIP imagery viewer.
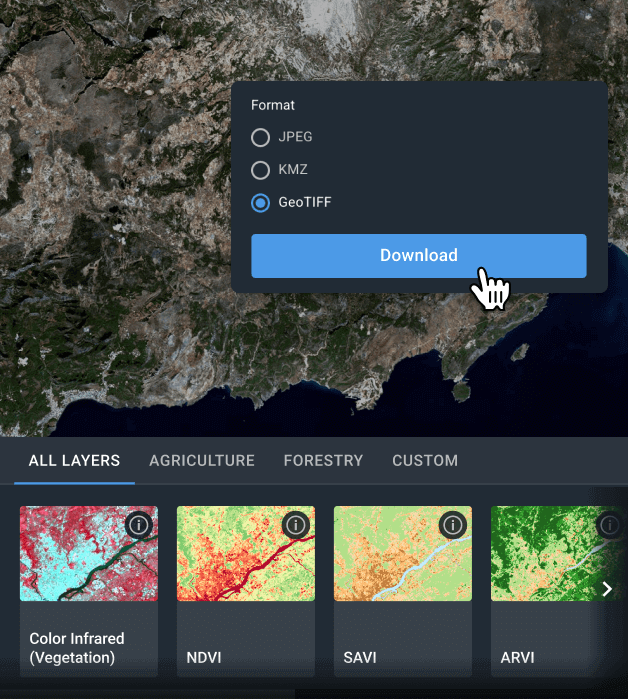
Download NAIP aerial imagery or analyze it online
NAIP imagery is easy to download in GeoTIFF, KMZ, or JPEG formats for use in GIS tools such as QGIS or ArcGIS. You can also perform on-platform analysis in LandViewer with change detection, time series, and clustering tools.
Dive deeper into NAIP data analysis using LandViewer
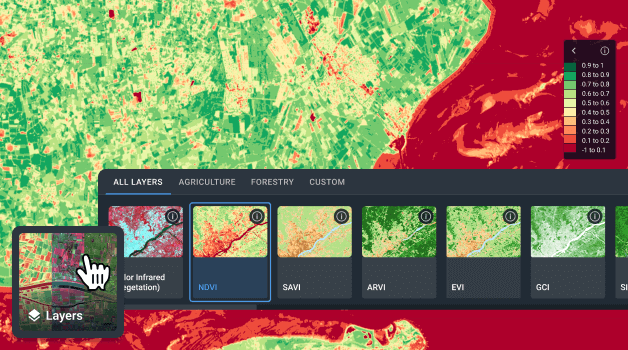
Indices and band combinations
Select the most suitable spectral bands to enhance feature interpretation on maps. With over 20 predefined indices and band presets, LandViewer supports detailed analysis of crops, soils, and environmental anomalies, while also allowing the creation of fully customized indices.
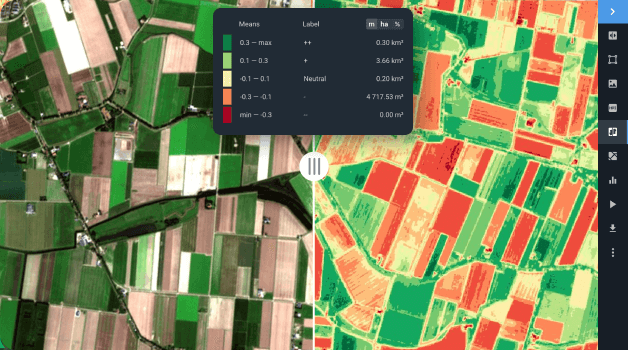
Change detection
Identify changes in land cover by comparing images from different periods. Whether analyzing environmental recovery or urban sprawl, the platform’s change detection capabilities deliver meaningful context for informed decision-making.
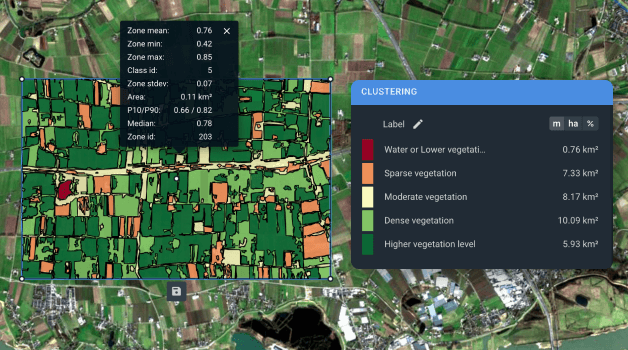
Clustering
Use clustering and vectorization to organize raw raster data into meaningful zones with shared index values. This will help you gain a deeper knowledge of the data. Within your designated region, these algorithms provide two additional layers that aid in detecting vegetation growth patterns, monitoring water conditions, and tracking land use changes. Knowledge gained from clustering can be applied in a variety of industries and use cases.