Change Detection In GIS And Areas Of Its Application
Roughly speaking, change detection methods in remote sensing and GIS are based on finding discrepancies in two satellite images before and after a certain event. Change detection algorithms for GIS compare the spatial representation of two points in time and measure differences in the variables of interest.
Change detection helps in many businesses, but its applications also include non-commercial use. In particular, this GIS method can be employed to track the development and consequences of flooding, forest fires, continuous droughts, and other disaster and weather extremity events.
How Does Change Detection Work In GIS?
Change detection in GIS analyzes statistical and geospatial data. Statistical data can be collected from various sources, and geospatial information is retrieved with remote sensing media including drones, UAVs, and satellites. Nowadays, satellite change detection is gaining more popularity, often being the fastest and cheapest option thanks to open data access.
When To Use Change Detection: 4 Types Of Differences To Track
Change detection algorithms compare two images by a certain distinguishing feature and its properties in a questioned interval of time. The differences in the object’s shape, size, location, and identity are the four basic distinguishers (variables) to track.
- Transformations in the object’s shape in the interval of time. Generated with satellite images before and after, a change detection map displays if the object has acquired a different shape. For example, it helps understand the transformations of forestlands’ shape after wildfires, selective group logging, or clear-cuts.
- Transformations in the object’s size in the interval of time. Change detection mapping can also show if the questioned AOI element gets bigger or smaller when two or more satellite images for different dates are compared. For example, this type can show dried-out rivers or lakes.
- Transformations in the object’s location in the interval of time. This type helps track if a questioned object moved to another area within the specified period.
- Transformations in the object’s identity in the interval of time. Combining satellite monitoring and other data sources, this type can show if the same object is used for a different purpose over time. For example, a former factory building may get a new life as a mall, or residential premises turn into a hotel or hostel. Mind that such analysis can’t fully rely on a live comparison of satellite imagery because additional information about the object is required.
How To Perform Image Change Detection With EOSDA LandViewer
You don’t have to be a GIS expert to compare two satellite images with EOSDA LandViewer. The analysis can be performed even by users with little experience or no GIS background. Just try and use the Change detection tool in the software. To do so, complete the following steps:
- Set your AOI.
- Select the first satellite image of the analyzed event.
- Go to the Change detection menu.
- Select the second satellite image for comparison (dated earlier or later).
- Apply the appropriate index to compare the images.
- Click Apply and Calculate to see the change.
EOSDA LandViewer will generate a satellite change detection map based on the specified index (both default and custom indices are available). The outcome image allows for visual GIS analysis of two images and tracking modifications that occurred within the period. Our image change detection software will also calculate and show the size of the affected area. When needed, the platform users can download the results as a JPEG, PNG, or TIFF file.
EOSDA LandViewer is a free change detection software for images of low and medium resolution. Hi-res imagery is available by request. Besides, additional features like satellite time-series graphs and time-lapse animation provide even a more vivid presentation. These features allow for comparison of more than two dates and track the transformation dynamics, as well as perform a retrospective GIS analysis to leap back in time.
It depends on the used sensor and change detection applications. In most spatial analysis cases, atmospheric effects on optical images must be previously smoothed. Atmospheric correction typically implies the removal of aerosols and clouds to get more accurate satellite imagery data for change detection. In EOSDA LandViewer, Sentinel-2 images dated 2018 and later have already undergone atmospheric correction (L2A level of procession).
EOSDA LandViewer
A vast online catalog of free satellite imagery for processing and downloading.
Examples & Industry Applications: Change Detection In Practice
Geospatial change detection has a plethora of uses. The method is employed to track transformations of the forest area (deforestation), crop state, land use, urban expansion, vehicle movement, glacier cracking, and more. The detection of anthropogenic climate change in the world’s oceans helps realize the problem’s scope and plan an effective response.
Let’s consider several disaster and weather extremity examples to understand how change detection can help to analyze the development of such events and facilitate further actions.
Change Detection Algorithms To Analyze The Consequences Of Flooding
Assessment of the impact of natural and anthropogenic disasters is a common change detection example in environmental monitoring. Sadly, hurricanes, droughts, and abnormal rainfall are frequent present-day phenomena. River flooding is among the notorious climate change indicators nowadays.
Brief Description Of The Disaster Event
In August 2022, 24 people died and 18 were injured as a result of a large-scale flood in Sindh, Pakistan’s most populous province. Many victims perished under the ruined building roofs and walls. Because the drainage and sewage systems are worn out and long out of date in the country, downpours during monsoons present a severe threat to Pakistanis.
Objective
To identify the flooded area with the remote sensing change detection approach by comparing satellite images for different dates and applying specific spectral bands and their transformations; to assess the disaster’s damage; to understand the flooding dynamics and size.
Analyzed Data
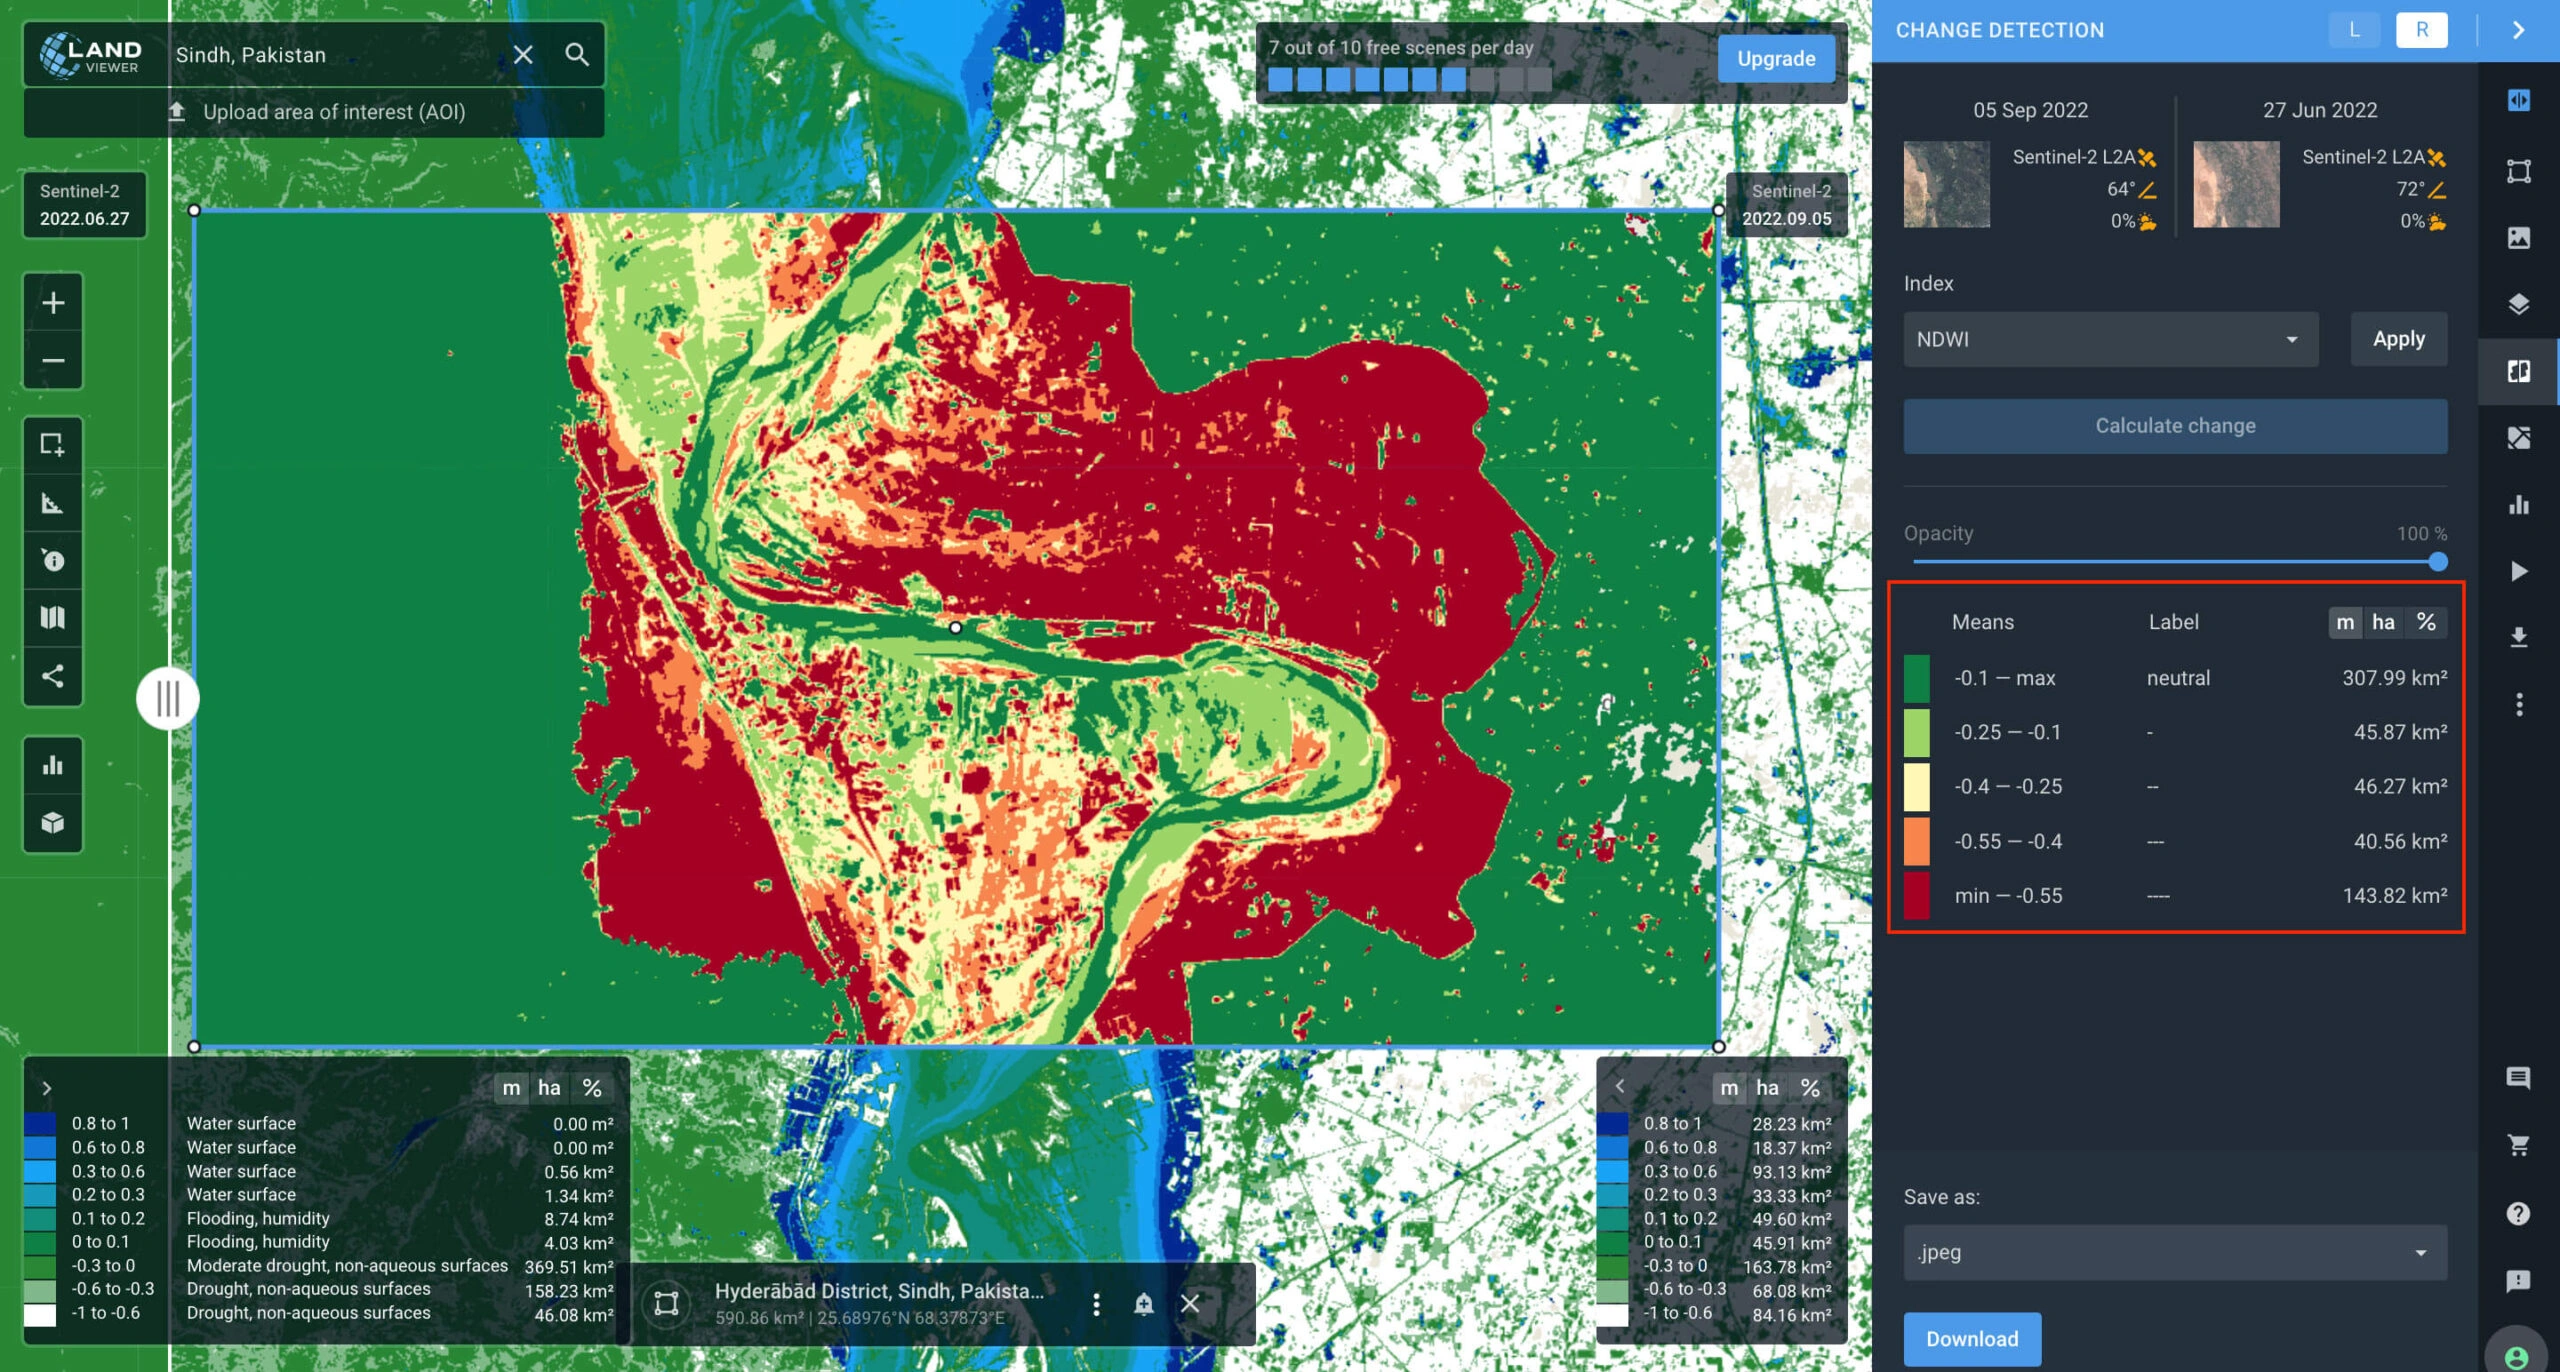
- Imagery source and dates: Pre-disaster image (Sentinel-2 2022.06.27) and post-disaster image (Sentinel-2 2022.09.05) in EOSDA LandViewer.
- AOI: Part of the Indus River and its surrounding areas within Sindh Province, Pakistan.
- Index: NDWI.
Solution And Results
The obtained NDWI change detection map delineates the transformations of the underlying (Earth’s) surface in the area of interest, namely, the extent of river flooding and the territory suffered. The increase and decrease in the index relative values are conventionally divided into five classes. Each class has distinct spatial indications that can be displayed in %, hectares, or square kilometers.
This GIS use case features how image change detection can help in managing disaster relief operations by highlighting the most suffering areas in red. The information will help assess the destruction scope and validate insurance claims, attesting to the importance of satellite change detection in insurance. The analysis results can be also used to plan new safe construction of residential and other buildings.
Satellite Imagery For Change Detection After Forest Fires
Wildfires are among the most frequent and dangerous natural calamities causing serious damage to ecosystems and global communities. The U.S. National Interagency Coordination Center (NICC) reports nearly 59 thousand unplanned forest fires that burnt over 7.1 million acres nationwide in 2021. Forest fires are a serious problem in Ukraine as well.
Brief Description Of The Disaster Event
In April 2020, large-scale forest fires took place in the Zhytomyr and Kyiv regions of Ukraine due to a difficult meteorological situation and the locals’ irresponsible handling of fire. The fires destroyed hundreds of forestland hectares. A large part of the ignited forest stands was located in the Chornobyl exclusion zone, heavily contaminated with long-lived radionuclides. The forest contamination complicated the firefighting operations that involved over 1,000 people and lasted for several weeks.
Objective
To use change detection methods in remote sensing and track the differences in forest stands before and after. To understand wildfire scale and dynamics, to estimate the size of burnt areas and lost forest assets with land cover change detection in GIS.
Analyzed Data
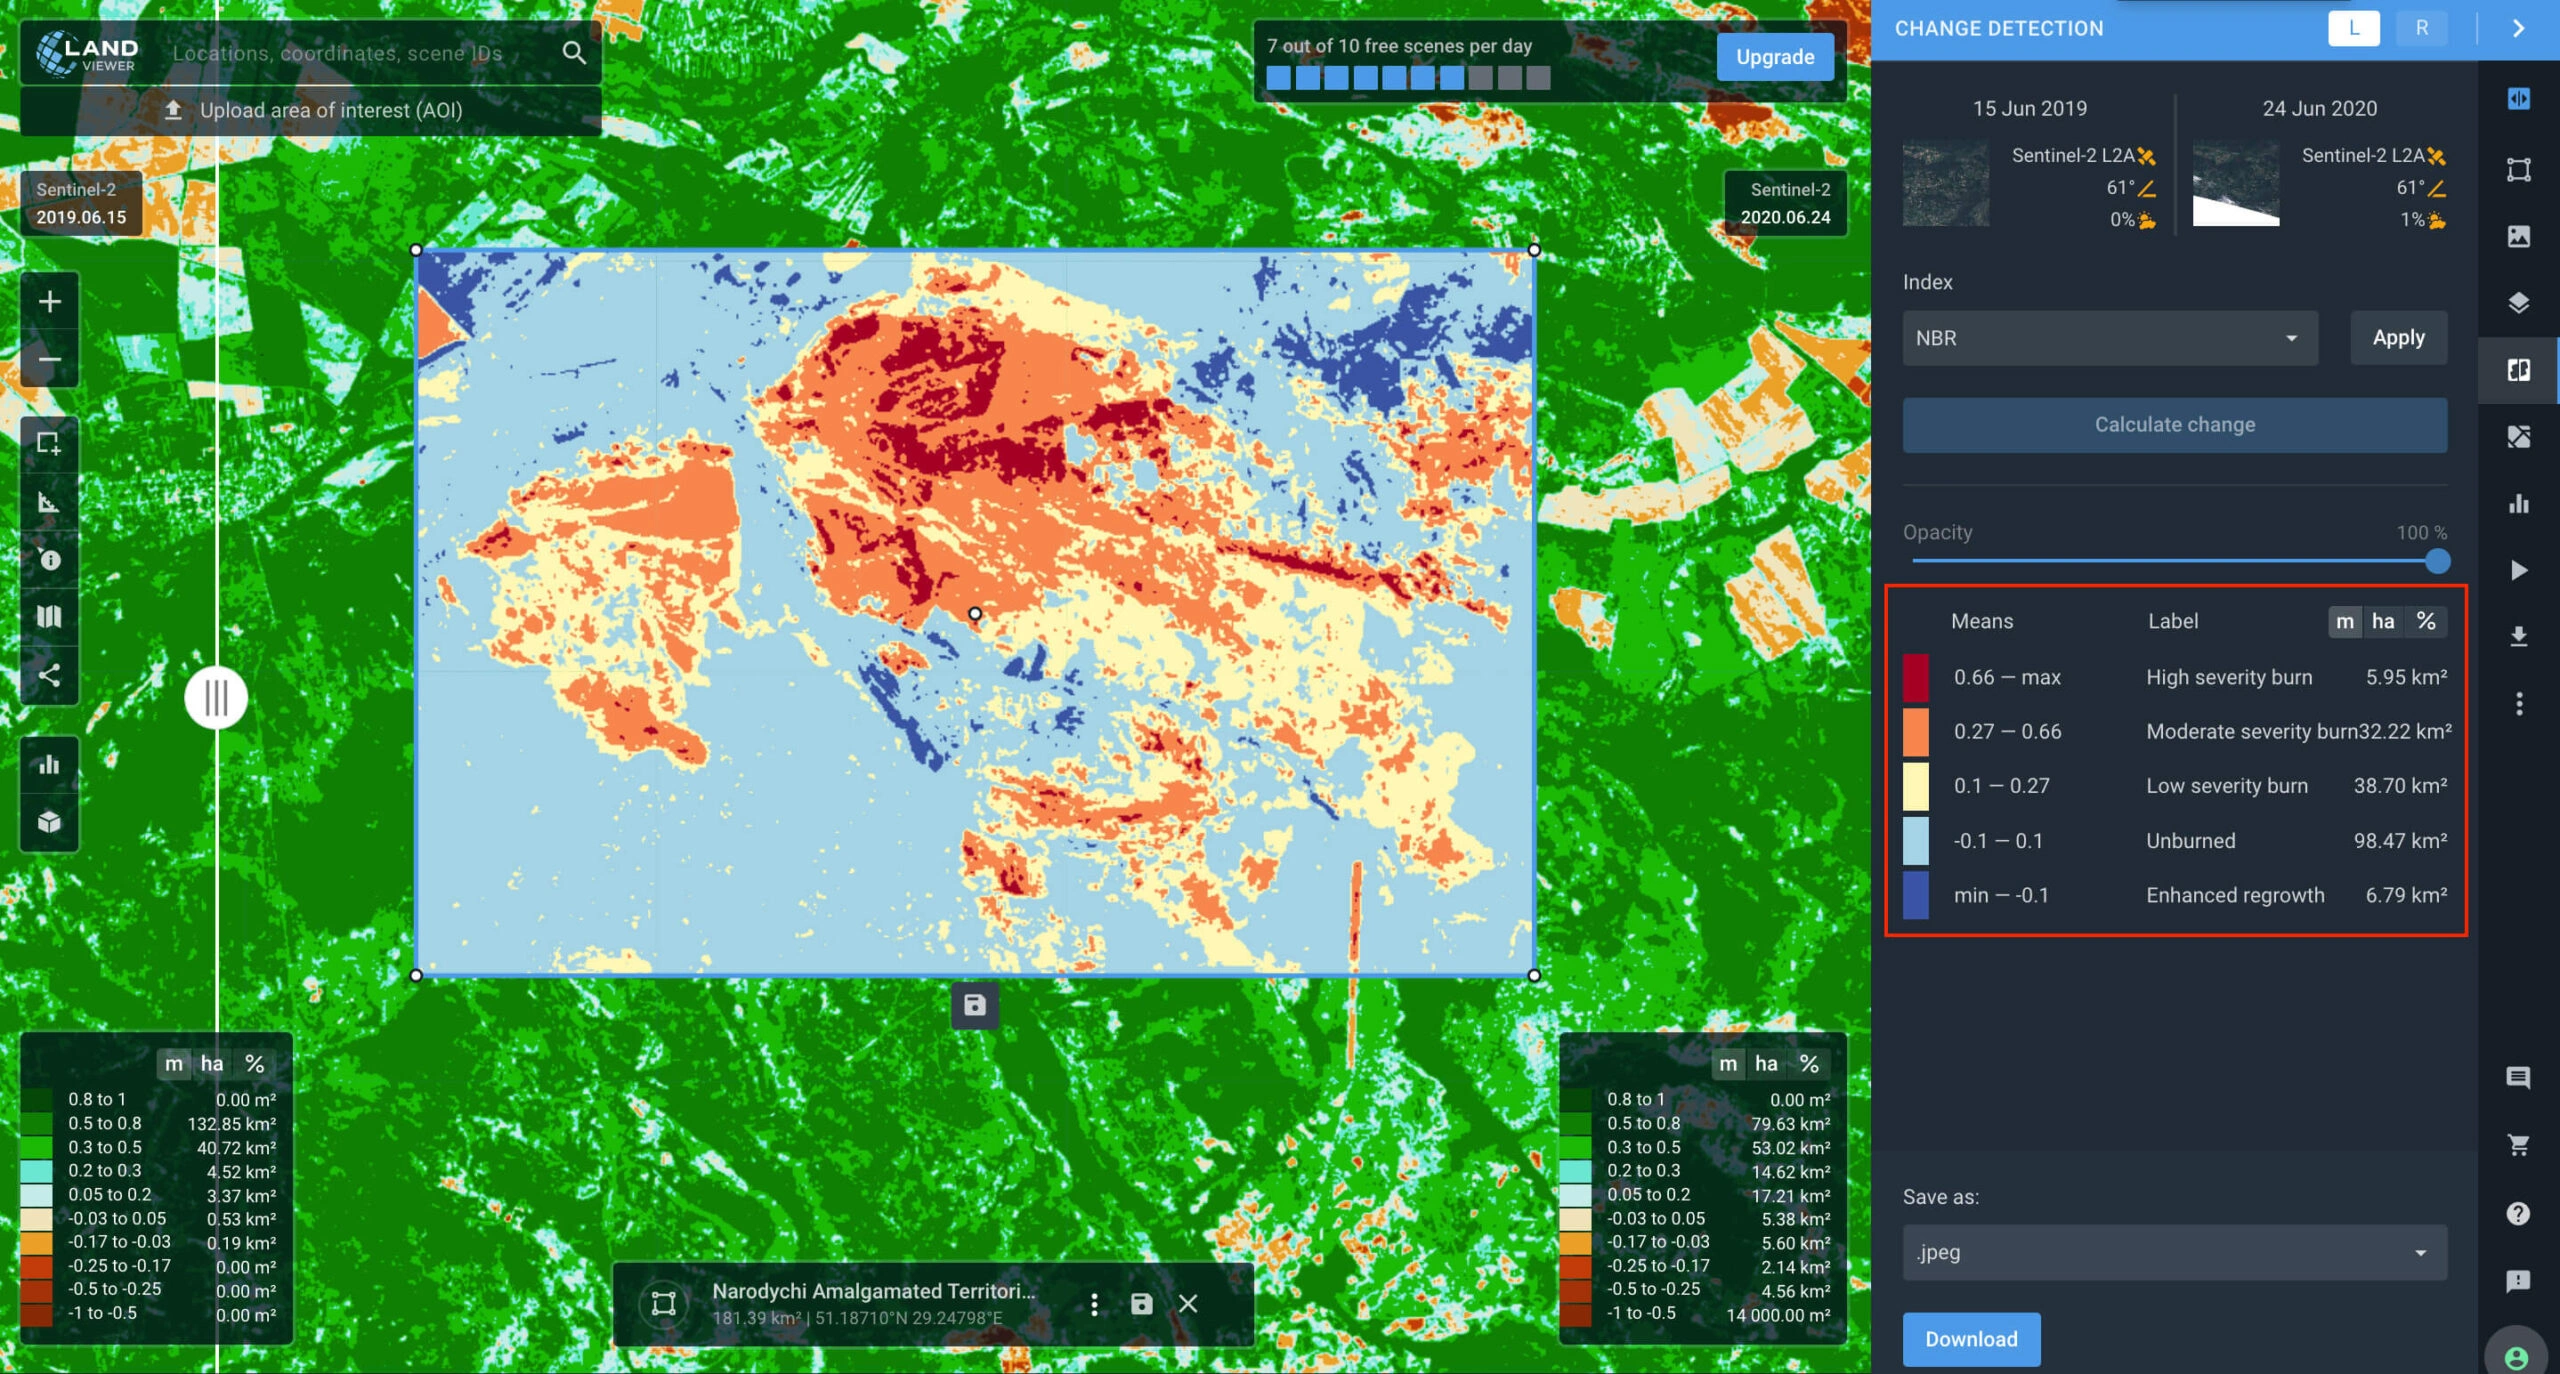
- Imagery source and dates: Pre-disaster image (Sentinel-2 2019.06.15) and post-disaster image (Sentinel-2 2020.06.24) in EOSDA LandViewer.
- АОІ: forests in Zhytomyr region, Ukraine.
- Index: NBR.
Solution And Results
Land cover change detection using remote sensing and GIS shows the difference in the forest area state on the initial and final images. The Change detection tool in EOSDA LandViewer also divides the AOI into several zones depending on the pre-set thresholds of damage severity (see the image above):
- high severity burn – 5.95 km2;
- moderate severity burn – 32.22 km2;
- low severity burn – 38.70 km2;
- unburned – 98.47 km2;
- enhanced regrowth – 6.79 km2.
The data is especially important for disaster response and firefighting units, particularly in planning evacuation operations and fire truck access routes. Besides, the GIS analysis results allow for preliminary assessment of damaged forest areas and calculation of estimated losses.
Remote Sensing Satellites For Vegetation Change Detection
The agricultural sector belongs to the industries where the benefits of satellite monitoring were enjoyed early. The obtained GIS information can be useful not only to farmers but to insurance companies, banks, input suppliers, traders, and other agribusiness players.
Brief Description Of Weather Extremity
In the summer of 2022, soil and air droughts badly affected the corn crops of the Mohyliv-Podilsky, Shargorod, and Chernivtsi rural communities in the southwest of the Vinnytsia region. The sowing campaign was conducted on May 5-6, with no subsequent precipitation for two months. Traditionally, crop production in that part of Ukraine strongly relies on rains, and the absence of soil moisture caused a critical yield loss.
Objective
To track vegetation change detection using EOSDA LandViewer functionalities; to analyze crop growth dynamics and the impact of unfavorable weather conditions on the field state; to assess vegetation stress.
Analyzed Data
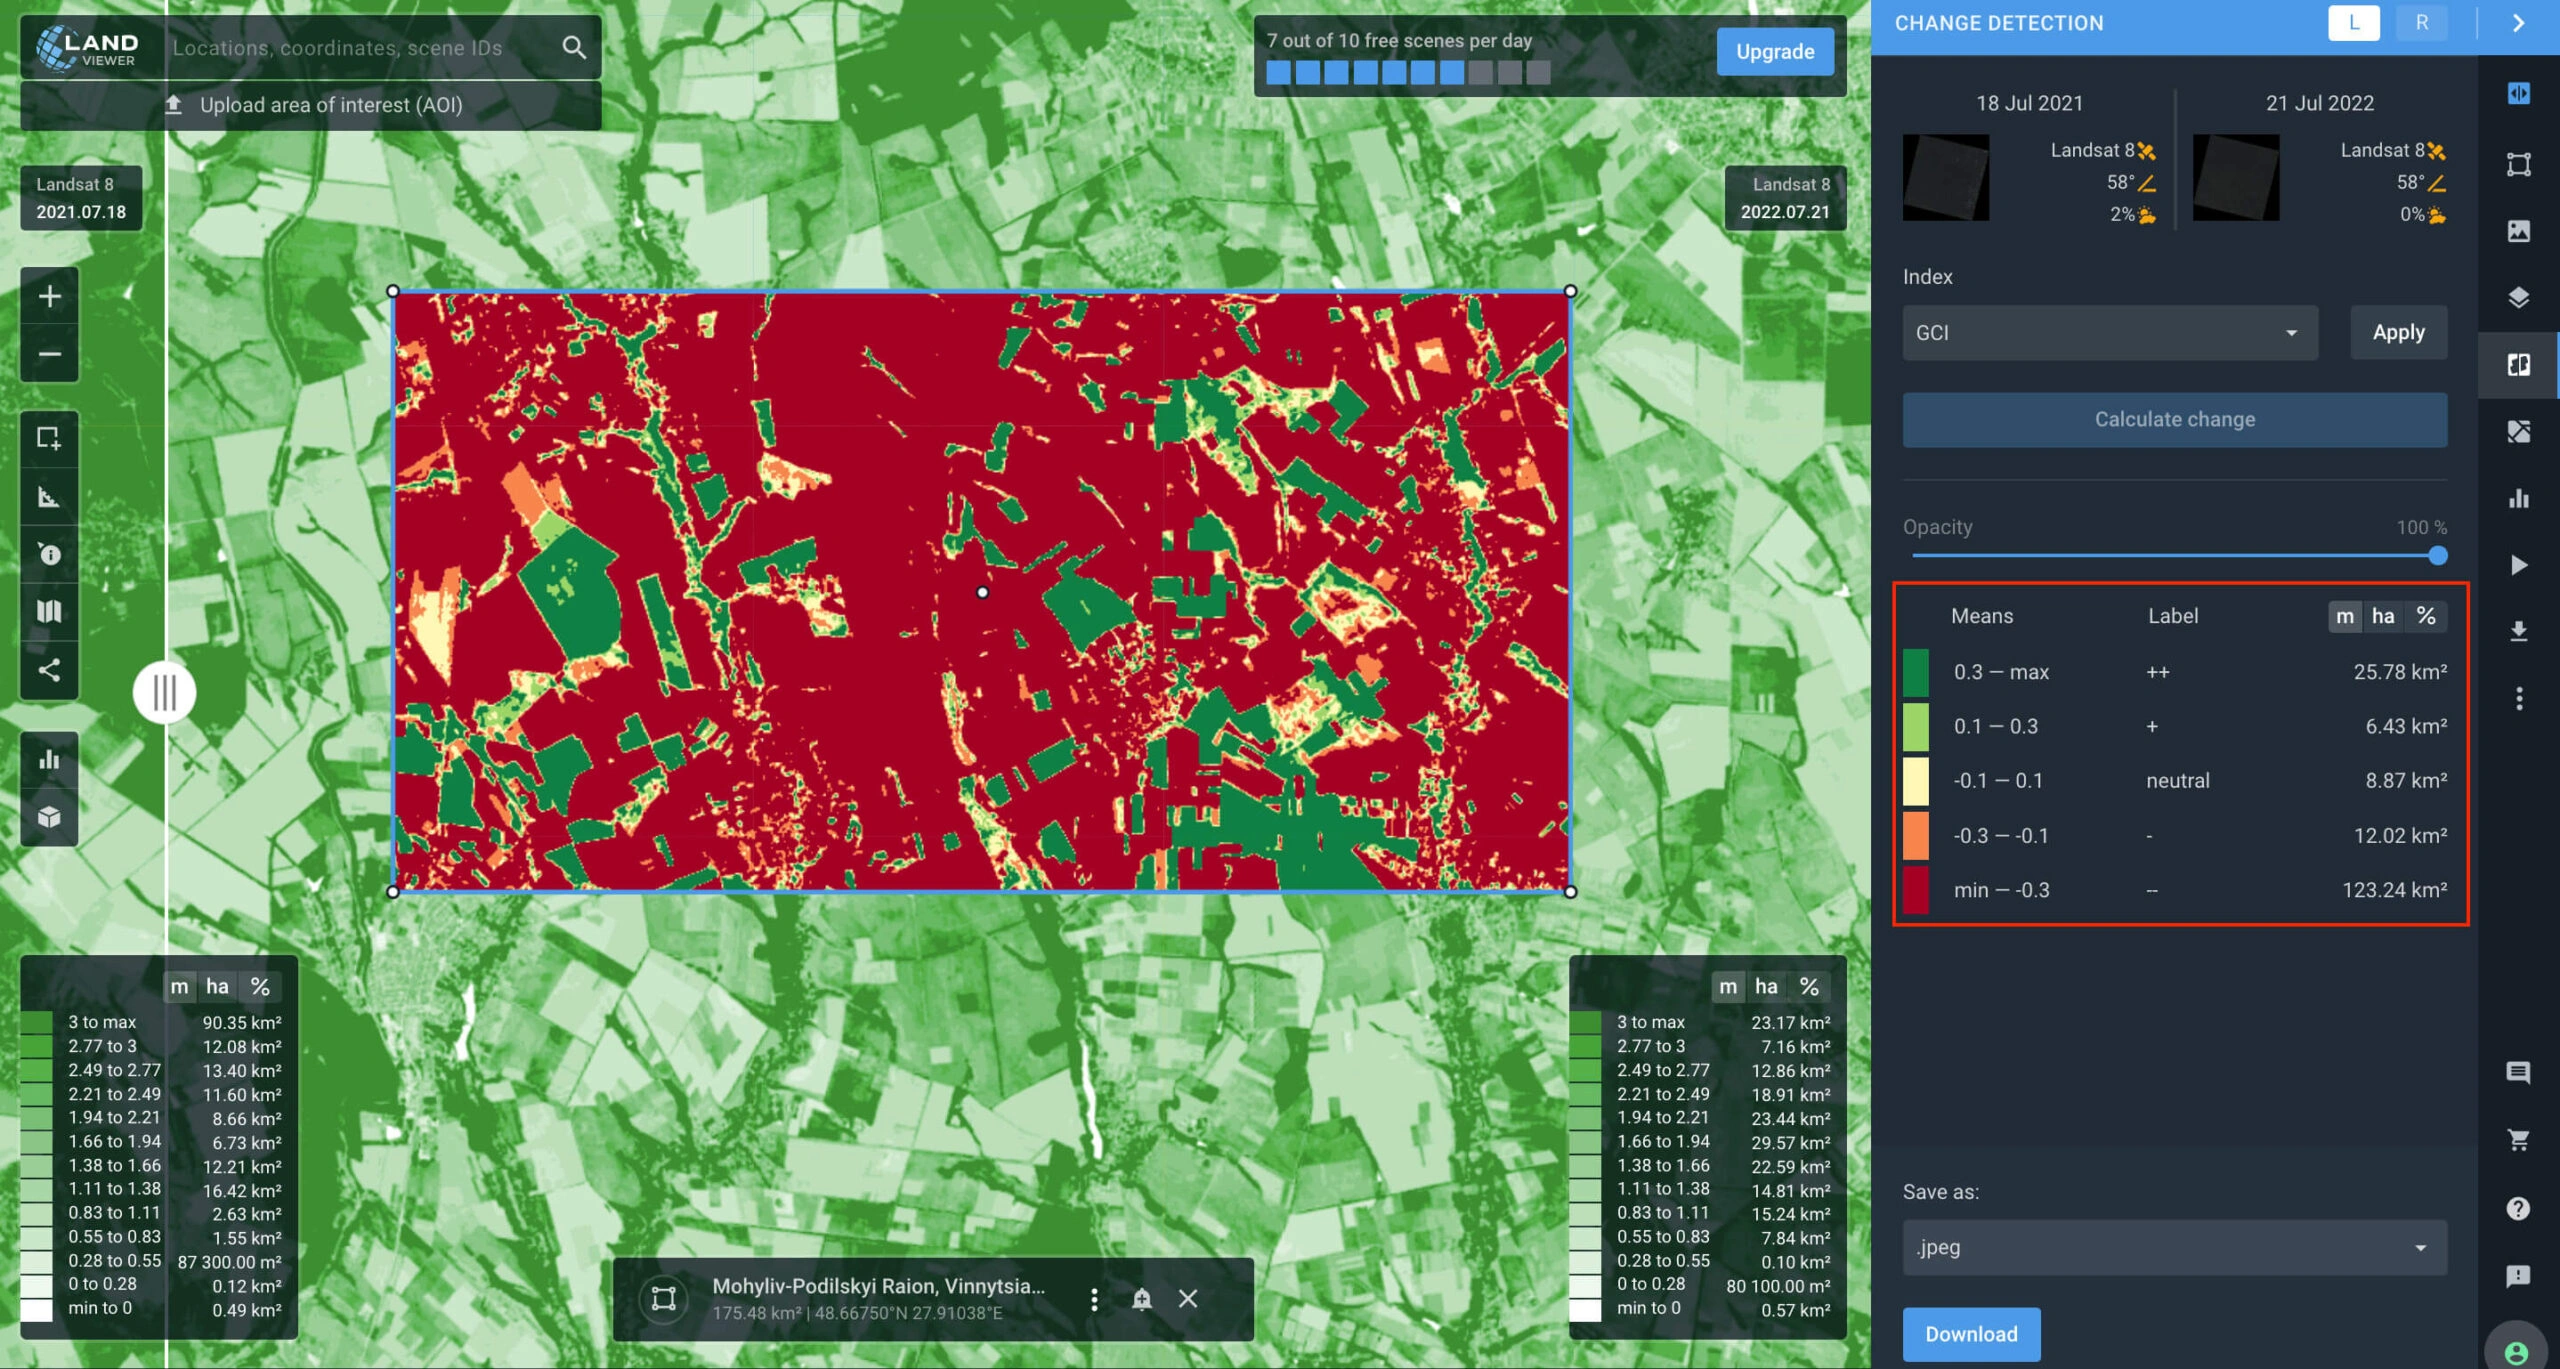
- Imagery source and dates: Pre-disaster image (Sentinel-2 2021.07.18) and post-disaster image (Sentinel-2 2022.07.21) in EOSDA LandViewer.
- АОІ: corn fields near Shargorod, Vinnytsia region, Ukraine.
- Index: GCI.
Solution And Results
Measuring differences in the index values, change detection algorithms show the stressed zones and help understand the weather extremity impact in the area of interest. As displayed in the snapshot above, the territory of 135.26 square kilometers suffered the most (a sum of orange and red highlighted areas). The GIS analysis results help assess the field damage, attesting to the importance of change detection data in crop insurance.
The obtained GIS information is ultimately useful in agricultural decision-making to save crops and mitigate yield losses. For example, the plants’ state can be improved with fertilization, precision irrigation, and other relevant field operations.
Change Detection In GIS For Non-Commercial Use
Satellite imagery comparison provides actionable insights into multiple industries, but its applications go far beyond business purposes. The method can be interesting for amateur analysts, especially when GIS change detection software is easy to use and provides a free satellite imagery database.
Such online platforms can help governmental bodies, non-commercial entities, and other organizations to derive valuable information on how AOI properties modify over time. For example, alongside other sources, healthcare institutions can use GIS change detection to analyze the spread of disease .
EOSDA LandViewer offers a rich collection of satellite images, and its GIS change detection tool is not the only useful feature. Learn more about the platform’s functionalities or ask a question at sales@eosda.com.
About the author:
Petro Kogut has a PhD in Physics and Mathematics and is the author of multiple scientific publications. He is the Soros Associated Professor as well as the head of the department of differential equations in the Oles Honchar Dnipro National University and has received a number of grants, prizes, honorary decorations, medals, and other awards. Prof. Dr. Petro Kogut is a science advisor for EOSDA.
Recent articles
EOSDA to Monitor Wildfires in Portugal Using Satellite Data Under ESA’s InCubed Programme
The company signed a contract with ESA to create an innovative satellite-based solution for forest monitoring and wildfire prevention.
EOSDA Forecasts Yields For 2025 In Saskatchewan
EOSDA created RM-level crop yield forecasts for Saskatchewan to address limitations of official data. The project shows how satellite and weather inputs reveal local yield changes during the season.
Digital Tools Improve Soil Health And Yields In Mexico
EOSDA and ITTA supported a Guanajuato farm with contour-line planning, monitoring tools, and practical guidance to reduce soil erosion and improve yields in the long run.