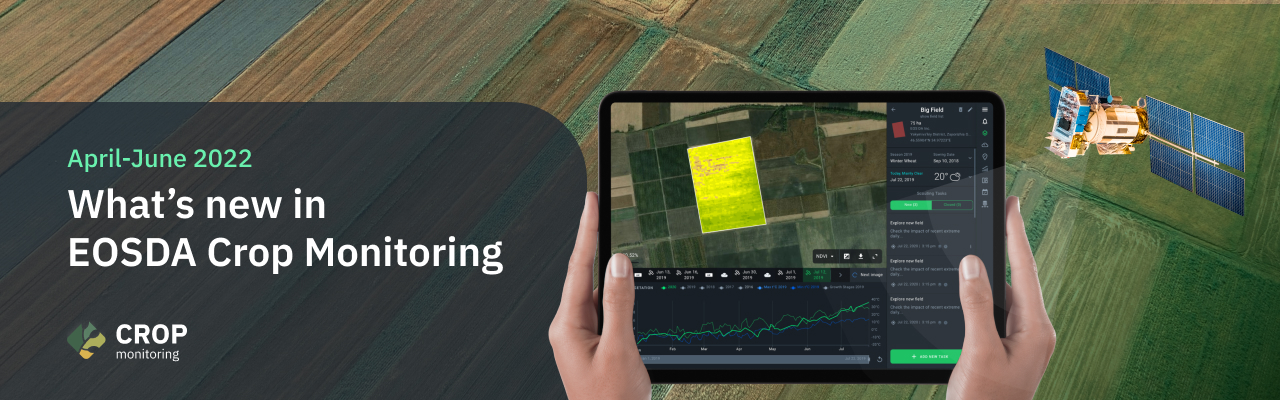
As we understand that perfection knows no limits, we keep enhancing our crop health analysis product and adding new features and capabilities. So we’re sharing EOSDA Crop Monitoring updates for the last three months in this digest.
Enriched High-Resolution Images Subscription
We’ve added the Split view mode so users can compare high-resolution images for different dates on the same screen and track the changes in crop performance. Also, it’s currently possible to use high-resolution imagery for scouting tasks. And finally, the images now have a legend showing the total area of each index value class.
The updates mentioned above are available in a paid add-on. Find out more details via the link daily high-resolution images.
New Crop Types For Monitoring
We’ve complemented our platform with 35 new crops based on the most frequent user requests from India, Egypt, Serbia, Malaysia, Canada, Mexico, and other countries.
As of today, the following crop types can be monitored: Plum, Bluegrass, Kiwi, Pomegranate, Table Grapes, Green Beans, Rose, Casuarina, Coconut, Hazelnut, Okra, Broccoli, Cauliflower, Snap Peas, Triticosecale, Sorghum sudanense, Papaya, Areca nut, Anise, Artichoke, Belladonna, Blessed thistle, Calendula, Caraway, Chamomile, Chilli, Clover, Coriander, Dandelion, Devil’s claw, Echinacea, Elder, Fennel Bitter, Fennel Sweet, Feverfew.
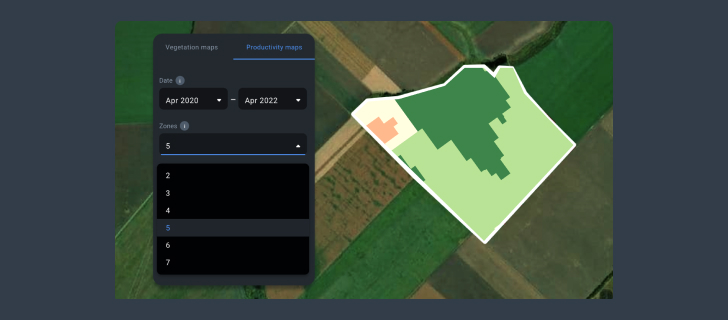
Zones Selection On Productivity Maps
The option to manually select the number of zones on the Productivity Map is now live on the platform. This feature enables users to define particular field areas’ productivity and apply potassium and phosphorus fertilizers more effectively. Also, the enhanced Productivity Map will help improve seed planting and soil sampling.
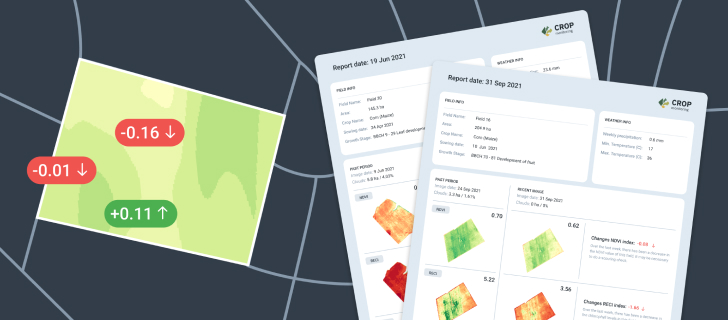
Weekly Report Add-On
It’s easy to be in the know about crop development dynamics with the weekly report. Users will get relevant updates on crop state, including changes in growth stages, NDVI, ReCl, NDMI, and more, packed in a concise format.
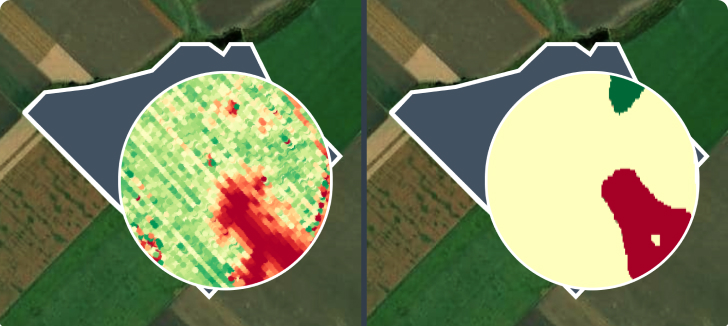
Upgraded Productivity Maps Algorithm
We’ve updated the Productivity Maps at Zoning! Thanks to these maps, users can determine how productive particular field plots are and decide on the amount of potash-phosphorus fertilizers, the number of seeds for sowing, and soil sampling areas.
Below are comparisons of Yield Maps and Productivity Maps zones created with the new algorithm.
If you have any questions, feel free to contact our support team. We will also appreciate any comments and suggestions that help us improve EOSDA Crop Monitoring.
About the author:
Rim Elijah holds a double degree in business administration and political science from Stockholm University. As a VP of Sales at EOSDA, she oversees all aspects of business model development and implementation and the growth of the company’s global coverage. She has successfully established a number of strategic partnerships with an emphasis on sustainable solutions in Africa and Asia.

Detect crop risks earlier with AI-powered field alerts.
More news
Mask, Layer, And Indices: New In EOSDA Crop Monitoring
Explore the new features added to EOSDA Crop Monitoring in Q3 2024: cloud/shadow mask management, Planet data integration, new indices, activity recommendations, and mustard growth stages.
EOSDA Crop Monitoring Adds John Deere Data Integration
EOSDA Crop Monitoring users can add their John Deere data to the platform for automated data transfer and optimized VRA mapping capabilities.
EOSDA Crop Monitoring: Map Builder Feature Rolled Out
EOSDA Crop Monitoring users can now leverage their machinery’s yield data to optimize input use and crop performance with the VRA mapping capabilities of the Map Builder feature.