Benefits of variable rate seeding are becoming evident as agricultural businesses strive to stay environmentally aware and adjust to fluctuating economic conditions.
Even though precision agriculture is on the rise, the actual implementation of variable rate planting requires adjustments in the whole value chain. Producers tend to view digitization as a considerable investment, however, by using satellite imagery analytics, they can implement variable rate seeding technology while saving on operational expenses like seeds, fertilizers, and water. This article explores the basic definitions of variable rate seeding, proposing the newest scientific research and practical ways of implementing it in modern agricultural operations.
What Is Variable Rate Seeding?
Variable Rate Seeding (VRS) is a precision agriculture technology that can properly and accurately adjust the seeding rate according to the variability of soil properties, terrain, meteorological conditions, and other factors .
Variable rate seeding has been around since at least the 90s, however, it’s been available primarily to academia and big manufacturers of farm machinery. Right now, it is becoming available to a broader audience thanks to the overall availability of big data analytics to agricultural producers. According to Vasyl Cherlinka, the Soil Scientist at EOS Data Analytics, to achieve optimal yields in the most cost-efficient way, it is best to employ variable rate seeding technology based on combining the knowledge from the fields and satellite imagery data .
Vasyl says that variable rate seeding practices recently have reached a whole new level. While there might be many ways of implementing precision planting variable rates without using digital transformation methods and big data analytics, nevertheless, the results will be more predictable and satisfying if cutting-edge technology is taken into consideration. More data means higher availability to arrive at accurate conclusions. Thankfully, things like satellite imagery have become available to broad audiences.
Yet, variable rate seeding can get even better. Data scientists take VRS to the next level by using tools and algorithms to precisely align the sowing rate with the variability of soil properties, topography, meteorological conditions, and other factors. Since things like seed germination, crop development, and yield potential may vary depending on those conditions, variable rate seeding allows seeds to be distributed accordingly, thereby optimizing yields. Using this method, farmers can better manage risks and focus on investing in areas with higher potential.
How To Improve Variable Rate Seeding With Satellite Imagery
Scientific analysis is one of the common ways to check the validity and expand the limits of theoretical expertise. The EOSDA science team tested algorithms based on digitally obtained analytics and proposed improvements to the variable rate seeding processes.
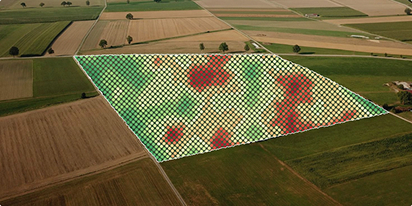
An example can be demonstrated with the use of remote sensing data from the EOSDA Crop Monitoring satellite-based precision agriculture platform. Namely, the scientists considered vegetation and soil indices from different spectral bands. Drastic changes in those values allowed them to identify areas of interest where agricultural strategies for precision planting variable rates should be readjusted.
Ideally, it’s better to complement satellite data with ground-based measurements, such as:
- Data on the genetic potential of the variety and seed germination
- Time series with satellite data on a complete set of vegetation indices
- Agrochemical, agrophysical, and physicochemical indicators of soils, soil map, derivatives of DEM (digital elevation model) analysis
- Yield maps for the last few years for all crop rotations
- Information on irrigation/drainage, and drainage layout schemes if necessary.
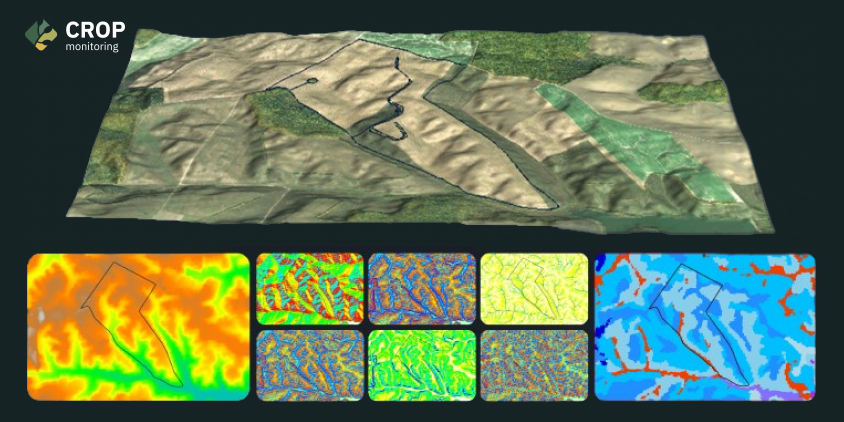
For instance, in the experimental study results, which are shown in Figure 1, they carried out a full set of analytical procedures to identify factors that have the greatest impact on crop yield, in this case, corn, in the season of 2022. In the picture, you can see an output: a 3D model of the terrain with a number of predictors that were selected for further exploration, such as slope and aspect, surface curvatures, topographic wetness index (Fig. 1), and an erosion hazard analysis (Fig. 2).
As the predictive modeling of the soil cover showed, the prevailing soils are complexes of lightly, medium, and heavily eroded Luvic Greyzemic Phaeozems (dark gray forest soils in Ukrainian classification) and chernozems with light loam texture. For these soils, the moisture interval for high-quality, agrotechnically acceptable cultivation is 15-25% and 15-18% respectively.
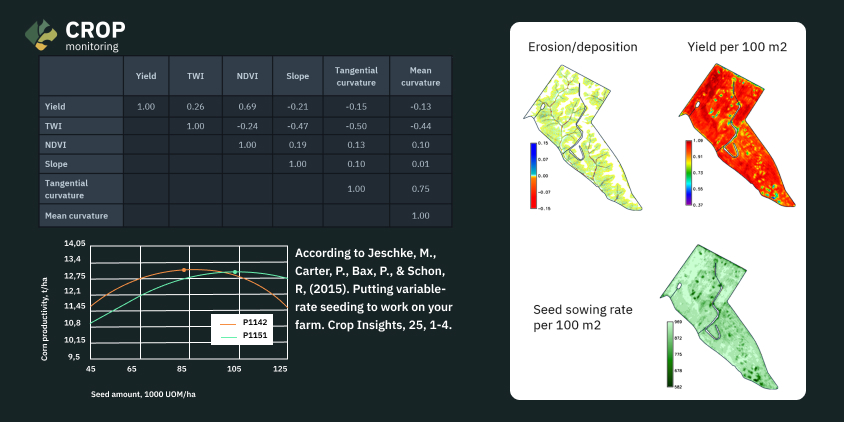
The data obtained from EOSDA Crop Monitoring allowed the scientists to identify the optimal time for variable seeding by analyzing soil moisture content and temperature. During the growing season, they used satellite imagery analytics to further analyze the reasons for yield variation. Eventually, they registered some interesting observations:
- There’s a direct correlation between NDVI (the Normalized Difference Vegetation Index), TWI (Topographic Wetness Index), and soil productivity
- There’s an inverse correlation between NDVI, TWI, and slope, as well as the tangential and mean curvature of the topographic surface
These observations combined with other data sources mentioned above have led EOSDA scientists to valuable conclusions:
- Mineral fertilizers are distributed according to terrain patterns. They appear to be transferred off the elevated areas into lower relief areas, while in horizontal areas they are distributed more evenly. Consequently, in lower and horizontal areas, increased vegetation was identified.
- Satellite imagery shows lighter spots in moderately and heavily eroded soils, which is cross-verified with the results of erosion modeling.
Considering all these factors, the EOSDA team formulated an improved variable seeding rate for the next season of corn cultivation in the given field. The previous (uniform) sowing rate of 77.5 thousand seeds/ha was changed to 91 thousand seeds/ha as an average rate.
It’s also important to note that this rate was proportionally decreased in accordance with deteriorated conditions of the soil. Those were areas of the most eroded soils with the lowest values of agrochemical, agrophysical, and physicochemical indicators. In other words, reducing the seeding rate in areas with declined yield characteristics increases the area of plant nutrition, which helps to achieve a yield close to the average for the field. In the case of a uniform seeding rate (and competition of plants for resources), achieving a similar yield rate appears to be unattainable. Results were beneficial both from business and sustainability perspectives. The estimated economic effect is expected to increase by no less than 5-10%.
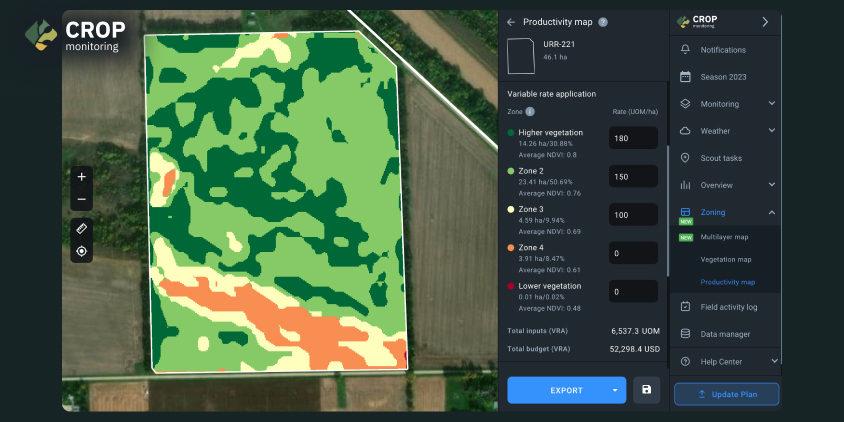
How To Apply Variable Rate Seeding In EOSDA Crop Monitoring
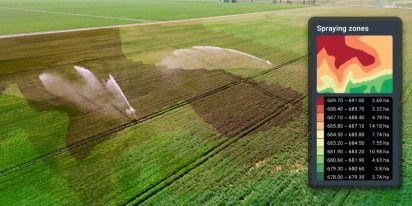
Making a variable rate planting map is possible by using a VRA maps tool for variable seeding and input application. This is a practical way to implement variable rate planting if you already have the analytics from satellite imagery and/or complex analytics as described above. The defined zones can be transferred into farming machinery via ISO-XML or SHP files. The latter format is also adapted to the technical requirements of machinery brands like Trimble, Amazone, and John Deere.
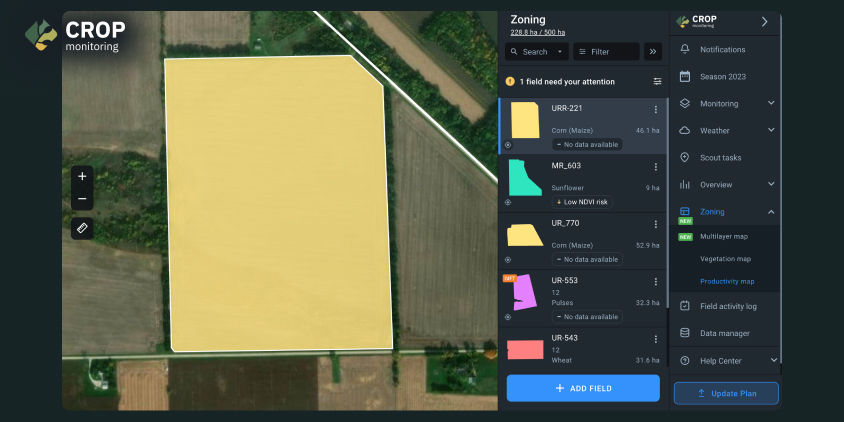
Productivity maps run a patented EOSDA algorithm that picks cloudless satellite images for a selected period and delivers NDVI analytics based on the obtained information. Using this kind of map makes it possible to perform variable rate seeding because you can see more or less productive zones in terms of the statistical average of previous crop growth.
The newly added Multilayer Maps is an example of variable rate seeding software that allows users to combine various types of analytics in one map to explore a full picture of what’s going on in the field. This could be a combination of vegetation indices, moisture indices, and topographic elevation (soil samples and yield maps downloadable from machinery will be implemented in upcoming iterations). There’s a possibility to adjust the weight (importance) of every parameter for an algorithm and visually tweak the opacity for the convenience of visual exploration for variable rate planting.
Such maps can be used not only for VRA seeding but also for the VRA input application. For example, by adding the elevation layer to NDVI and NDMI layers, and then putting application based on high/low terrain places you can avoid fertilizer runoff.
As you can see, precision planting variable rate and/or input distribution can be applied after conducting Zones identification in a software platform like EOSDA Crop Monitoring. Dividing the field by Zones is highly flexible: you can make the Zones based on Productivity Maps or go for Multilayer Maps that include a whole bunch of parameters. When you’re confident about what you want to do on each Zone, just specify the Unit Of Measurement per hectare/acre rate and download the output as a file. Then, by uploading this file into farming equipment, you automate the variable rate planting prescription according to these specifications. As a result, precision agriculture becomes simple and handy. Moreover, agricultural production becomes more cost-efficient due to the optimization of expenses on seeds and inputs.
Future-Proofing Yields With Satellite Imagery Analytics
Variable rate planting has been proven to be a more effective solution than the traditional unified approach because multiple local properties of the land and climate are never the same. In fact, soil properties might have variable characteristics even within the same field, depending on the terrain, agrochemical conditions, and other important factors. Seed germination, crop development, and yield potential are also variable. To optimize the yields, the EOSDA’s scientists have found that producers need to adjust the optimal number of plants per unit area, which corresponds to the unique characteristics observed in every field area unit.
Every agricultural enterprise needs to be cost-effective, so variable rate seeding helps to save on fertilizers, pest control, and weed elimination.
Additionally, preliminary analysis for precision planting variable rate including space imagery analytics has been found to be potentially more accurate than conventional ground-based methods, as it takes into account the multi-year dynamics of a large array of data, minimizing the mistakes made as a result of the lack of data.
In European practice, the investments into variable rate seeding machinery return within the first year on average when it is used on 400 hectares of arable land, and the average benefit is about €100 per hectare. By predicting the ROI over a certain period of time, we concluded that variable rate seeding is efficient when the size of the farm is at least 150 hectares on average. At the same time, there is a fairly high variability of economic indicators depending on the cultivated crop, soil characteristics, remote sensing data, and, most importantly, additional analytics.
Ways To Begin Variable Rate Seeding
To sum up, satellite imagery gives a valuable pool of data that can be used for predictive analytics in variable rate seeding with precision planting. It can be used on a basic level by analyzing vegetation indices or on an advanced level by performing a thorough scientific analysis of a particular location. When it comes down to details, data scientists can formulate a comprehensive assessment of soil parameters, as well as growth and development factors of certain crops. The more data is available, the faster they can improve the analysis methods to find the best solution and develop practical recommendations for variable rate seeding. The seeding rates based on individual research can be transferred via computer files and accessed on computers and farming machinery. By applying precision planting variable rate this way, producers can minimize expenses while optimizing harvest yields and preserving soil health.
Discover the benefits of variable rate seeding by creating a free account in EOSDA Crop Monitoring. Observe your field(s) from space with the help of multispectral sensors to catch more than the human eye can see. Ready to go further? Feel free to contact us via sales@eosda.com and order a custom solution including participation of our science team.
About the author:
Karolina is currently pursuing a BSc at Pennsylvania State University. She excels in communicating the scientific value of EOSDA precision and sustainable solutions in an easy-to-read way. Karolina is a dedicated advocate for personal empowerment striving to represent and uplift Ukrainian women in the global STEM community. She’s a member of AWIS, WIT and other organizations.

Detect crop risks earlier with AI-powered field alerts.
More news
Grid Soil Sampling & Its Role In Precision Agriculture
Grid soil sampling is nothing new, but satellites make it easier and cheaper: improve pre-sampling planning, help collect probes efficiently, and combine the results with other soil and crop data.
Yield Monitoring And Mapping In Precision Farming
Why do two neighboring field areas produce such different results? Yield monitoring and mapping help explain why inputs go to waste in some areas and how to manage them more efficiently.
Variable Rate Irrigation Technology And Its Benefits
Variable rate irrigation systems are becoming more affordable and user-friendly. Learn how to get the practical benefits of the technology beyond just water conservation.