
The full potential of precision agriculture is continually harnessed through ever-developing EOSDA Crop Monitoring, which introduces new features on a regular basis. As the second quarter of 2023 has come to a close, we would like to share our significant progress over the past three months. Check out our quick update on the latest highly demanded features that are already implemented on the platform.
Scout Coordinates
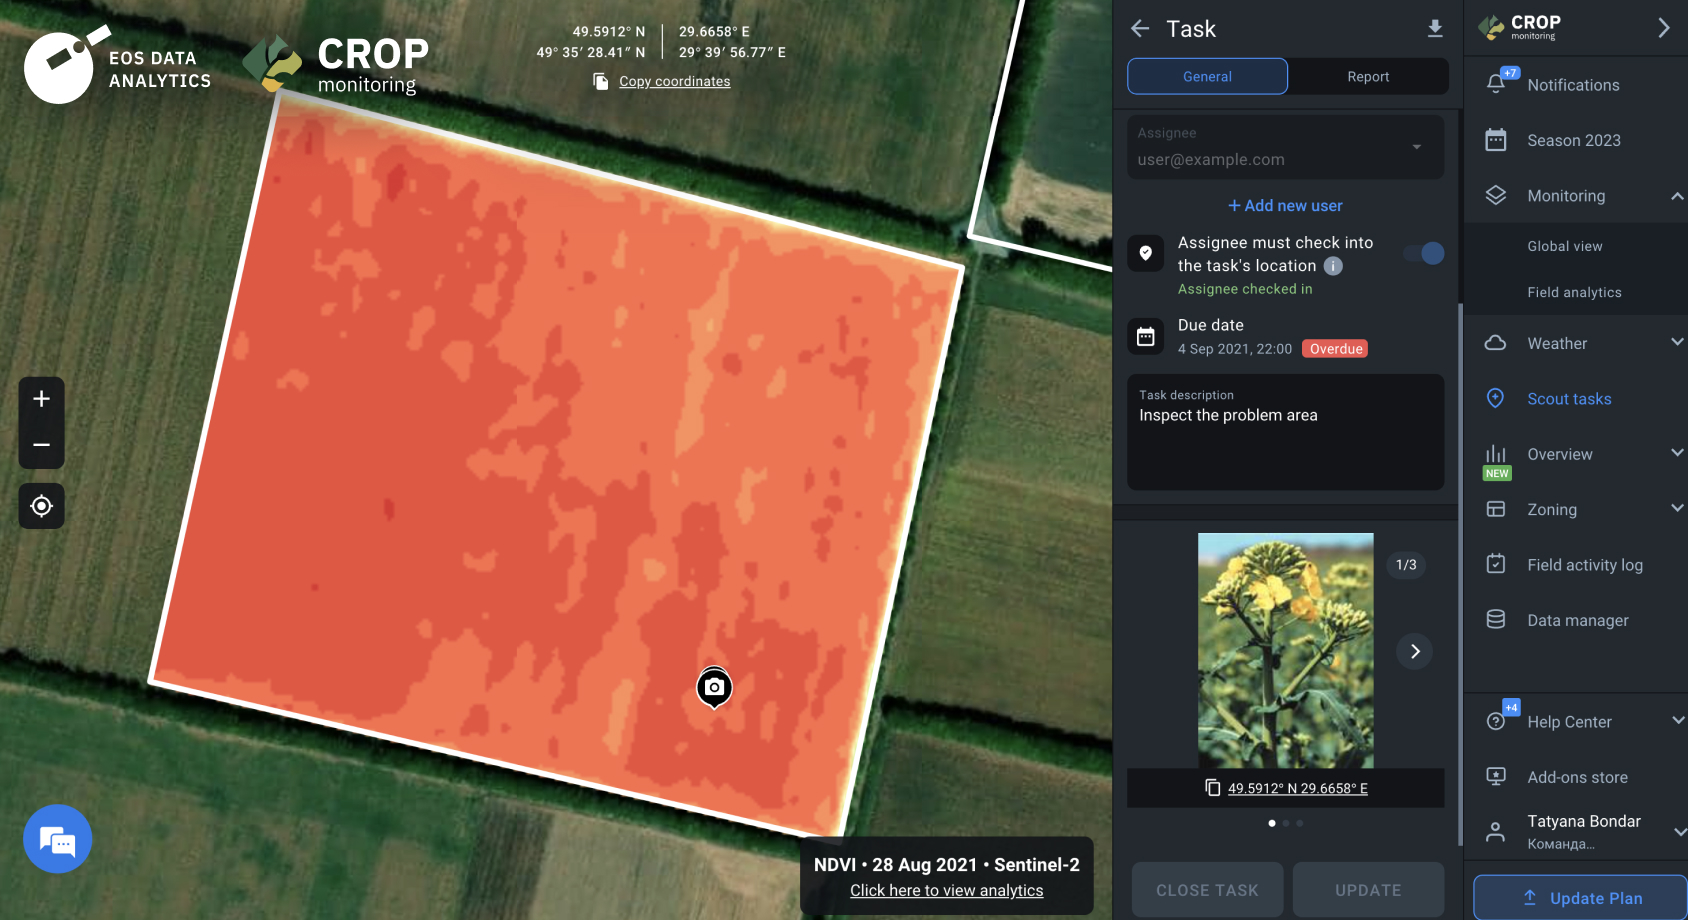
To enrich remote sensing data with insights from on-the-ground measurements, we enabled viewing photo coordinates in Scouting Tasks. Users who are responsible for managing those tasks can copy the geolocation to use it on a map and check the actual place on the field where the photo was taken, which makes it easier to ensure that the task’s objective was completed correctly and follow through with appropriate action. The coordinates are displayed in the photo preview as well as the full-view image.
What’s New Tab In Menu
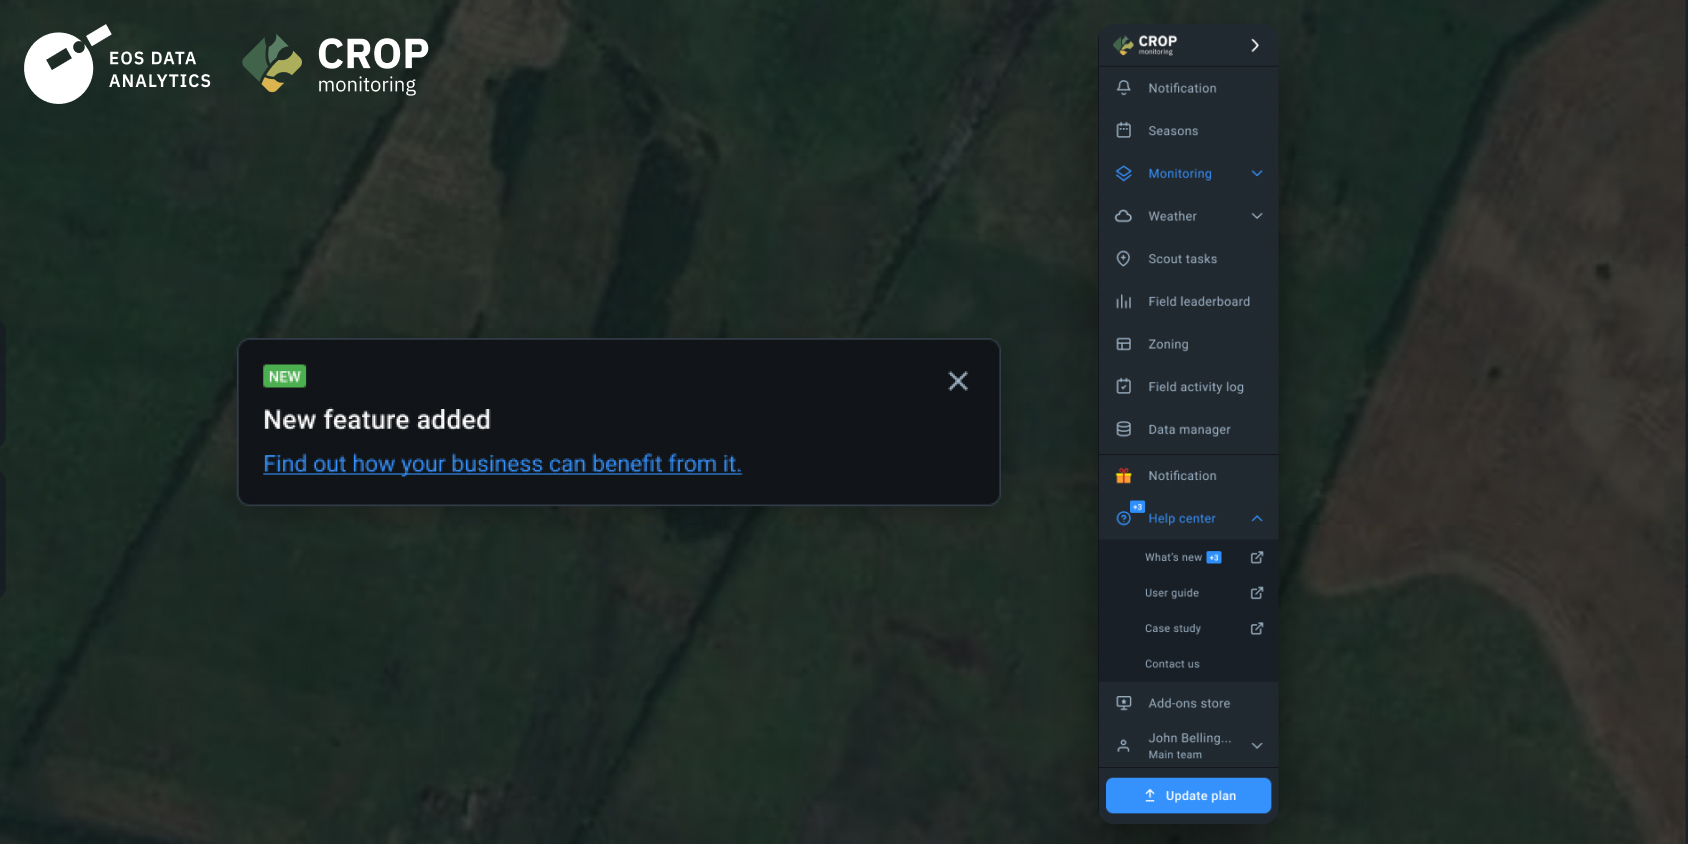
With the ‘What’s New’ tab, users can easily keep up with the latest EOSDA Crop Monitoring product updates. Notifications about updates become available right after new functionality is released, so that users can easily find those updates, learn how to use the new functionality for business, and what are the benefits.
The following elements have been added to our crop monitoring system interface:
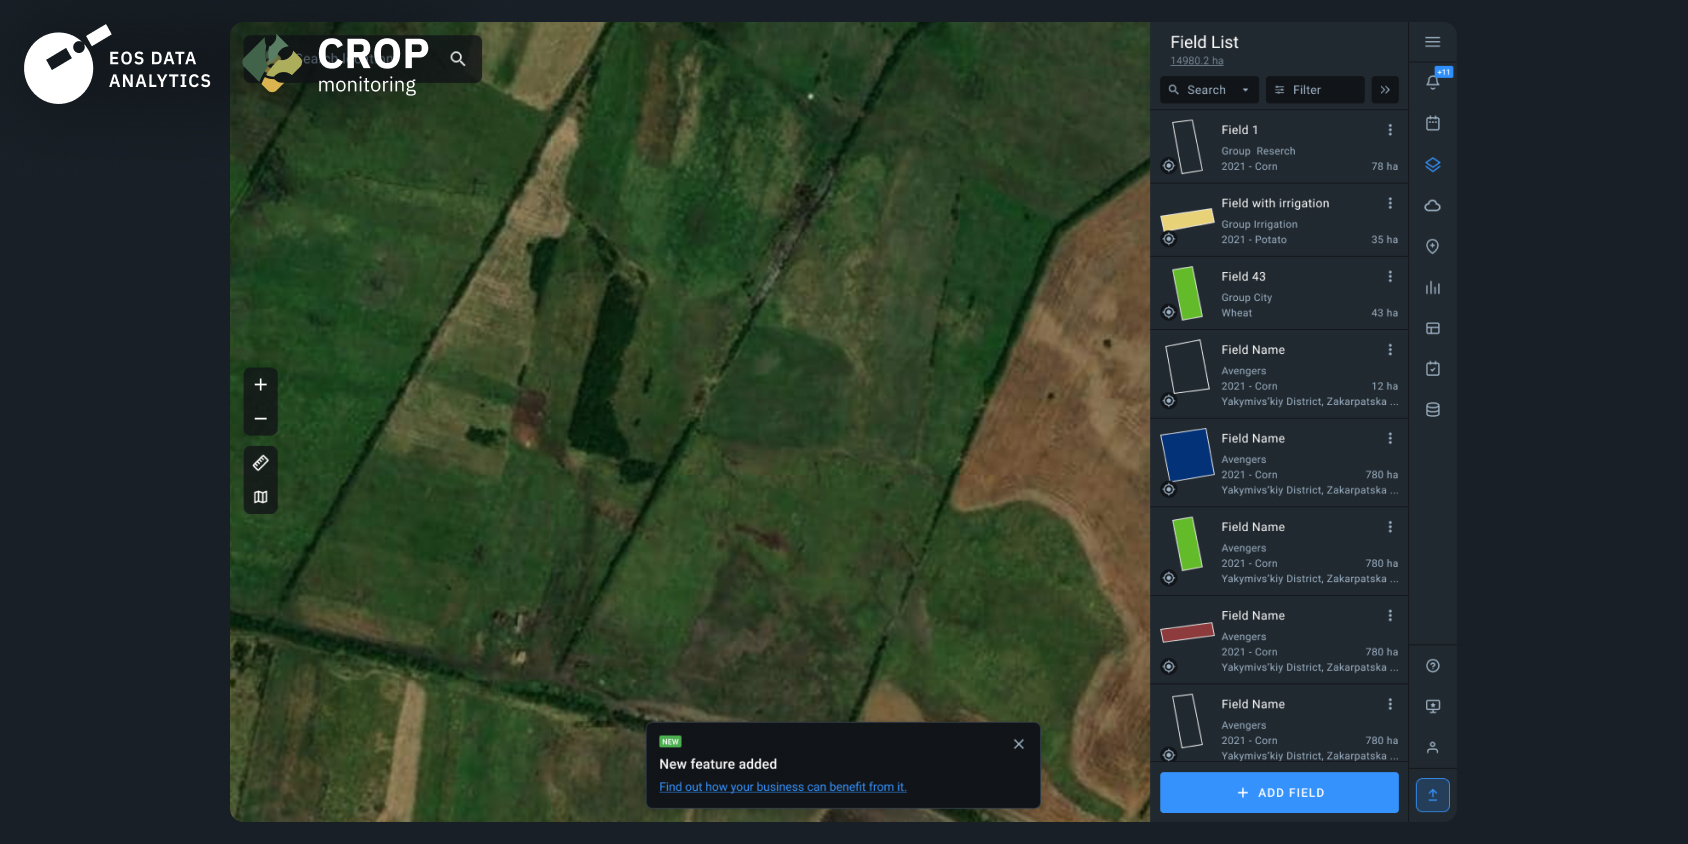
Global Filter By Season Aka Seasonality
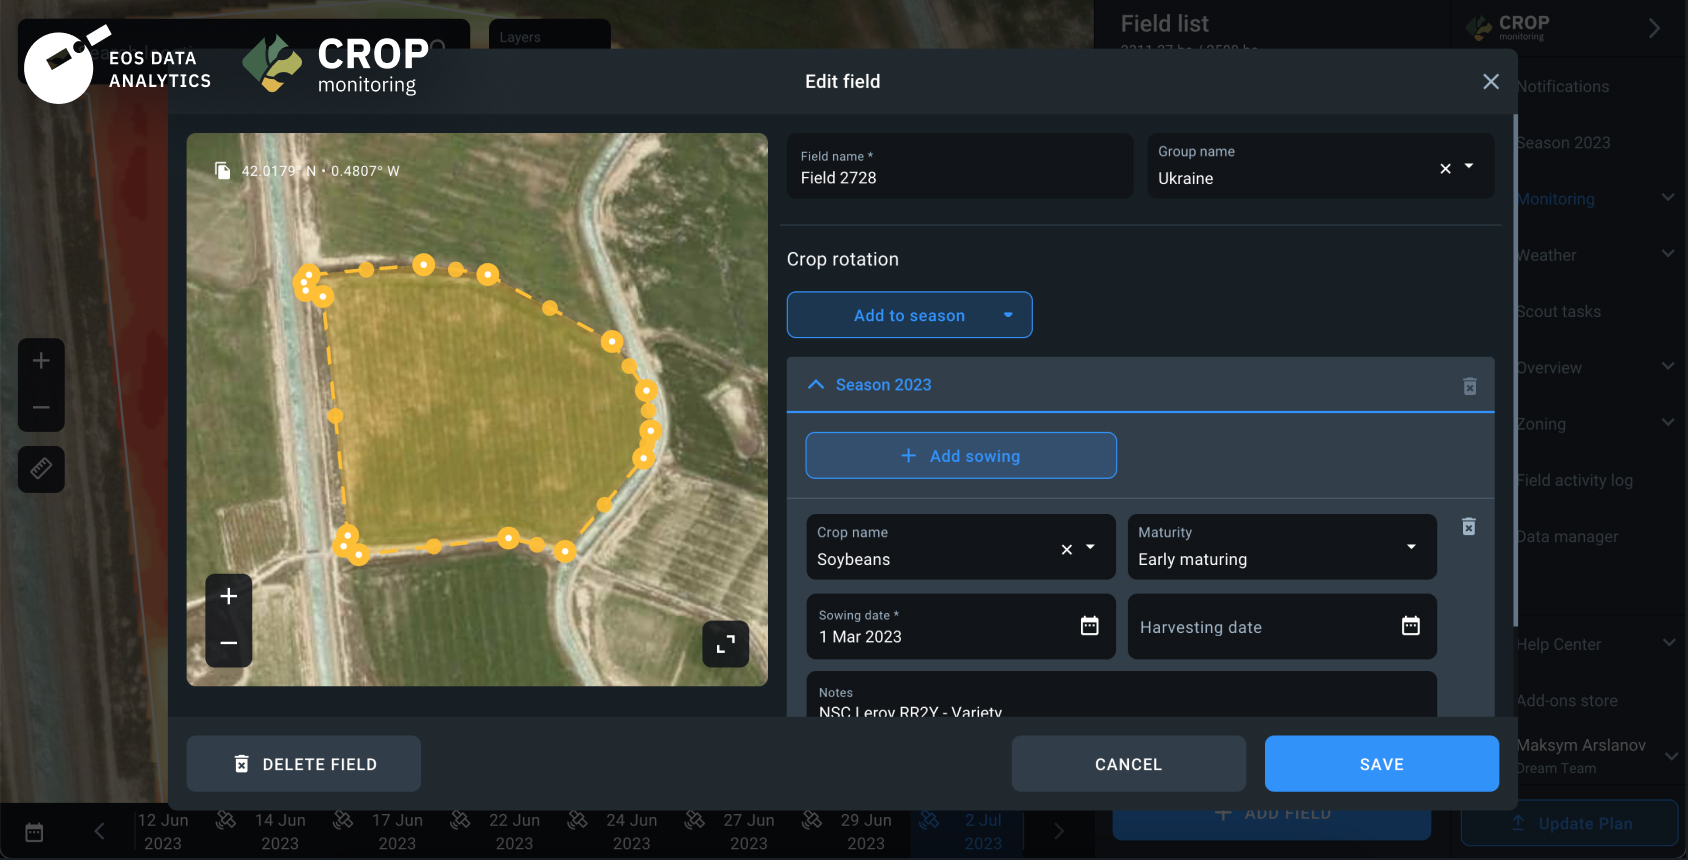
To manage agricultural practices considering the seasonality of crops in particular climate conditions, users can now create and edit Seasons.
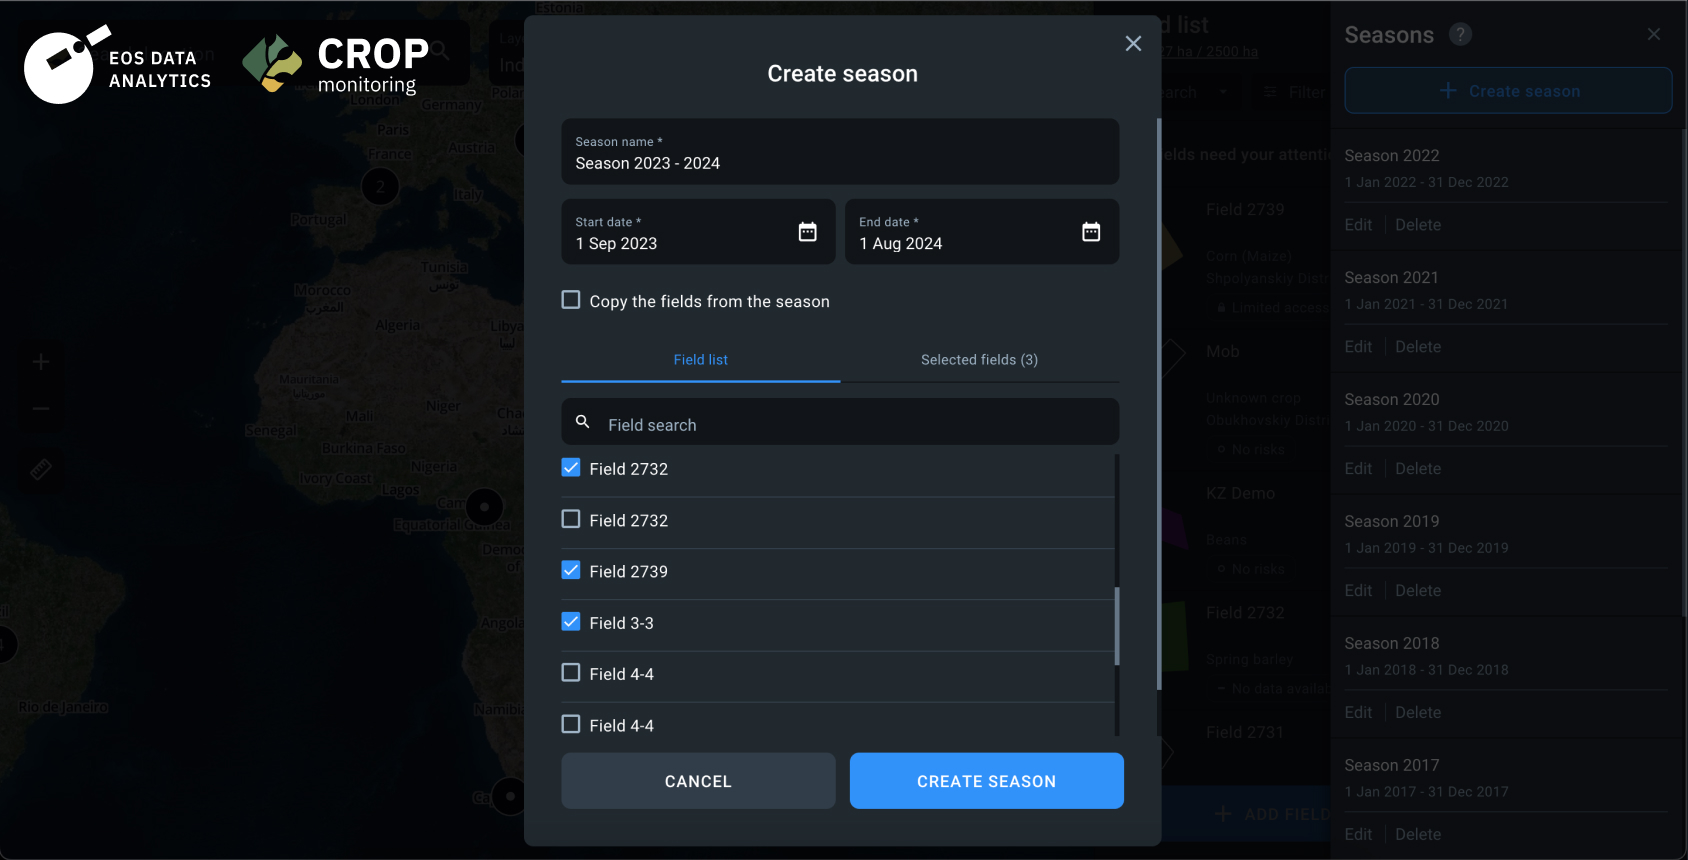
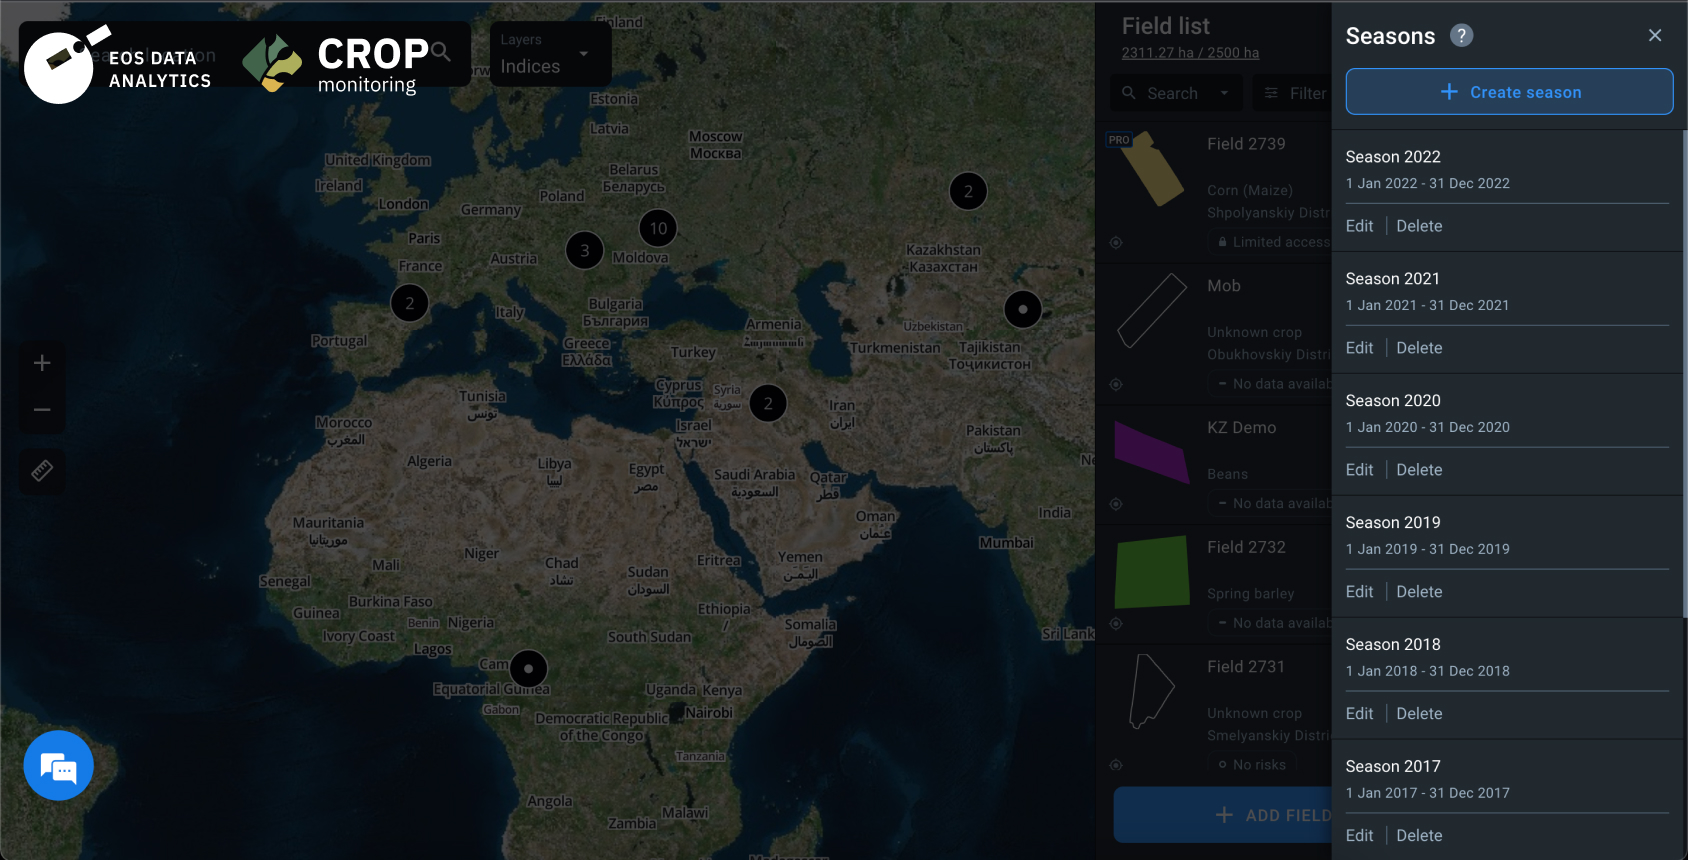
Once a user creates a Season, they will be able to see and manage it from the sidebar Menu. The Season will include the fields to monitor that the user will add or copy from the previous Season. Every Season is like a one-stop-shop for field management activities – users will be able to set up the sowing and harvesting dates for every crop type, perform crop rotation, adjust input usage, and more.
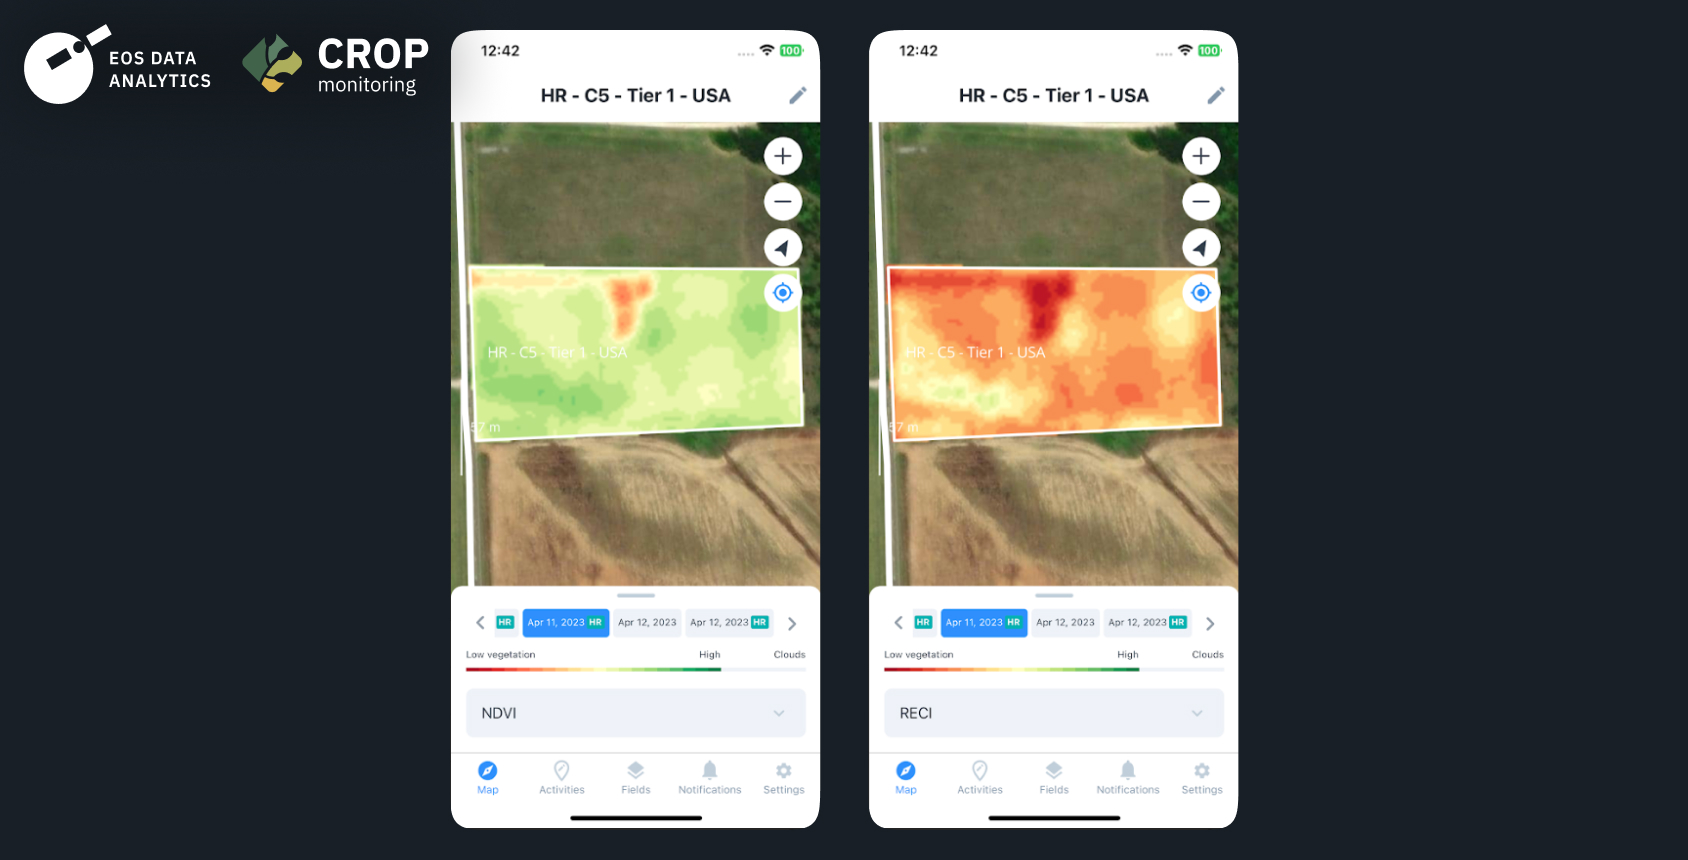
High-Resolution Imagery In The Mobile App
For users who have subscribed to high-resolution imagery, it is now available in a mobile app of EOSDA Crop Monitoring for diving into remote sensing data on the go. Field management activities can be conducted with higher precision once users obtain the data from high-resolution satellite imagery for agriculture, thereby enhancing the positive outcome of their agricultural operations.
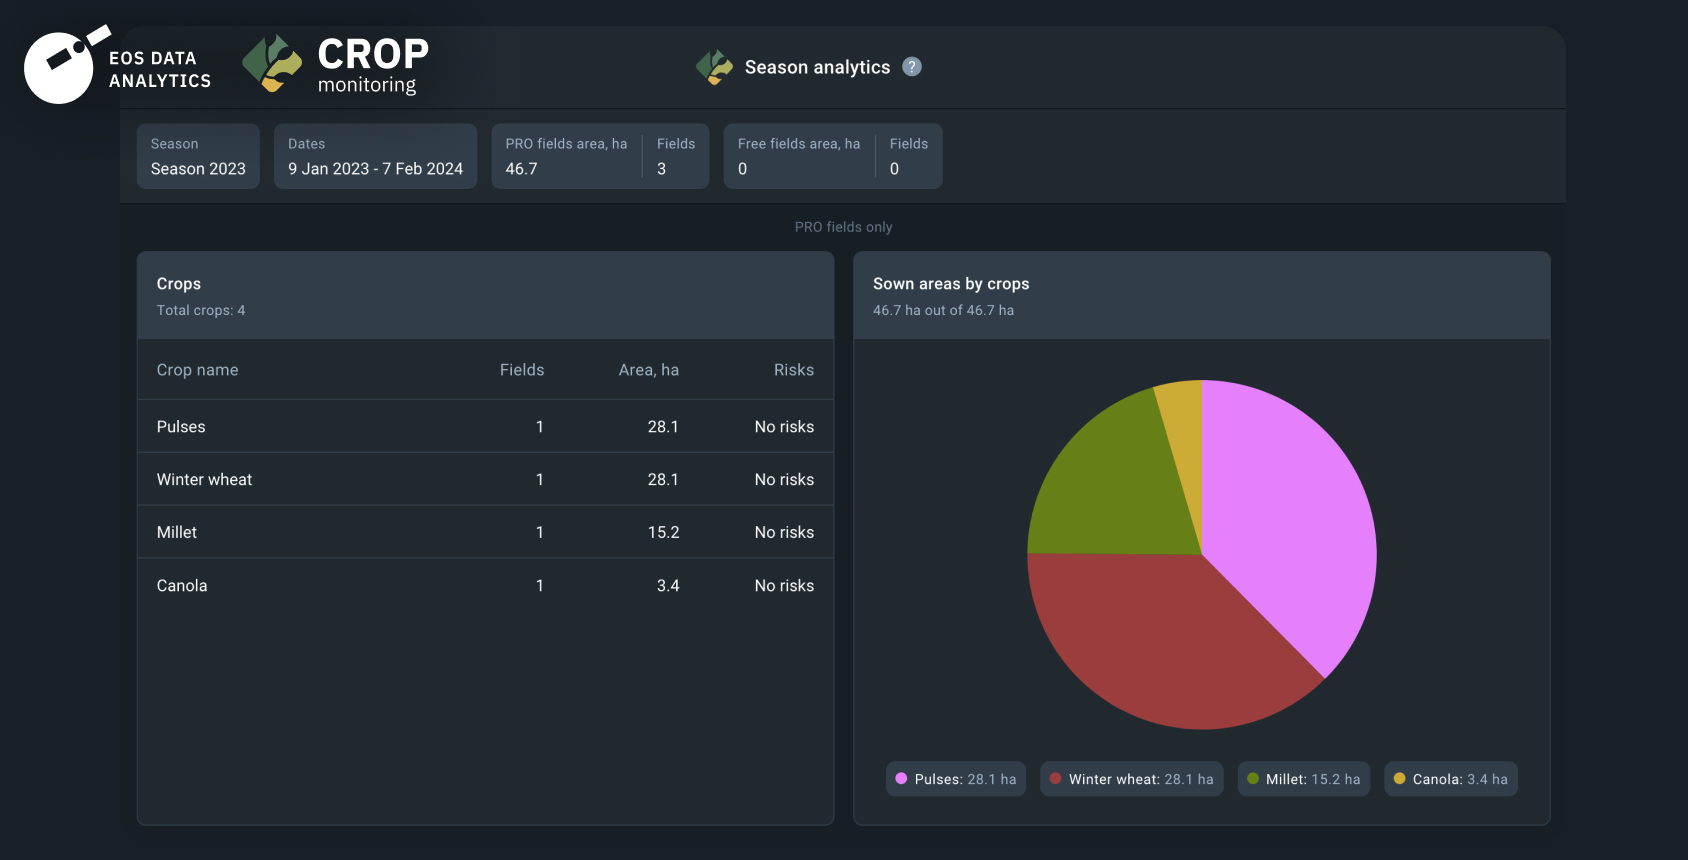
Season Analytics
To enable efficient agricultural analysis, our new section Season Analytics in the Menu allows users to see the overall crop statistics of the season by the number of operations in the field and by crop area.
Upon expanding the window, a dashboard with widgets will display the summary information about the Season. This will enhance the ability to analyze the vegetation of the crop for all fields from season to season, especially for users who have to monitor multiple fields.
Some of the values that will be aggregated for analytics in future iterations are as follows:
- Distribution of sown areas by season
- Overview of critical vegetation changes by crop
- Summary of field activities’ progress by crop
- Crop growth curve for crops of interest
- Peak vegetation index values in the fields
- Fields with the best and worst crop performance by vegetation index
We value your contribution and feedback. If you have any suggestions, queries, or comments about EOSDA Crop Monitoring, please do not hesitate to contact us using our contact form. Our platform keeps growing and evolving with the needs of our users, so we would like to hear your experiences, as these help us progress forward and make precision agriculture more approachable.
About the author:
Rim Elijah holds a double degree in business administration and political science from Stockholm University. As a VP of Sales at EOSDA, she oversees all aspects of business model development and implementation and the growth of the company’s global coverage. She has successfully established a number of strategic partnerships with an emphasis on sustainable solutions in Africa and Asia.
Detect crop risks earlier with AI-powered field alerts.
More news
Mask, Layer, And Indices: New In EOSDA Crop Monitoring
Explore the new features added to EOSDA Crop Monitoring in Q3 2024: cloud/shadow mask management, Planet data integration, new indices, activity recommendations, and mustard growth stages.
EOSDA Crop Monitoring Adds John Deere Data Integration
EOSDA Crop Monitoring users can add their John Deere data to the platform for automated data transfer and optimized VRA mapping capabilities.
EOSDA Crop Monitoring: Map Builder Feature Rolled Out
EOSDA Crop Monitoring users can now leverage their machinery’s yield data to optimize input use and crop performance with the VRA mapping capabilities of the Map Builder feature.