The EOSDA LandViewer is one of the most demanded platforms for Earth Observation in the EOS Data Analytics toolbox. It is also one of the first products that we started developing back in 2016 and now see it thriving like proud parents of a wonder child.
We spoke to Viktoriia Troian, Product Manager at EOS Data Analytics and inspirational leader behind EOSDA LandViewer, to find out about her vision and roadmap to further success.
What Is EOSDA LandViewer In 2023?
EOSDA LandViewer is a real-time satellite imagery analytics and observation tool that offers free medium-resolution and paid high-resolution satellite images from multiple providers. The service allows for on-the-fly searching, visualizing, and processing of data by applying more than 20 indices and band presets available on the platform, conducting time series analysis, and extracting insights from satellite data to tackle real business tasks and challenges from various verticals.
The software allows users to get free access to medium-resolution satellite images (10 free images per day) and, thus, serves as a catalog of satellite imagery obtained from multiple data sources. Users can also purchase high and very high-resolution imagery (up to 0.4 m per pixel).
Images of any designated region worldwide are easily searchable in the EOSDA LandViewer account. Simply put, it’s like a Google for satellite imagery! You can retrieve remote sensing data, analyze chosen locations by using built-in tools, and conveniently download the output visuals, saving both time and device storage capacity.
You can effortlessly identify changes by contrasting several photographs of the same area of interest, captured by various satellites at distinct dates and times throughout the day. Utilize a split-screen view and chronological analysis, then showcase the outcomes as a time-lapse animation. Besides standard indices, users can develop personalized ones by experimenting with diverse combinations of spectral bands.
What Was Your Vision Of The Product Roadmap When Launching EOSDA LandViewer?
Initially, we positioned EOSDA LandViewer as a geospatial data processing platform. In simpler words, some kind of analog of QGIS and ArcGIS, but a lightweight in-browser solution where all the hard data processing job is done on our end while a user doesn’t have to worry about having a super-powerful machine and downloading cumbersome software.
We started in 2016 by developing a few main features that have been the core of our product ever since: that is viewing satellite images, doing some analytics on top (from the start – just applying bands), and downloading the results or sharing them via WMS. The target audience was cartographers, GIS specialists, analysts, managers, scientists, and developers.
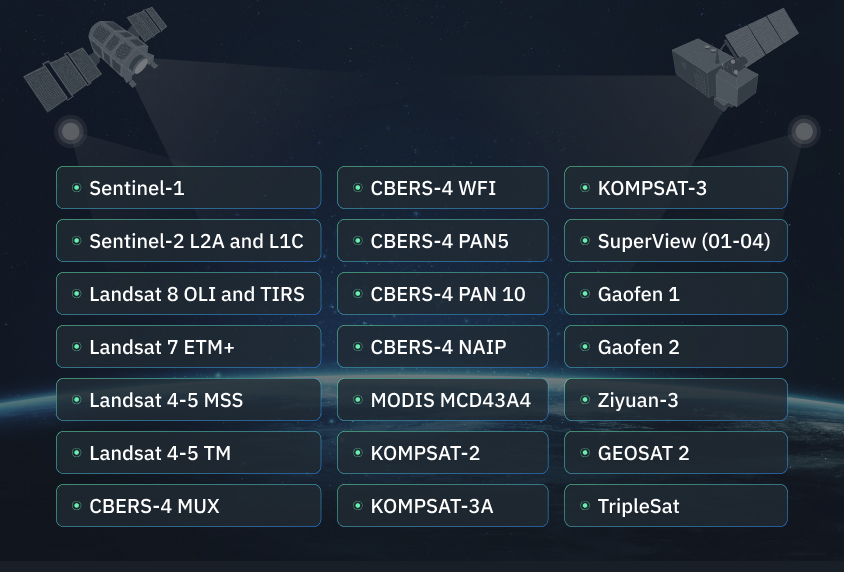
In the very first iteration of the product, users had an opportunity to view satellite images from different Landsat missions (the original name was actually LandsatViewer and changed when we decided to add different sensors).
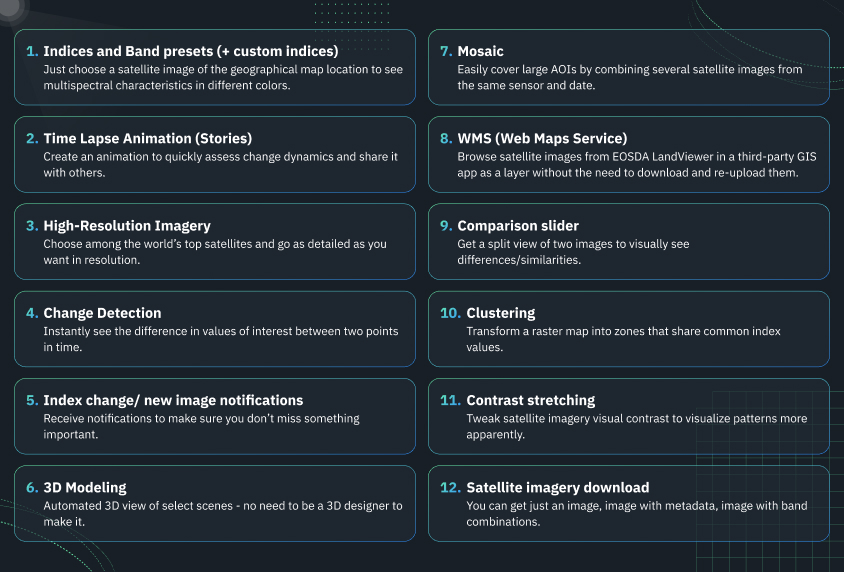
During 2017, we added more sensors, namely Sentinel 2, NAIP, CBERS, MODIS data, and satellite filters by dates, cloudiness, sun elevation, and AOI coverage. We also developed 3D Modelling and Contrast Stretching.
In 2018-2019, we added Mosaic, Time series analysis, notifications about Index changes and new scenes for AOI, and Time-lapse animation. Another important direction of product development since 2019 was adding a range of high-resolution imagery providers to the platform. In 2020, we continued developing high-resolution and added Change detection and Clustering functions.
We created EOSDA LandViewer as software that would allow users from different areas of expertise to participate in a profitable and mutually beneficial exchange of satellite imagery, solving real-world business problems. Here you can buy images with a level of detail suitable for professional use in most industries: agriculture, forestry, alternative energy, IT & software, environmental monitoring, research, and more.
The positioning of the product stays in line with our initial roadmap, yet we are continuously working on widening the audience and business verticals by introducing new features and adding new satellite data sources.
Sounds Amazing! Can You Give Us Examples Of Some Widely Used EOSDA LandViewer Features?
Right now, we are seeing positive dynamics in most of our newly introduced features. We are continuously working on making the interface as intuitive and straightforward as possible to help our users with deriving data-driven analytical conclusions. These features don’t require much of a learning curve. On the contrary, we are processing vast amounts of data in the backend and boiling it down to handy visual representation on the frontend.
How Can Businesses Benefit From These Solutions In The Product?
The EOSDA LandViewer features are suitable for numerous use cases across many industries. Describing them all would take me hours, so let’s highlight some major trends. We’ve been seeing a lot of continuously active users from agriculture which is understandable because multispectral imagery allows agribusinesses to perform crop monitoring by detecting crop health, stress, and growth patterns, as well as assess the land’s overall productivity. Some of them also drill down to more specific uses of our functionality, such as irrigation management.
Another common cluster of use cases is dealing with infrastructures. When something like a construction site or a gas pipe stretches across a certain territory, of course, you want to be able to remotely observe your area of interest for risk mitigation, quality assurance, land use planning, and environmental monitoring.
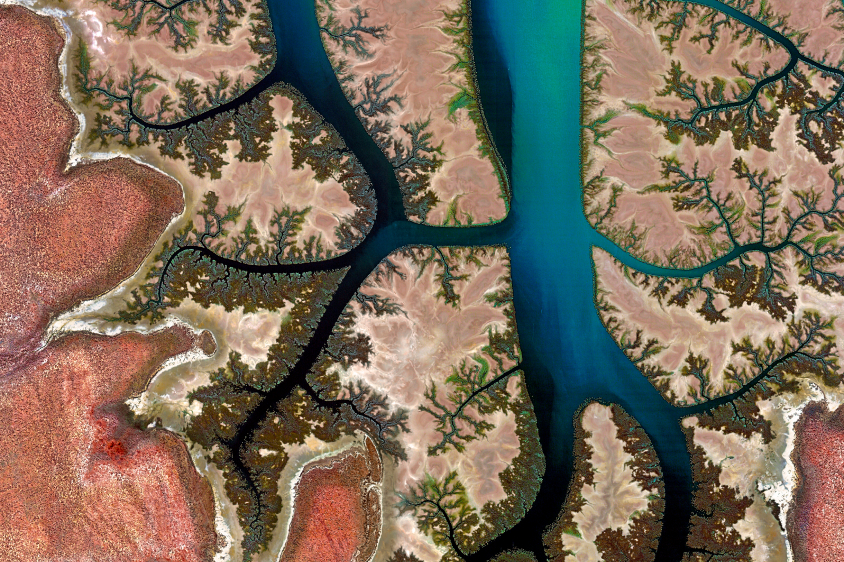
Also, satellite imagery analytics has elevated climate change awareness to a whole new level. For example, forestry organizations have been using EOSDA LandViewer for monitoring and management of forest ecosystems. Water bodies can be monitored as well. Oceanography experts conduct analysis of coastal zones and coral reefs to assess and analyze water temperature, salinity, phytoplankton, hydrology, changes in coastline, bathymetry, ice cover changes as well as potential threats to shores.
What Are The Benefits Of EOSDA LandViewer For Individual Users And Research Groups?
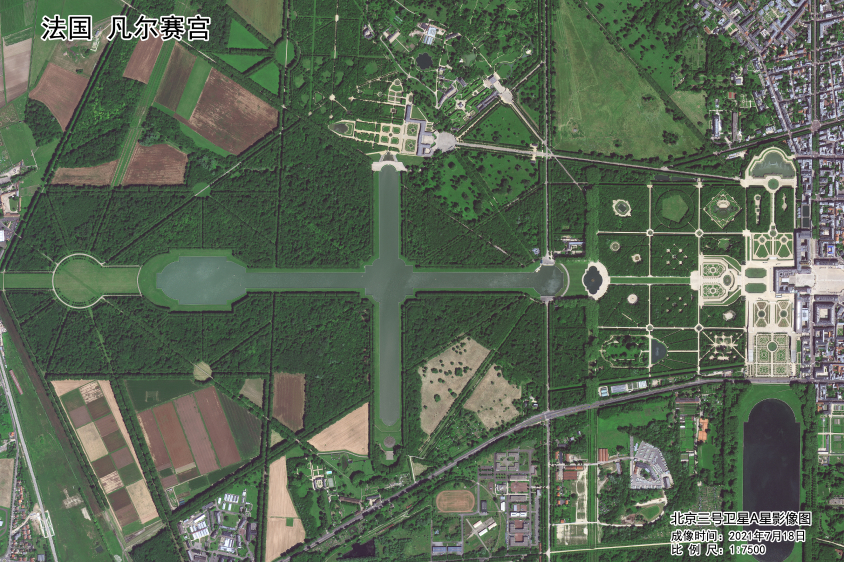
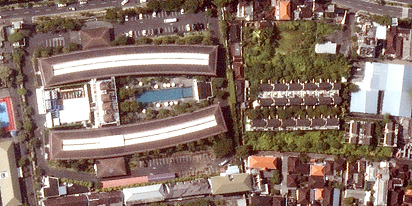
There are lots of ways to use EOSDA LandViewer even if you do not run any land-related business. For example, individual users can remotely monitor their property or choose real estate property for acquisition. High-resolution satellite imagery allows them to distinguish and identify small objects such as individual cars, houses, or trees.
At the same time, they can be exploring the world: EOSDA LandViewer provides access to satellite imagery from various sources, which is handy when choosing a travel destination, planning a road trip, or outdoor activities.
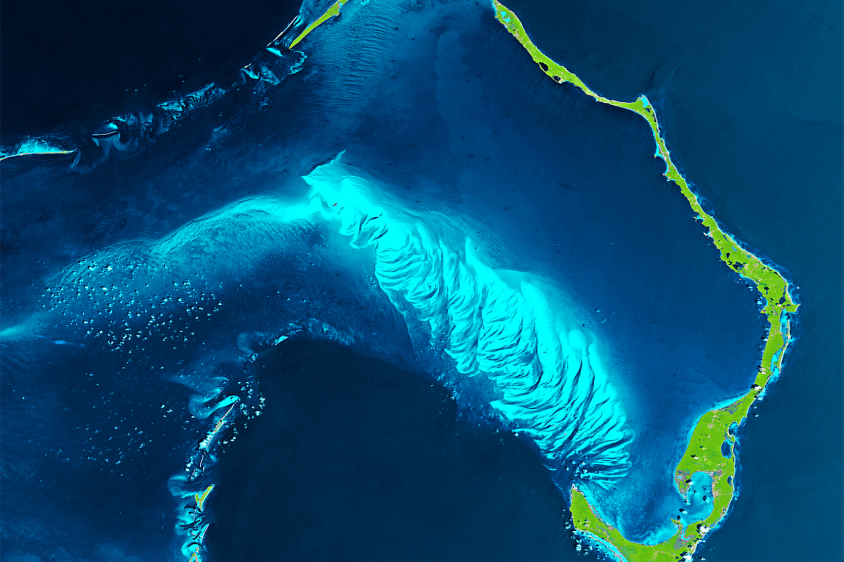
Frankly, it is easy to spend lots of time just gazing at the magnificence of our planet Earth. Our satellite images and animations are being used as a source of artistic inspiration as well as promo and marketing materials. Due to the fact that they provide information about the current state of the land, cities, and water bodies, satellite images also serve as a valuable reference for educating people on the effects of climate change.
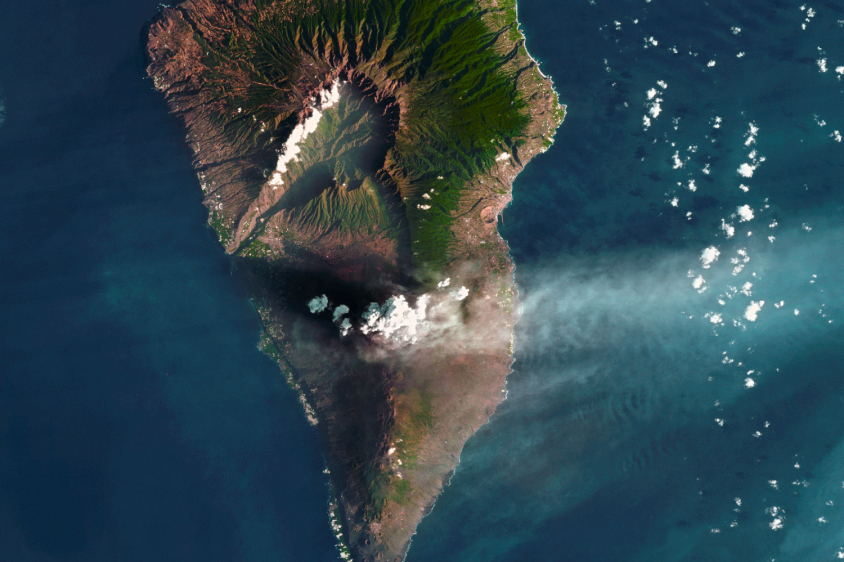
On a more practical level, communities can use EOSDA LandViewer to foresee natural disasters and assess the scope of the damage. For instance, this year has seen almost 600 reported tornadoes in the US so far . That’s why we’ve made EOSDA LandViewer available and easy to use for everyone who needs to access reliable and timely data on the land imagery from above.
EOSDA LandViewer is also a powerful tool for independent scientists and GIS researchers. Satellite images can be used to create detailed maps of the Earth’s surface, including information on land use, vegetation, water resources, and other important features. GIS specialists and researchers can use these maps to conduct spatial analysis and explore relationships between different variables. By the way, we offer free access to a full range of EOSDA LandViewer features to students and researchers as part of our EOS Data Analytics Academic Outreach Program.
The software allows researchers to share their work with others, which can be useful for collaboration and knowledge-sharing. GIS specialists and researchers can use this feature to share their findings and collaborate with others in their field.
Can You Name One Most Prominent EOSDA Landviewer User (And Why Do You Believe They’re So)?
The organization that immediately comes to my mind is Greenpeace Andino in Argentina. It uses EOSDA LandViewer to streamline fieldwork and present the general public’s investigation findings in the form of reports, maps, and digital content like time-lapse animations. They share this information with the public via the press and social media. By the way, we conducted a joint webinar with them in 2022, you can check it out on our YouTube channel.
They check every forest zone of their interest for possible daily and monthly changes (e.g., deforestation caused by cattle ranching and crop growing or forest damage due to fire). Specialists compare images captured with different spectral band combinations. Thanks to EOSDA LandViewer, they can respond very rapidly to spotted violations. The team has been using our product for approximately three years.
EOSDA LandViewer Seems To Be Actively Involved In Environmental Projects.
Yes, we also had a participatory project dedicated to mapping the territory of Chad to aid local settlements and indigenous communities in establishing peaceful and sustainable management of shared resources. It was organized by Hindou Oumarou Ibrahim, a member of the Mbororo pastoralist people and founder and president of the Association for Indigenous Women and Peoples of Chad (AFPAT).
Precise mapping supplied by EOSDA LandViewer and our GIS experts effectively helped mitigate the local conflict over limited natural resources between indigenous communities and helped people adapt to climate change.
After we obtained a high-resolution satellite image covering 1,728 square kilometers of land, we created a printable map layout with annotated natural and artificial objects. The project culminated in printing a giant map and sending it to social activists and local authorities in Chad.
The project was actively supported among local communities: the number of participants for mapping objects has quickly soared from 24 to 116 communities. Eventually, they united to construct a special building for storing the printed map. It is very amazing and inspiring to see a product that you care about helping people on another continent!
What Was The Latest Data Source Added To EOSDA LandViewer And Why?
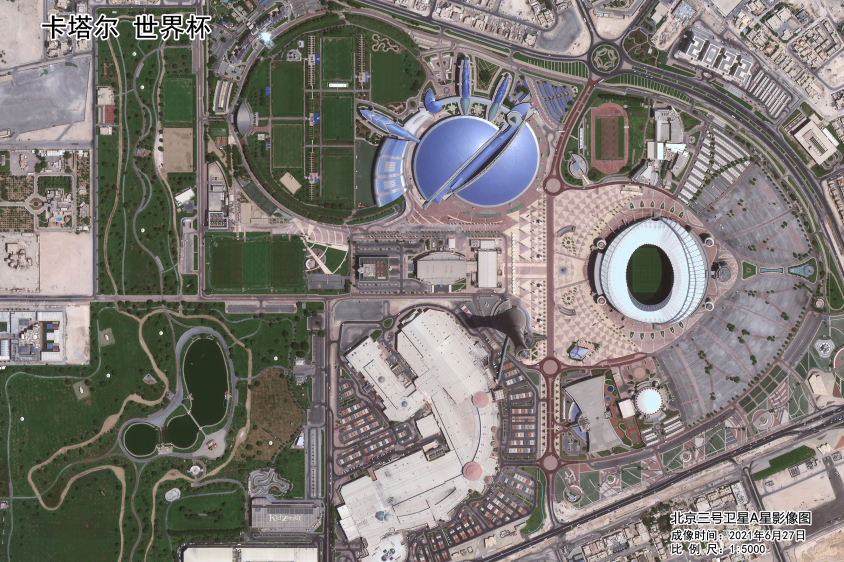
We added imagery from a multispectral optical satellite GEOSAT-2 as part of our continuous effort in adding new high-resolution data sources.
The reason for choosing this satellite is a very high detalization level. Boasting a 75 cm pan-sharpened resolution, GEOSAT-2 captures stunning images of our planet. The EOSDA LandViewer provides easy access to this data, which encompasses the highest-quality imagery for up to 200,000 km2 of land daily while gathering information from the satellite’s panchromatic and multispectral cameras concurrently.
Since its inception in 2014, GEOSAT-2 has accumulated an impressive collection of over half a million images, creating endless possibilities for use in multiple industries. EOSDA LandViewer users can access not only the current but also the historical data from this satellite.
To access GEOSAT-2 imagery, users need to select the “High-resolution imagery (for analytics)” source in Scene Settings. With this option, users can filter the output by date, cloud coverage, sun elevation, and area of interest to obtain the data they require. The platform offers a free image preview feature, allowing users to check the quality of the image before making a purchase.
Now That EOSDA LandViewer Offers Highly Demanded Data Sources And Tons Of Useful Features, How Do You Envision Its Growth?
The main direction of product development will be expanding it as a satellite imagery marketplace by adding new sources of images, with an emphasis on high and very high-resolution images, so we’re having many upcoming integrations in terms of satellite imagery providers.
Some of our highly anticipated integrations include BJ3A and BJ3B, KOMPSAT7 and 7A, SuperView-2, Gaofen 7, and SuperView NEO-1. And of course, we are looking forward to integrating imagery from our own satellite EOS SAT-1 which we launched earlier this year.
Another important update is the possibility of ordering high-resolution tasking (now we only have archive images). In simple words, tasking is an order from an image provider to shoot a specific area at a specific time by a satellite of the client’s choice. This can be a one-time event or an order to shoot with a certain regularity.
Overall, I would say that our vision can be explained as a “Think cosmically, act locally” movement that has been getting more and more popular throughout the world. By introducing new tools for granular Earth Observation that are available to broad audiences, EOSDA LandViewer acts as a driving force for making sustainability not just a far-out philosophical concept, but quite a real, hands-on task.
About the author:
Kateryna Sergieieva has a Ph.D. in information technologies and 15 years of experience in remote sensing. She is a Senior Scientist at EOSDA responsible for developing technologies for satellite monitoring and surface feature change detection. Kateryna is an author of over 60 scientific publications.
More news
How to get a satellite view of my property?
Businesses need independent visual data to protect their investments. In LandViewer, you choose the date and source to get the satellite property photos for logging site damage or build readiness.
LandViewer welcomes BlackSky Gen-3 high-resolution imagery
LandViewer has expanded its high-resolution catalogue with BlackSky Gen-3, offering 0.3 m imagery, up to 15 daily revisits, and AI-powered analytics for detailed analysis and daily site monitoring.
LandViewer integrates Satellogic high-frequency imaging
LandViewer has expanded its high-resolution monitoring options by integrating Satellogic NewSat data. This update provides more frequent revisits and detailed imagery for tracking daily changes.