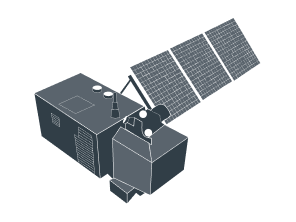
Sentinel-1 imagery: Reliable radar data for your projects
Don’t let clouds and atmospheric disturbances hold you back. With Sentinel-1 imagery on EOSDA LandViewer, you get frequently updated radar views with wide coverage.
-
Spatial resolution
10 m (SM mode), 20 m (IW mode), 100 m (EW mode)
-
Scene size
80 km (SM mode), 250 km (IW mode), 400 km (EW mode)
-
Revisit time
Every 6 days
-
Data archives
From 2014 to the present
-
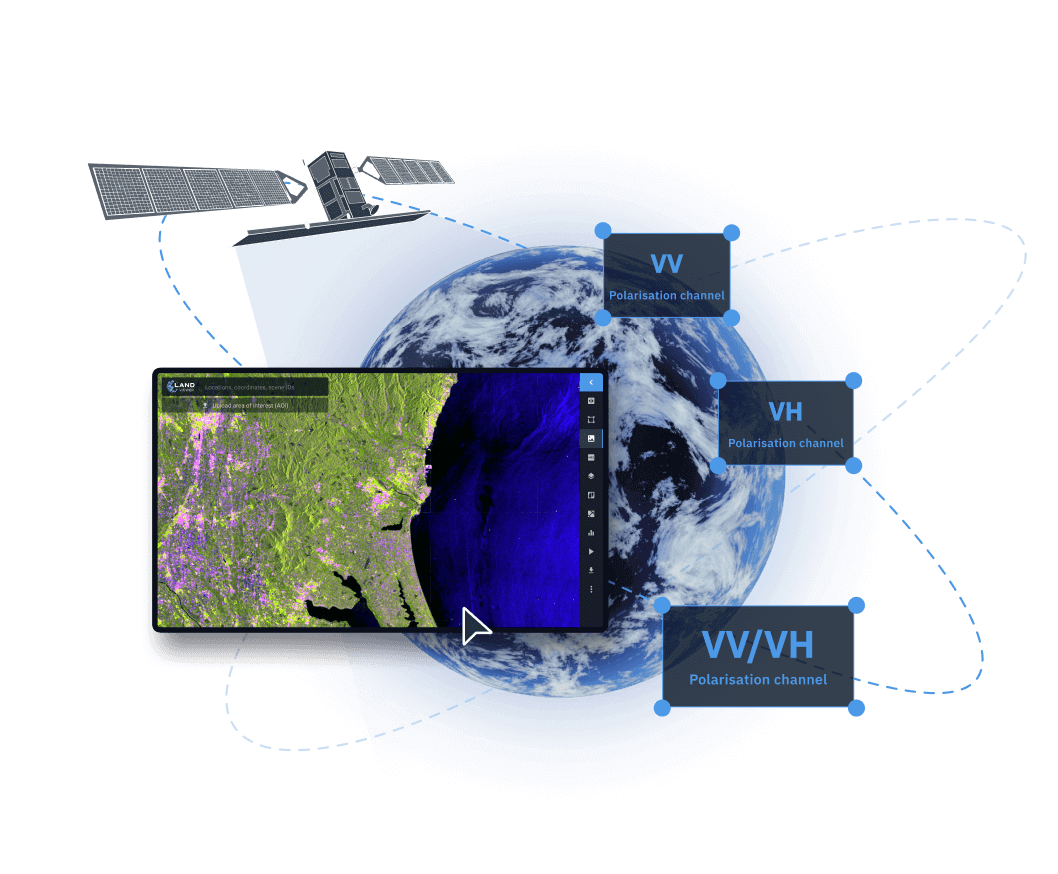
Polarization channels
VV, VH, HH, HV
-
Analytical tools
not available
How to get Sentinel-1 satellite imagery on EOSDA LandViewer
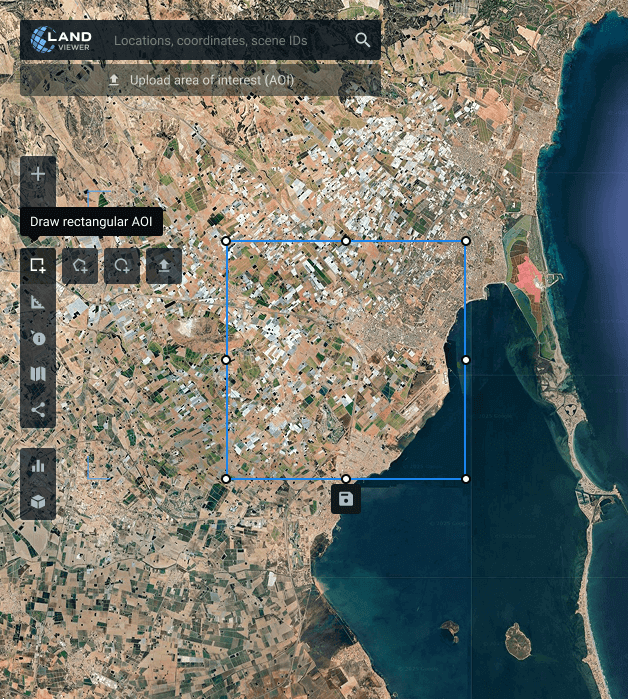
Set your area of interest
Choose the area you want to monitor. You can either search for a place and draw the area of interest (AOI) directly on the Sentinel-1 map or upload an existing file from your device.
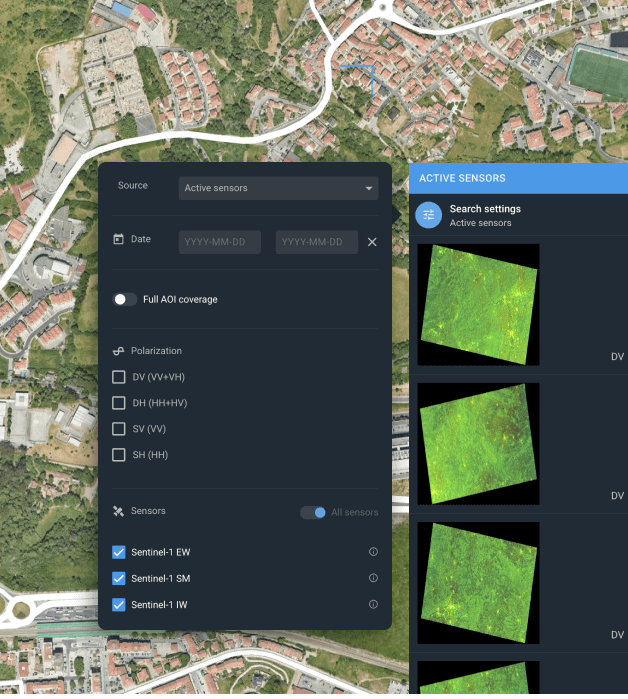
Filter results for better matches
On the filter panel, first switch the Source to Active sensors. Then use filters like date, sensor, polarization, and AOI coverage to quickly find the Sentinel-1 imagery you need.
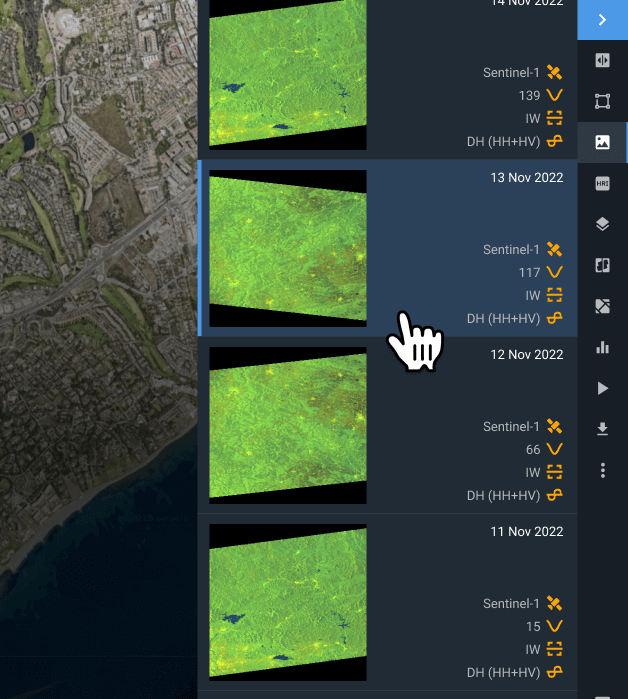
Pick the most suitable scene
Browse through the filtered results and choose the scene that best matches your project needs.
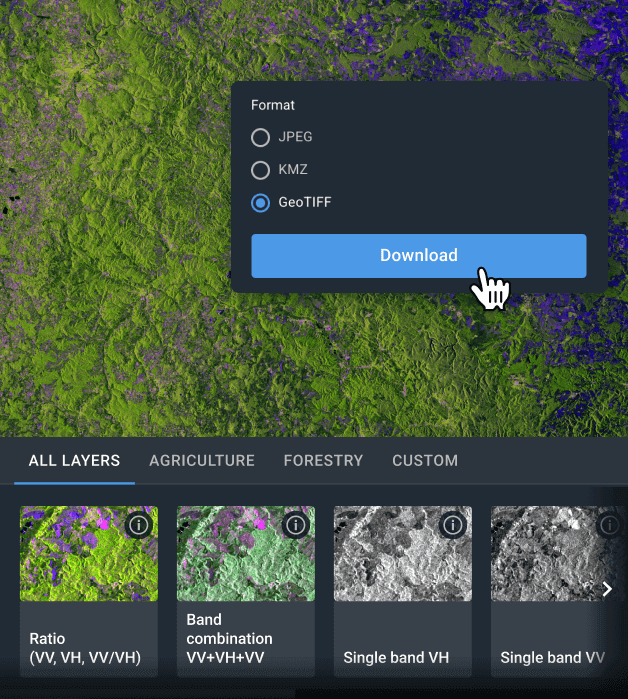
Export or analyze the scene online
Export your chosen Sentinel-1 data in GeoTIFF, KMZ, or JPEG for further work in GIS software (QGIS, ArcGIS, etc.). You can also analyze them directly on EOSDA LandViewer using band combinations.
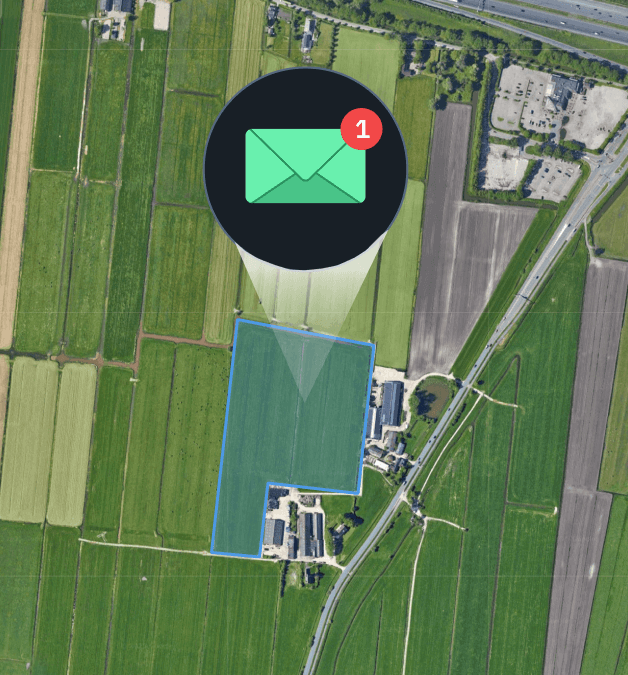
Get automatic updates
Can’t find the right image yet? Set up email notifications and get updated when new Sentinel-1 data becomes available for your area.
Make sense of Sentinel-1 imagery using EOSDA LandViewer
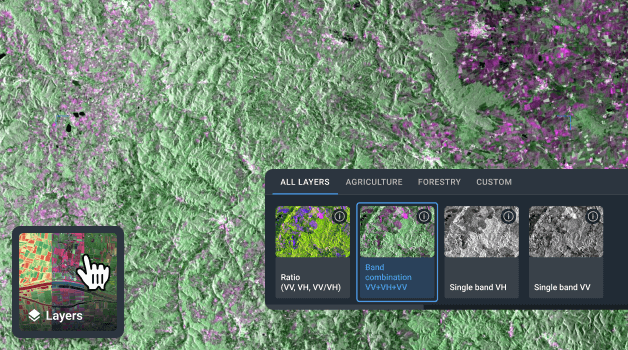
Band combinations
Sentinel-1 radar data on EOSDA LandViewer comes with both single polarization layers and preset band combinations that help distinguish land and water, green cover, and built-up areas. Using band combinations helps solve practical tasks in farming and forestry, as well as infrastructure and environmental monitoring. For more tailored work, there’s also the option to set up custom band combinations.
Practical uses of Sentinel-1 imagery analytics
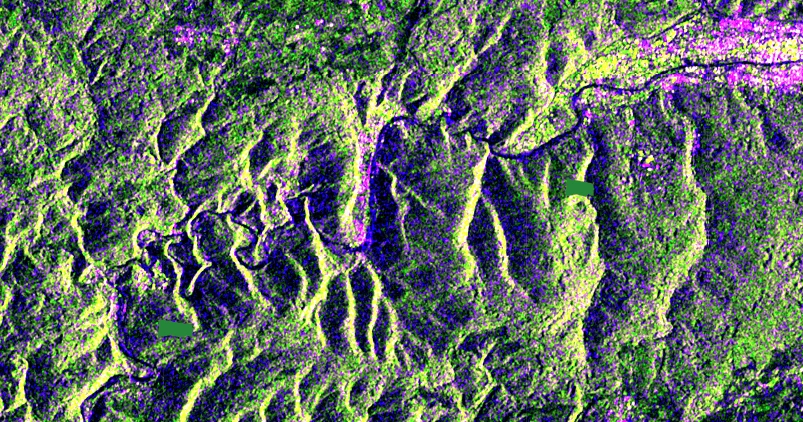
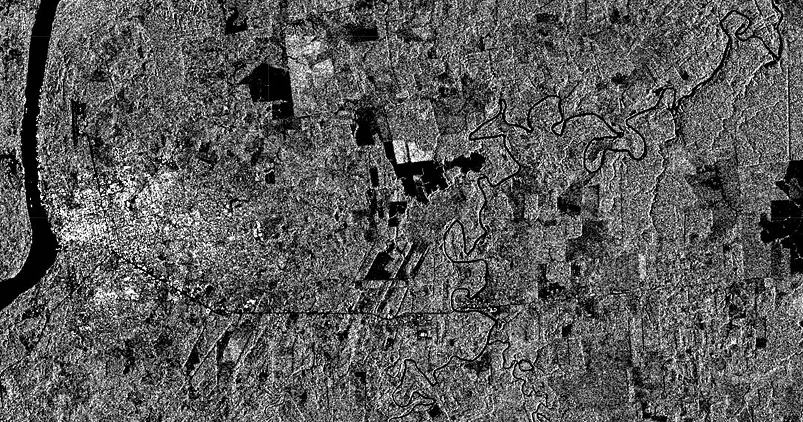
Post-flood analysis
- Ahr Valley, Germany
- Ratio (VV,VH,VV/VH)
- Jul 13, 2021 – Jul 16, 2021
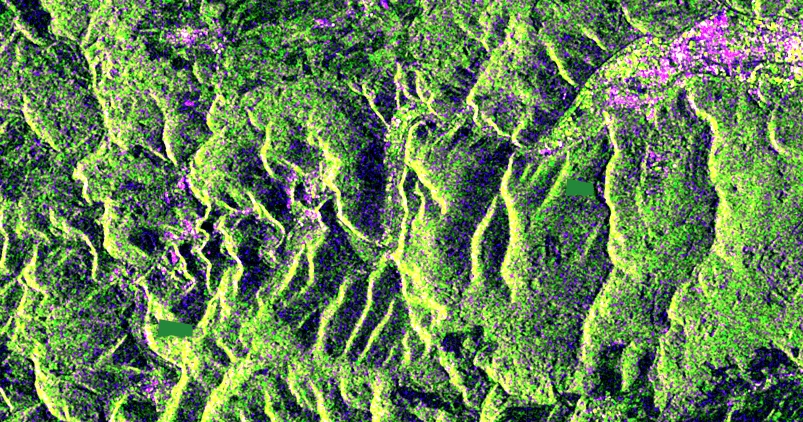
Deforestation monitoring
- Porto Velho, Rondônia, Brazil
- Single band VH
- Feb 15, 2016 – Jan 13 2020
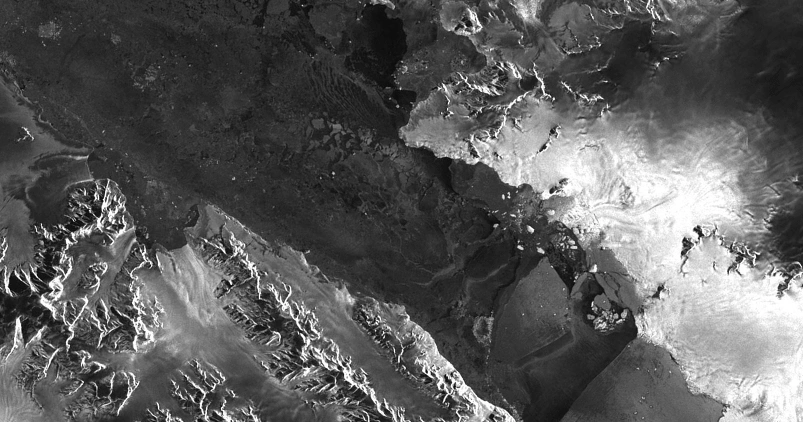

Tracking iceberg calving
- Iceberg A68, Antarctic Peninsula
- Single band HH
- Jul 18, 2017 – Jul 24, 2017
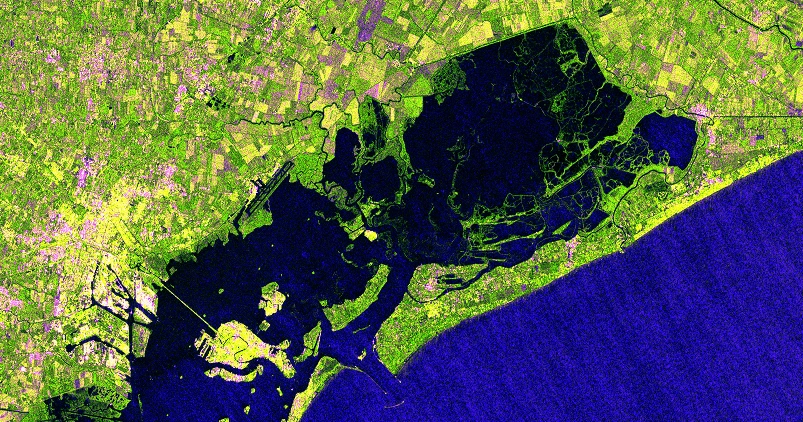
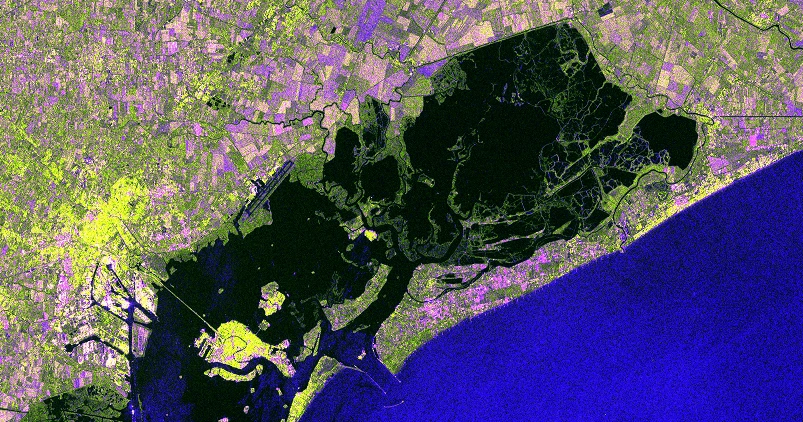
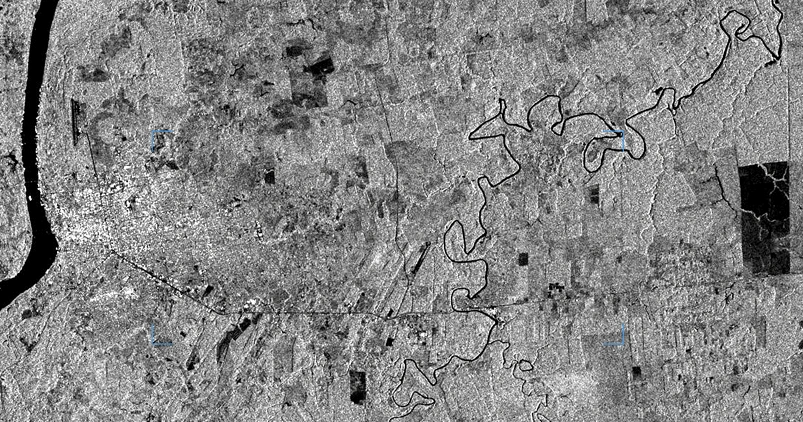
Monitoring coastal urban flooding
- Venice Lagoon, Italy
- Ratio (VV,VH,VV/VH)
- Nov 5, 2019 – Nov 15, 2019