Transition Guide From Sentinel Hub EO Browser To EOSDA LandViewer
Since February 12, 2025, EO Browser’s anonymous access has been disabled, and its complete shutdown is only a matter of time. While two EO Browser alternatives are offered for public and commercial use, neither provides a fully comparable experience and may require additional effort during the transition.
EOSDA LandViewer is a great alternative for those exploring other options. It provides free access without registration, an extensive satellite archive since 1982, high-resolution imagery, and satellite tasking for your specific needs. In the EO Browser alternative, users will also find familiar tools, including built-in indices, band combinations, and time series, along with added features like index customization and clustering for deeper insights.
Why Look Beyond Sentinel Hub EO Browser?
For years, EO Browser was a go-to option for fast, no-hassle satellite image access. But today, it won’t allow usage without signing in, offers only a few datasets, and lacks advanced tools for more serious analysis. Below are key reasons why it might be time to look for EO browser alternatives.
No More Instant Access Without Login
Since 2024, the platform requires all users to log in, even for basic map viewing. Before, many relied on anonymous access for quick satellite Imagery checks, demos, or class use. Now, even a casual glance at vegetation or land change means creating an account, pushing users to explore Sentinel Hub alternatives for forest monitoring, agriculture, and research.
User Issues With The Transition To Copernicus Browser
EO Browser is gradually being replaced by the Copernicus Browser within the new EU data space. Though intended as an EO Browser successor, it currently feels more like a test version. It only includes Sentinel missions, while the alternative datasets are still absent. The layout and navigation also differ, making it harder for long-time EO Browser users to work efficiently.
Limited Datasets Available
EO Browser includes widely used datasets like Sentinel-2, Landsat 8, MODIS, and Copernicus DEMs. But users needing alternative high-resolution or commercial imagery face limitations. For instance, Planet Explorer only offers Planet Sandbox and Sentinel-2 data. Copernicus Browser vs. EO Browser sticks to Sentinel missions. There’s no direct access to high-resolution datasets, so users must look for other platforms like Sentinel Hub that provide such data.
Lacking Advanced Analysis Options
Beyond standard indices (e.g., NDVI and false color), platforms like EO Browser aren’t well suited for analysis: users can build formulas only in predefined formats or use the custom script option, which requires writing code. There’s just one analysis feature — time series charts — but they don’t link back to specific images. So, if there’s a spike or anomaly, you can’t check what actually happened on that date.
For users working on research, monitoring, or decision-making tasks, such limited functionality often falls short. They need more advanced EO Browser alternatives for agriculture monitoring, environmental observation, and urban planning.
How To Switch From Sentinel Hub EO Browser To EOSDA LandViewer
EOSDA LandViewer may be the best Sentinel Hub alternative when the latter no longer feels easy-to-use or flexible enough. Our platform offers a more structured layout and adds useful features like extended search filters, full AOI control, and direct access to analytic tools.
Interface Layout
One of the first things you’ll notice when switching to EOSDA LandViewer vs. Sentinel Hub is the mirrored layout. In the EO Browser, the key analysis tools are on the left, while additional options like settings or downloads are on the right.
On EOSDA LandViewer, it’s the opposite: core tools such as layer selection, visualization settings, and index tools are on the right, and secondary tools like AOI drawing and search filters are on the left. This alternative layout may feel unfamiliar at first, but the structure is consistent and clean, so getting used to it doesn’t take long.
Satellite Imagery Search
Searching for satellite imagery in both EO Browser and EOSDA LandViewer starts with selecting an Area of Interest (AOI). Users can draw it directly on the map, upload a file, or begin with the currently visible area in the viewport. From this point, the workflow on EOSDA LandViewer, as a better alternative to Sentinel Hub, becomes more efficient.
Unlike EO Browser, where users need to set filters and manually launch a search by clicking on the corresponding button, EOSDA LandViewer automatically displays the latest available images for the selected AOI. This saves time and gives a quick overview of available data.
The alternative platform users can then refine results using several filters. In addition to standard parameters such as data source, time range, and cloud coverage, the platform also allows filtering by sun elevation. Another helpful feature is displaying only those images that completely cover the selected AOI.
After filters are applied, users can choose the most suitable image from the list. Then, EOSDA LandViewer, as a Sentinel Hub alternative for agriculture, environmental, and urban monitoring, provides a familiar user experience: you can zoom in and out, pan the map, switch between visualization presets, and use built-in analytical tools. The image can also be imported in a few clicks or exported to external GIS software such as QGIS or ArcGIS.
Enable automatic notifications in EOSDA LandViewer’s Notification Manager to get updated when a new image becomes available for your AOI or when index values change significantly.
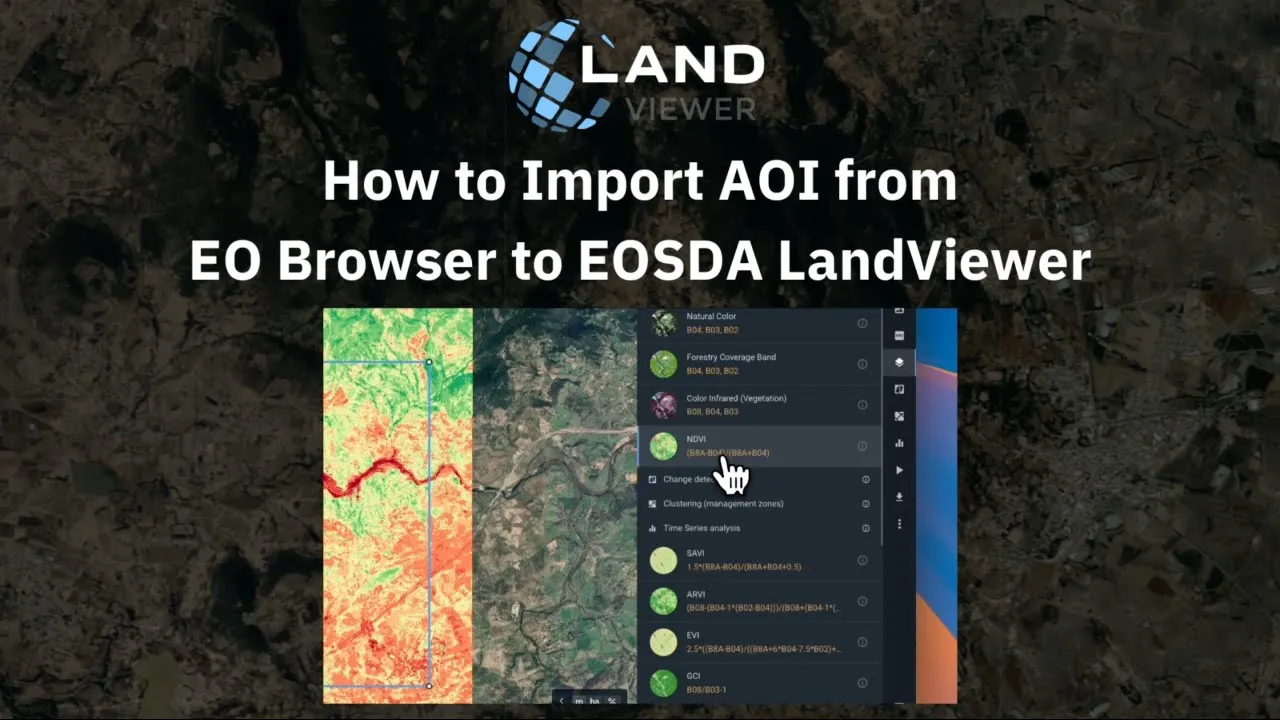
Importing Saved AOIs To The Alternative Platform
If you’ve already marked areas of interest in EO Browser, you can transfer them to an alternative platform, EOSDA LandViewer, in a few simple steps:
- In the EO Browser, export the AOI as a KMZ file.
- Open EOSDA LandViewer and click Upload area of interest (AOI) on the platform.
- Rename your AOI to easily find and monitor it later.
You can also import AOIs created elsewhere and choose from several alternative formats supported by EOSDA LandViewer, such as GeoJSON, KML, and SHP.
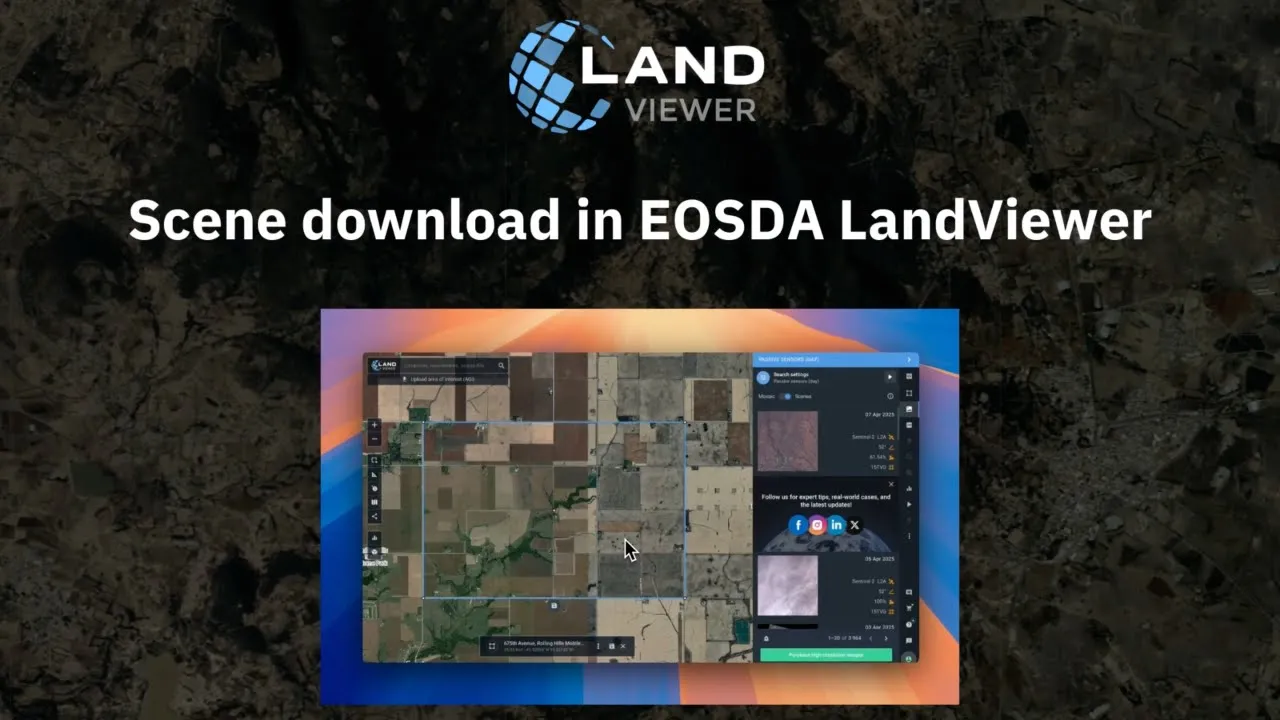
Satellite Imagery Downloading
Downloading satellite imagery from EOSDA LandViewer is quick and flexible. You can export images for your selected AOI in several alternative formats: JPEG for fast sharing or presentation, KMZ for visualizing data in Google Earth, or GeoTIFF for use in other GIS tools.
To get detailed metadata (e.g., for ENVI or ERDAS processing), including cloud coverage, acquisition date, sun elevation, and projection parameters, go to the Analytic tab. This is also where you can download individual spectral bands or band combinations for deeper analysis. For more information, check the Save and Download in our user guide.
Satellite Imagery Analysis
EOSDA LandViewer includes a range of alternative satellite image analysis tools to match and expand what’s available in EO Browser.
Indices And Band Combinations
This feature is similar to EO Browser’s Visualize section, but more flexible. In EOSDA LandViewer’s Band combinations section, you’ll find over 20 ready-made options (like NDVI, NDWI, false color) and a custom index builder. It’s a great Sentinel Hub alternative for NDVI and satellite-based index analysis since index customization here goes far beyond, as mentioned earlier.
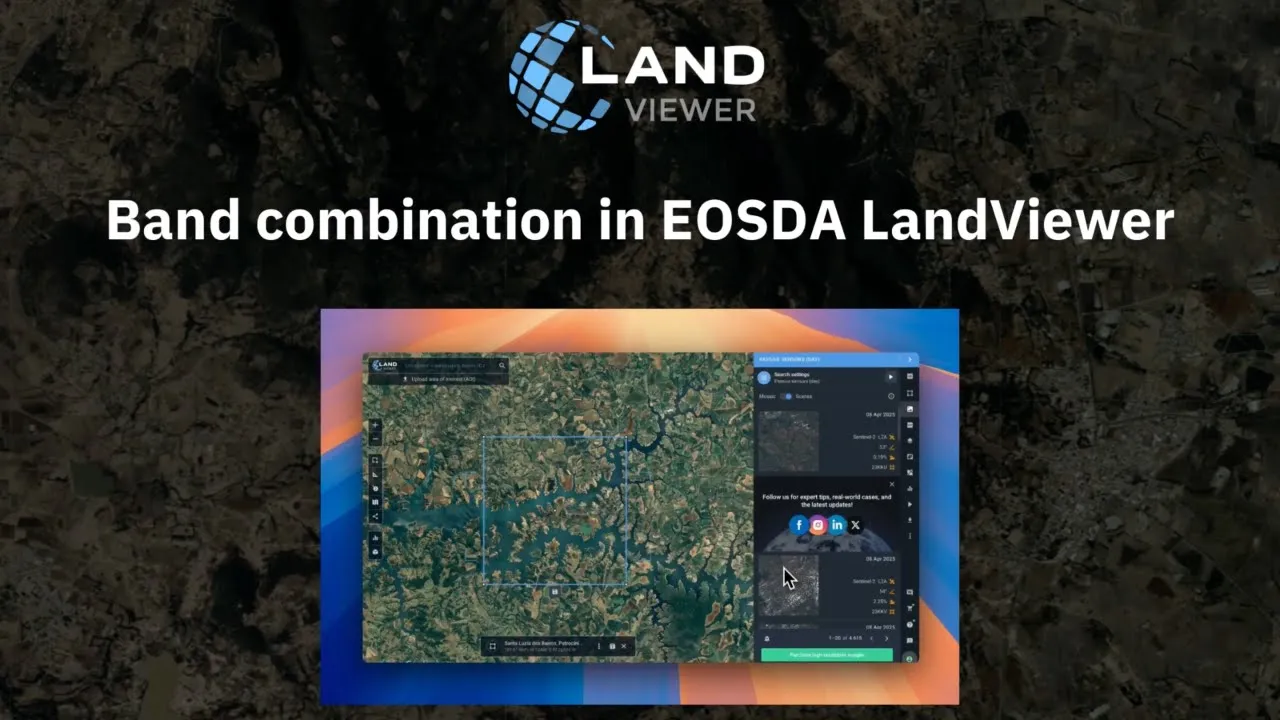
With EOSDA LandViewer, you can turn any sequence of images into a short time-lapse animation, handy for sharing changes with colleagues, reporting to government bodies, or using in presentations and media.
Change Detection
This tool works similarly to EO Browser’s Compare, but shows both images side by side. It’s easier to spot changes visually and measure their area right away. This makes EOSDA LandViewer a potent EO Browser alternative, for example, for deforestation monitoring — offering not only clearer but also more data-rich comparison.

Time Series Analysis
EO Browser builds time series charts for a selected AOI but doesn’t let users jump to source images. On EOSDA LandViewer — an EO Browser alternative for wildfire monitoring, climate change analysis, environmental impact assessment, etc. — each chart point is linked to its satellite image, helping you identify what caused the dip or spike. It also supports custom date ranges.

Clustering
EOSDA LandViewer vs. Sentinel Hub lets you group similar areas automatically. The tool generates both color-coded raster layers and black-outlined vector layers for further use. Just draw your AOI, pick the image, set the number of classes, and calculate. In our user guide, you may find more details on the capabilities and applications of clustering.

Key Takeaways On Switching From EO Browser To EOSDA LandViewer
EOSDA LandViewer is a solid Sentinel Hub alternative for special cases like forest monitoring and general cases like climate change analysis. Out of the box, it includes all the familiar tools for working with satellite imagery, such as band combinations and indices, and extra features like a custom index builder, time series analysis, and clustering.
If you’re used to the EO Browser interface, adapting takes a bit of time, but clear instructions and help from our team can ease the transition. Free access lets you explore EOSDA LandViewer firsthand: try uploading AOIs, checking indices, or exporting images. This way, you’ll know exactly how the alternative platform works before fully switching.
About the author:
Vasyl Cherlinka is a Doctor of Biosciences specializing in pedology (soil science), with 30 years of experience in the field. He attended the engineering college in Ukraine and received his degree in agrochemistry, agronomy and soil science in the Chernivtsi National University. Since 2018, Dr. Cherlinka has been advising EOSDA on problems in soil science, agronomy, and agrochemistry.
Recent articles
EOSDA to Monitor Wildfires in Portugal Using Satellite Data Under ESA’s InCubed Programme
The company signed a contract with ESA to create an innovative satellite-based solution for forest monitoring and wildfire prevention.
EOSDA Forecasts Yields For 2025 In Saskatchewan
EOSDA created RM-level crop yield forecasts for Saskatchewan to address limitations of official data. The project shows how satellite and weather inputs reveal local yield changes during the season.
Digital Tools Improve Soil Health And Yields In Mexico
EOSDA and ITTA supported a Guanajuato farm with contour-line planning, monitoring tools, and practical guidance to reduce soil erosion and improve yields in the long run.