With large amount of satellite imagery and analytical software becoming freely available, even small forest organizations or forestry specialists can leverage the remote sensing technology to monitor land use and protect global forests.
EOSDA LandViewer’s selection of Earth observation data and versatile image processing algorithms available in EOSDA Processing, altogether form a powerful platform for forest analysis. It can serve as a source of actionable insights in battle against deforestation in Brazil, that embraces 60% of the Amazon rainforest exposed to illegal cutting and land-grabbing for the past 50 years.
Detecting Forest Fires And Assessing Damage
The climate change leading to intense El Niño droughts coupled with historical Amazon basin deforestation and human slash-and-burn techniques for land clearing create ideal conditions for ignition. Facts tell that in 2017 human-set fires accounted for over a quarter of Brazil’s tree losses.
In Brazil, 2015’ El Niño drought caused a 36% increase in forest fires compared to previous twelve years.
According to statistics, fires in forests of the Amazon are most frequently started between July and October, peaking in September. In 2017, September and October fires were particularly bad. To estimate damage of one of 2017 autumn fires that burned down 54,000 ha in and around the Chapada dos Veadeiros National Park, we took a pair of Landsat 8 images over before and after the blaze, and calculated the Normalized Burn Ratio (NBR) using EOSDA LandViewer’s Custom band combination tool.
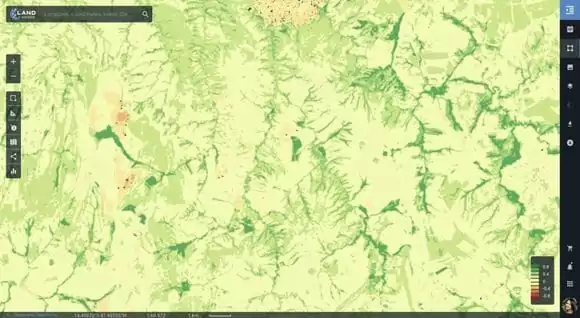
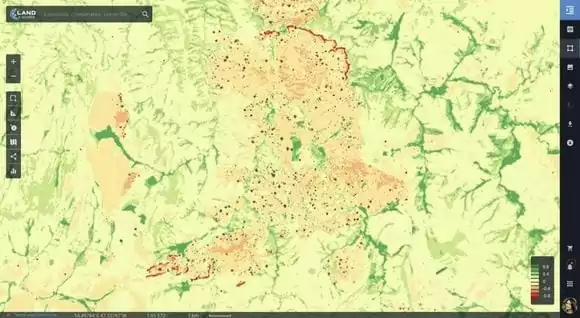
Burnt areas appear in orange shades, with red indicating the spots where there’s still active fire. High NBR values (in shades of green) represent areas of surviving vegetation.
NBR-based fire analysis can be performed with satellite images containing the near infrared (NIR) and shortwave infrared (SWIR) bands, such as Sentinel-2 data. EOSDA LandViewer provides access to all these imagery collections, and also allows to upload own images via the cloud EOSDA Storage. This data can be further used to create a burn severity map or measure the exact area of damage. To monitor vegetation recovery and estimate mortality, it’s also important to repeat NBR analysis of the affected area during the next growing seasons.
Other than NBR, various RGB composites can be created to visualize forest fires and burn scars. This shortwave infrared image displays the charred area in black and the ongoing fire remains – in bright red. False color band combination is another good alternative.
Monitoring Land Use Change And Tracking Deforestation
Cattle ranching, agriculture, logging and Trans-Amazonian highway construction have historically been the major causes of deforestation in Brazil. When deforestation rates in Brazil went sky-high in the 90s, it became a global issue due to detrimental effects that forest burning and the released carbon dioxide have on world’s climate.
Finding solutions of Amazon deforestation issues requires timely identification and mapping of areas undergoing illegal clearing, logging, or burning. Lack of funding and personnel to efficiently monitor the forest land use across millions of hectares can be solved by involving the remote satellite monitoring. Thanks to EOSDA LandViewer – a recently released product by EOSDA – deforestation monitoring in the Brazilian Amazon becomes a less complex task.
The Environment and Sustainability Secretariat (SEMAS) has only 20 forest guards to safeguard the entire state of Pará, which covers an area half the size of Texas.
Trends of Amazon rainforest deforestation can be best observed with multi-temporal analysis of satellite imagery, i.e. by comparing two images of same forest taken at different times. EOSDA LandViewer’s Comparison Slider can be useful in visualizing the differences between them and eyeball-estimating the scale of deforestation or any other damage.
However, to precisely map and assess forest damage caused by logging, fires or natural degradation, the automatic change detection has proved more efficiency. The entire analysis can be done in a short span of time, due to mutual integration of all EOSDA Platform tools: just find images in EOSDA LandViewer and calculate the index, save them to EOSDA Storage and proceed directly to EOSDA Processing for extracting the analytics.
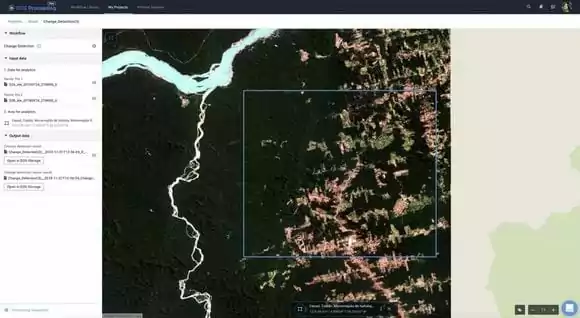
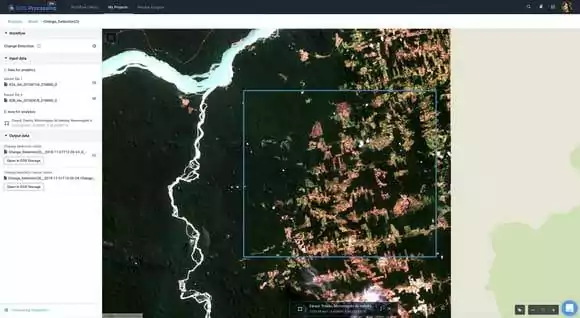
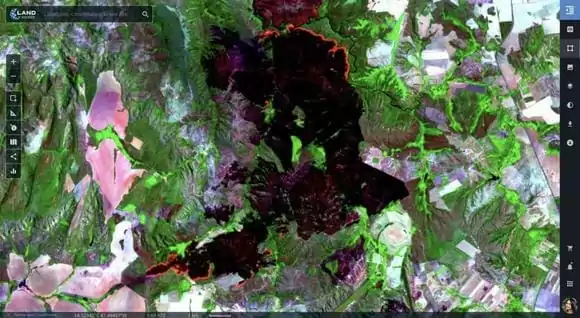
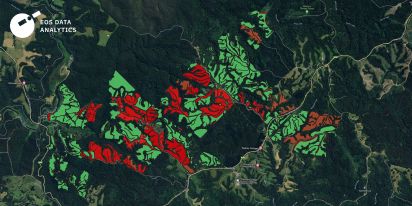
These are Landsat 8 images over the Triunfo Xingu Area of Environmental Protection, in Pará state – one of the most affected territories of the Amazon basin that lies within the infamous ‘arc of deforestation’. Once a country with the highest forest loss rate in the world, Brazil managed to hold down deforestation in the Amazon for a decade since 2005 thanks to the government crackdown. The latest statistics, nonetheless, show the falling trend reversed as huge areas were illegally cleared starting from summer 2017.
Conservation units in Xingu basin received the most damage, within less than a year. It is clearly visible from natural color image dated June 2018: compared to July 2017, lots of light green and brown areas have appeared, which are indicative of partial or complete tree cover loss.
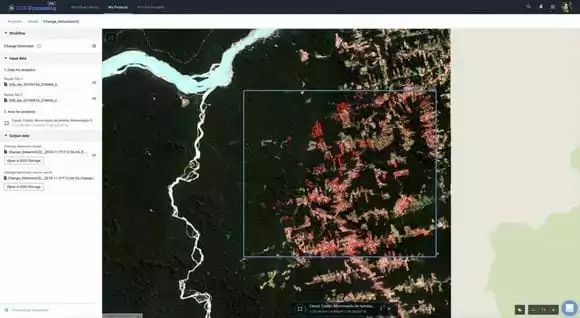
With the help of EOSDA Processing’ Change Detection algorithm that identifies changes from images in RGB and NIR spectrums, we received the third image that highlights the exact areas of deforestation of the Amazon rainforest in Brazil.
About the author:
Natalia Borotkanych has a PhD in space history, Master’s Degree in Foreign Policy from the Diplomatic Academy of Ukraine, as well as Master’s Degree in Public Management and Administration from National Academy for Public Administration under the President of Ukraine. Natalia's experience includes working in business, science, education, and government projects for over 15 years.
More news
How EUDR Compliance Drives Demand For Satellite Data
The European Deforestation Regulation (EUDR) has increased demand for satellite monitoring. Learn how businesses use satellite data to ensure compliance and gain a competitive edge.

How To Comply With New EUDR Using Satellite Solutions
The new EU Deforestation-free regulation EUDR is revolutionizing the way that commodities are imported to Europe. EOS Data Analytics experts share the main takeaways and recommendations on how to comply.
Forest Fragmentation: Far-Reaching Effects And Remedies
Forest fragmentation has a severe and far-reaching impact on the ecology. Communities and governments worldwide are now urged to seek lasting solutions to this pressing issue.