GNDVI: Green Normalized Difference Vegetation Index
The green normalized difference vegetation index (GNDVI) highlights chlorophyll activity in crops, using green and near-infrared spectral bands. It is sensitive to small changes in plant condition and therefore helps farmers identify early signs of crop stress. Unlike NDVI, it provides accurate readings in dense canopies and is, thus, suitable for later stages of plant growth. GNDVI is frequently applied in nitrogen management, water stress detection, and field monitoring throughout the season, useful both for immediate interventions and building long-term crop strategies.
What is GNDVI?
The GNDVI is an indicator widely used in precision agriculture and remote sensing to assess plant health and monitor crop development throughout the growing cycle. Unlike more general vegetation indices, the green normalized difference vegetation index focuses on plant “greenness,” that is, the amount of chlorophyll and the photosynthetic activity in the crop canopy. This sensitivity to chlorophyll makes it valuable for detecting subtle changes in crop health related to both water and nitrogen uptake.
GNDVI formula
To calculate the GNDVI vegetation index, you need data from the near-infrared (NIR) and green bands of satellite sensors. The value is found by dividing the difference between NIR and green by their total:
GNDVI = (NIR – Green) / (NIR + Green)
GNDVI range
GNDVI values range from -1 to +1 and have the following agronomic meaning:
- -1–0 — water bodies, snow, or bare soil, where no green vegetation is present;
- 0.1–0.5 — sparse, stressed, or moderate vegetation (areas with low chlorophyll, signs of plant stress, or early-senescent/aging crops);
- 0.5–1 — healthy, dense vegetation with high chlorophyll content, vigorous growth, and strong photosynthetic activity (typical for mature crops or lush canopies).
What are the differences between GNDVI and NDVI?
GNDVI’s higher sensitivity to chlorophyll means farmers can detect stress, such as nutrient deficiency or water shortage, earlier than with NDVI satellite imagery. The green normalized difference vegetation index is also less influenced by soil and air conditions. In practice, NDVI is useful for measuring biomass, but GNDVI is often the better choice for catching early stress.
| Characteristic | GNDVI | NDVI |
|---|---|---|
| Spectral bands | Green + NIR | Red + NIR |
| Focus | Chlorophyll content | Overall vigor and biomass |
| Stress detection | Early nutrient deficiencies and water stress | Late signs of stress |
| Sensitivity |
|
|
| Applications | Precision agriculture and nitrogen management in mid-to-late growth stages | General vegetation monitoring in early-to-mid growth stages |
| Limitations | Requires a green-band sensor, not available on all satellites/drones | Saturates in dense and mature crops |
Best applications of the GNDVI index
The green normalized difference vegetation index is particularly effective in monitoring nitrogen deficiencies and detecting plant stress, including late in the season. Its best applications include:
- Nitrogen management. Chlorophyll level is typically proportional to nitrogen level in leaves. So, GNDVI enables non-destructive nitrogen status assessment and helps manage N fertilizer sustainably. This is crucial in nitrogen-sensitive crops (e.g., wheat), where nitrogen drives biomass and yield.
- Supporting variable-rate fertilization. Aside from GNDVI-based nitrogen mapping, there’s proven potential in retrieving potassium or phosphorus status with advanced hyperspectral approaches, incorporating the green normalized difference vegetation index as one of several indices. Thus, GNDVI-based maps can be practical for creating precision fertilization strategies.
- Late-stage crop monitoring. GNDVI vs. NDVI continues to deliver reliable readings even in high-biomass conditions, which gives farmers an advantage later in the season for monitoring mature or dense canopies.
- Stress and disease detection. Drops in the GNDVI often point to problems like early disease pressure, pest infestation, nutrient deficiency, or heat stress in plants. Regular monitoring allows farmers to act immediately, before the problem unfolds.
- Analyzing soil-vegetation relationships. Studies show that the green normalized difference vegetation index has statistically significant correlations with major soil texture components at the field scale (coefficient of determination above 0.6–0.7). By combining GNDVI-based maps with soil texture surveys, agronomists can identify management zones and target interventions to areas where soil physical properties are likely limiting crop performance.
How to use GNDVI on the EOSDA Crop Monitoring platform
The green normalized difference vegetation index is available as one of the vegetation indices in EOSDA Crop Monitoring. Follow these steps to enable it, analyze the maps, and use the data in field planning.
Step 1: Create your account and set up a field.
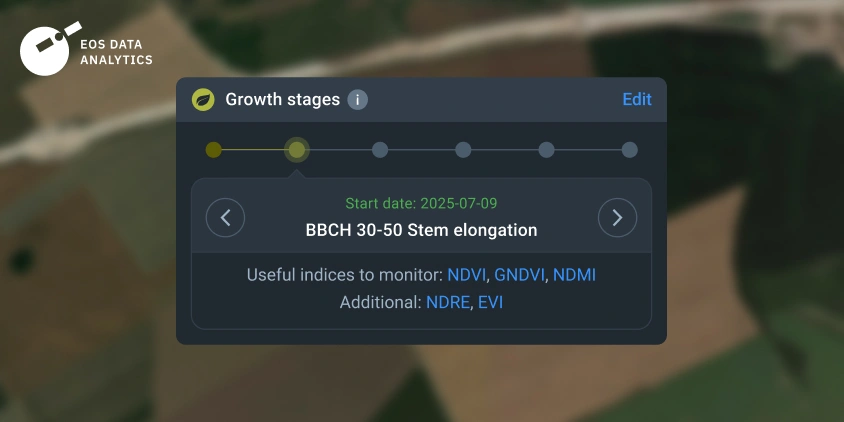
If you are new to EOSDA Crop Monitoring, start by creating an account and outlining the field/farm you want to analyze. Once the field is set up, you’ll get access to processed satellite imagery, with both the latest updates and a historical archive. If you enter the crop type and sowing date, the system will guide you on when GNDVI is most useful and when other indices might give clearer results.
Step 2: Enable GNDVI monitoring.
While NDVI, NDRE, and 3 more indices are available in EOSDA Crop Monitoring by default, GNDVI is an additional option for more advanced crop analysis. To activate GNDVI-driven monitoring of your fields, contact us at sales@eosda.com for details and a tailored offer.
Step 3: Analyze and interpret the GNDVI map.
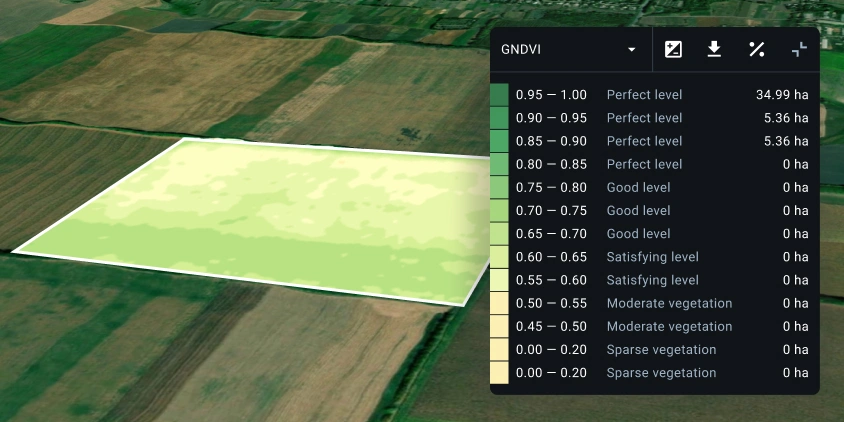
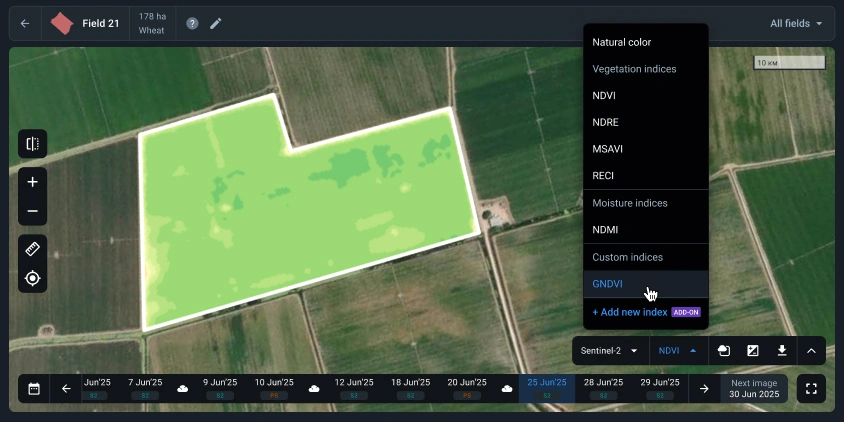
After activation, from the main interface, open the list of vegetation indices and select GNDVI. The system will immediately create a new field map based on the index values, showing crop health through photosynthetic activity.
The map uses a color scale to show differences in crop condition. Areas with high values (dark green) signal strong growth and good nitrogen status, while low values (yellow or brown) mark weaker zones where stress, pests, or poor soil conditions may be present.
Step 4: Compare over time and across indices.
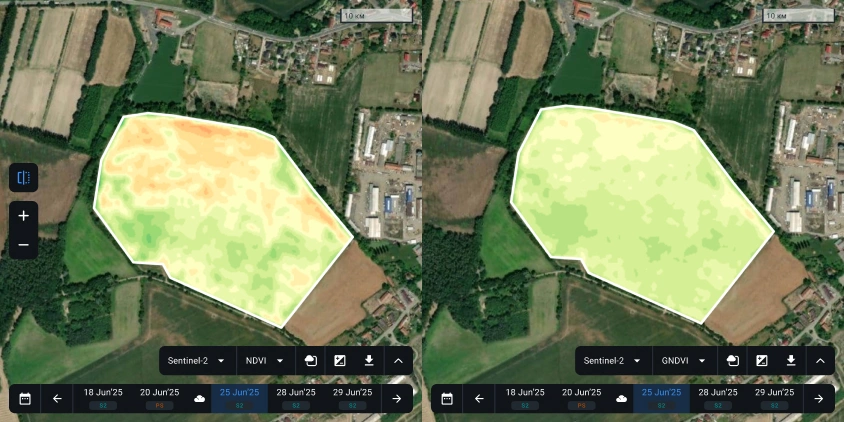
Use the Split view to compare GNDVI with other indices like NDVI or NDMI. Checking the same area across several indices helps better understand its condition. Tracking the green normalized difference vegetation index in the archive also helps assess how your actions, such as fertilizer use, influence field conditions over time.
Step 5: Use GNDVI-based insights for field activity planning.
GNDVI-based insights can be directly applied in EOSDA Crop Monitoring tools for planning fieldwork:
- Variable rate fertilization. Open the VRA map feature – Vegetation section, select GNDVI, pick the image date, and generate a map for fertilizer application. You can set the desired application rates and download the file for direct use in farm machinery.
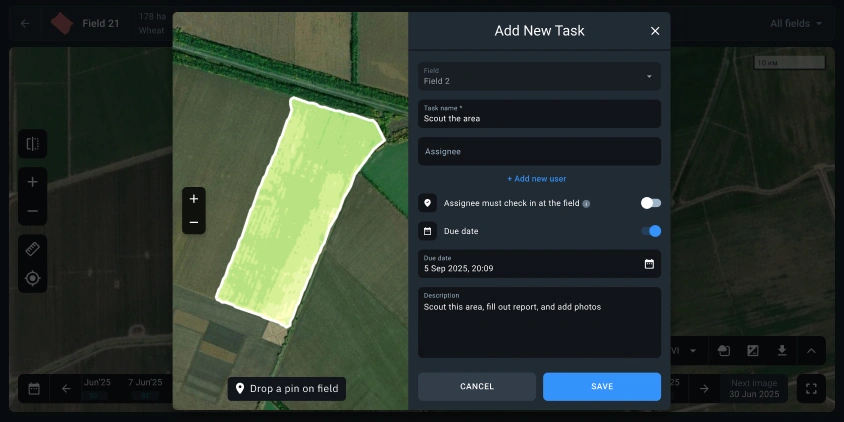
- Scouting. Create a scouting task linked to problem zones, detected using the GNDVI-based map. So, scouts can go straight to problem zones and check conditions on the spot.
Consistent monitoring of GNDVI shows how crops respond to your decisions over the season. Comparing these insights with actual field outcomes helps refine management strategies and improve the accuracy of future interventions.