NDVI Imagery That Puts You In Control Of Your Fields
Monitor your fields and stay ahead of crop issues with NDVI satellite imagery — complete overview from anywhere:
- Optimize input use and reduce waste
- Detect crop stress and nutrient deficiencies remotely
- Pinpoint problem areas and take action fast
- Plan data-backed harvesting schedules
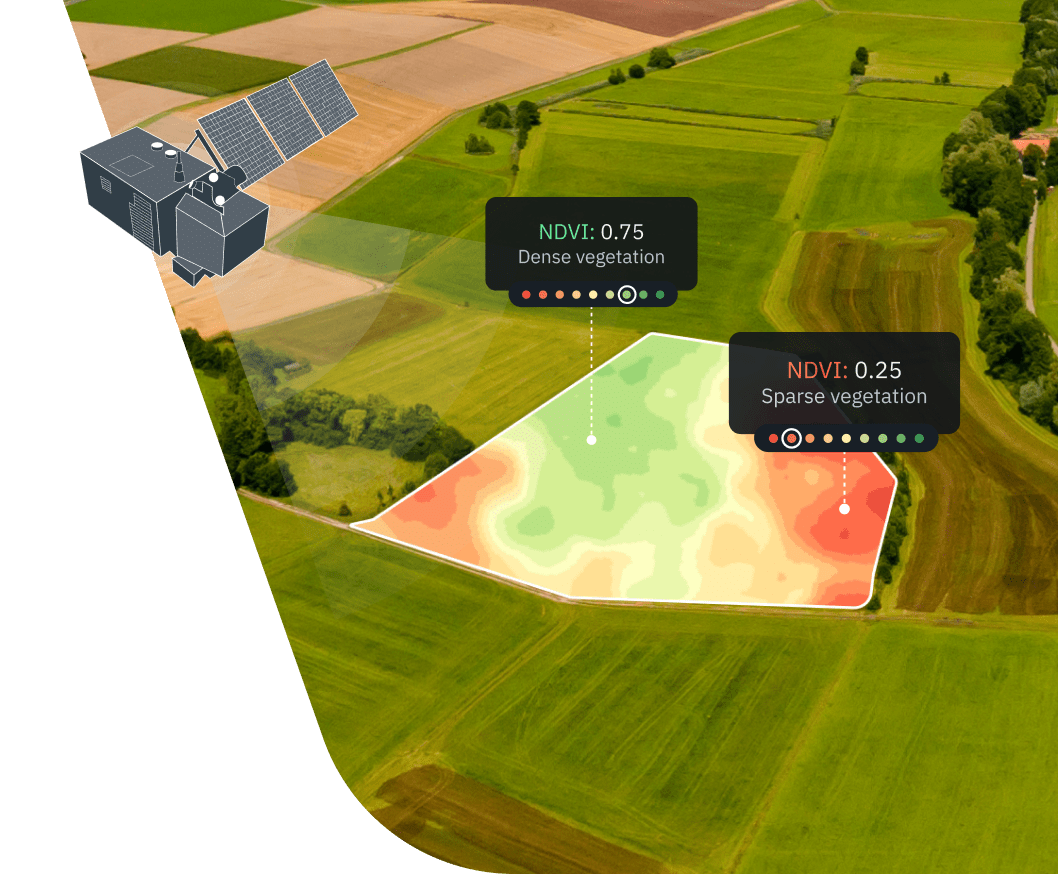
How EOSDA Crop Monitoring turns satellite imagery into actionable NDVI
Collects gigabytes of raw data from several satellites daily
Processes imagery to detect and filter out clouded and shadowed
Delivers cloud-free NDVI-processed satellite imagery on the platform or app
NDVI Imagery in action: Top uses for agriculture
Raw satellite imagery doesn't tell the whole story. Our analytical tools help you extract the meaning behind it — turning what you see into clear actions you can take.
Detecting and fixing crop issues early through NDVI change alerts
A wheat farmer in Kansas relied on NDVI satellite imagery to monitor crop health across multiple fields throughout the growing season. When EOSDA Crop Monitoring flagged a sudden index drop in one field area, he inspected the area and found a local problem affecting wheat growth. Immediate treatment stopped the problem from spreading, protecting the yield. Without the alert from precision agriculture software, the damage could have gone unnoticed until it was too late to rectify.
With NDVI change alerts, the farmer detected crop stress early and preserved both yield quantity and grain quality — avoiding costly crop losses.
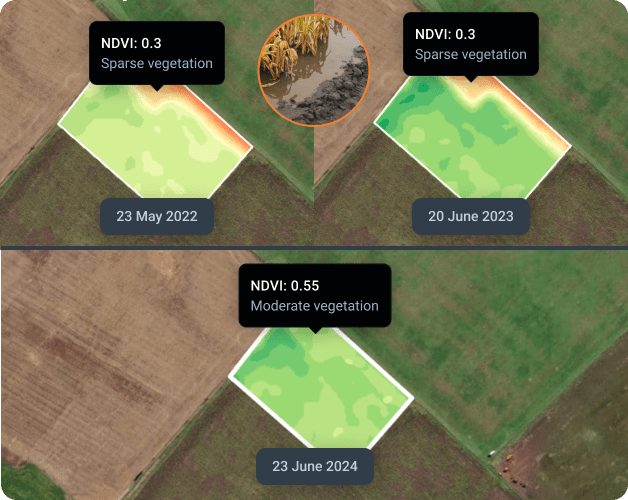
Identifying low-productivity areas with year-to-year NDVI comparisons
Consistently low index readings over several growing seasons often point to problems like poor drainage, unsuitable soil pH, low nutrient levels, or soil compaction. Reviewing NDVI imagery from past seasons allows farmers to pinpoint underperforming areas and refine their management strategies for the next seasons.
That's exactly what an Iowa corn farmer did. He monitored NDVI satellite imagery over the years and noticed that some field areas were consistently underperforming. Past satellite imagery and field data helped him recognize poor drainage and soil compaction as the root causes. The farmer made several adjustments to his strategy, such as tilling the soil deeply and enhancing drainage. The following season, corn began to grow and produce far better, as reflected by increased index values.
By using NDVI imagery to monitor seasonal crop development, the farmer made everything in his power to turn underperforming areas into productive ones while optimizing resource allocation across all fields.
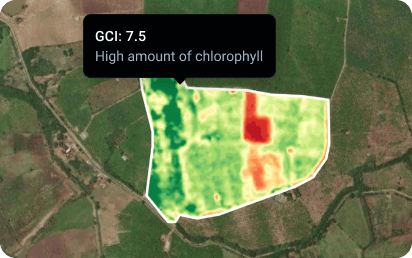
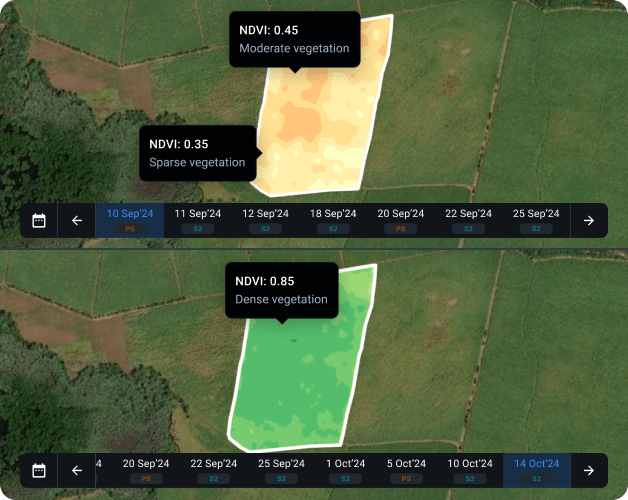
Precision nitrogen management based on NDVI imagery
A Thai corn farmer transformed his fertilization strategy using NDVI satellite imagery. Mid-season, the imagery analytics revealed distinct zones of crop stress that conventional observation missed. Soil analysis confirmed nitrogen deficiency in precisely the areas showing poor index values. Armed with this knowledge, the farmer applied fertilizer treatments only to affected field areas.
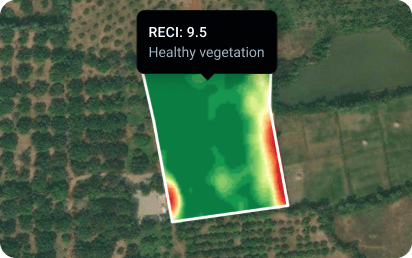
The plants' response was striking — they recovered within weeks, so index values normalized too. NDVI imagery analysis shows the best results for nitrogen-demanding crops like corn, wheat, and rice, where chlorophyll levels directly reflect nitrogen status. We recommend pairing NDVI with ReCI (Red Chlorophyll Index) to get a complete and precise nitrogen profile.
With NDVI satellite insights being a part of his fertilization strategy, the farmer optimized nitrogen application, achieving healthier, more uniform crop growth and increased harvest quantity and quality.
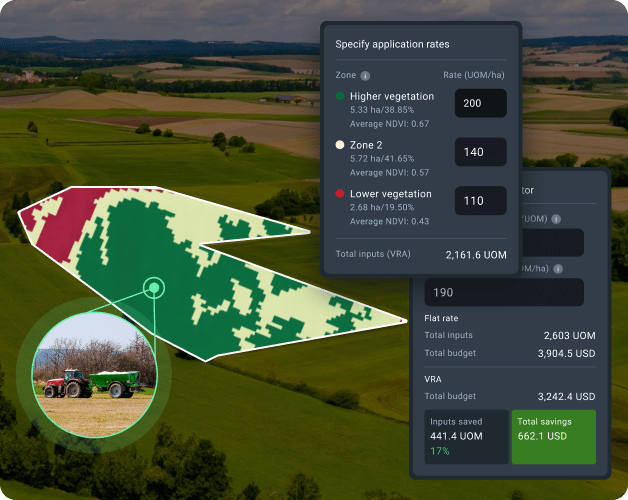
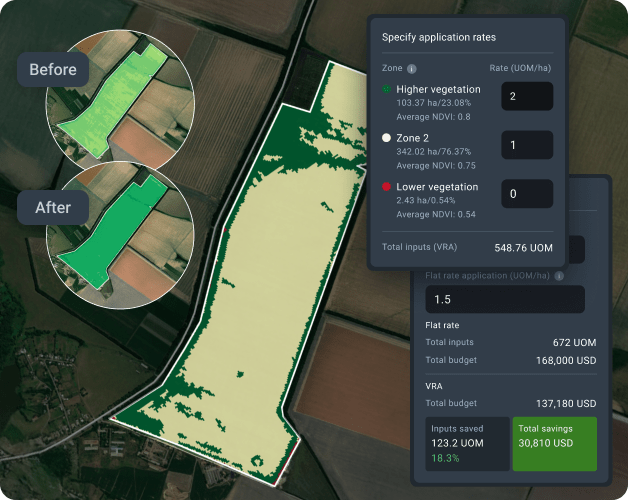
NDVI-powered variable rate input application
NDVI imagery allows agriculture producers to apply fertilizer where it will actually work. Through detailed imagery analysis, farmers distinguish between high-vigor areas with strong growth potential and low-potential areas with limited response capacity. Rather than treating fields uniformly, NDVI-guided application concentrates fertilizer in high-response zones while reducing waste in areas where additional inputs won't translate to yield.
A Brazilian soybean producer carried out this precision agriculture approach, using NDVI imagery to categorize his fields into distinct productivity zones. His revised strategy: minimal fertilizing for low-potential zones with poor uptake capacity and targeted enrichment of high-vigor areas primed for maximum response. This new approach, based on NDVI maps for download into agricultural machinery, boosted soybean productivity in fertilized areas and eliminated the waste inherent in the traditional blanket application.
Switching to NDVI-powered variable rate fertilizer application brought dual rewards: higher crop productivity today and more sustainable practices that make better use of resources and improve fields' health year after year.
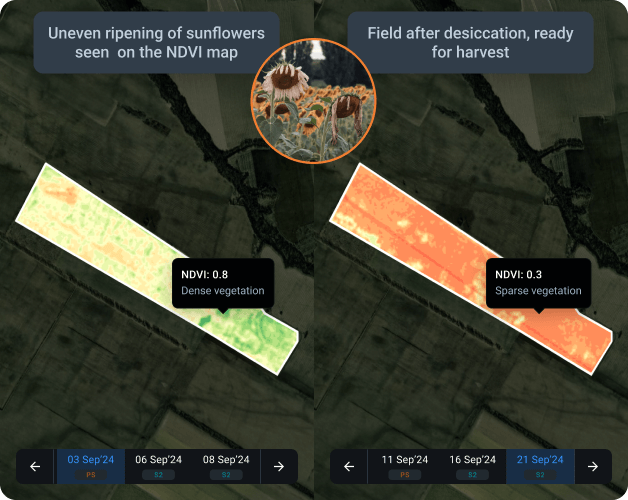
Desiccation planning with the help of NDVI imagery
One of the greatest challenges for our large-scale client was that crops didn't all ripen at the same time: wait for everything to ripen, and you risk weather damage; harvest too early, and quality suffers. However, judging where to use desiccants by eye often led to mistakes.
NDVI agriculture field mapping changed this. Now, the crop producer sees on satellite imagery exactly which parts of their fields are behind the maturation schedule and need drying agents. They spray only those areas, getting all crops ready for harvesting at the same time. This means one efficient pass with the combine instead of multiple partial harvests: equipment runs fewer hours, burning less fuel, and workers spend less time in the field. Grain comes out cleaner with less green material mixed in. And because the crop producer is spraying chemicals only where needed, they reduce their environmental footprint.
Thanks to NDVI imagery, the crop producer moved from a multi-phase to a single-pass harvest process, delivering higher-quality produce.
Cost-efficient plant growth regulation with NDVI mapping
A Ukrainian wheat farmer battled growing condition variability that created unpredictable growth patterns across his fields. Traditional uniform plant growth regulator (PGR) application proved inefficient — simultaneously wasting product on underdeveloped plants and insufficiently treating overgrown ones.
NDVI imagery revealed the exact wheat growth zones, which let the farmer implement zone-specific PGR rates: higher doses for areas with strong growth that tend to lodge, lower doses for areas with moderate growth, and no application for areas that are struggling. Our platform's algorithms transformed NDVI imagery into maps for download and use on agriculture machinery to apply plant growth regulators precisely. This not only synchronized plant development and yield consistency throughout the field but also eliminated wasteful and harmful over-application.
With NDVI crop monitoring, the wheat grower achieved the most consistent crop maturity and harvest quality in his farming history while reducing PGR costs and chemical load on the environment.
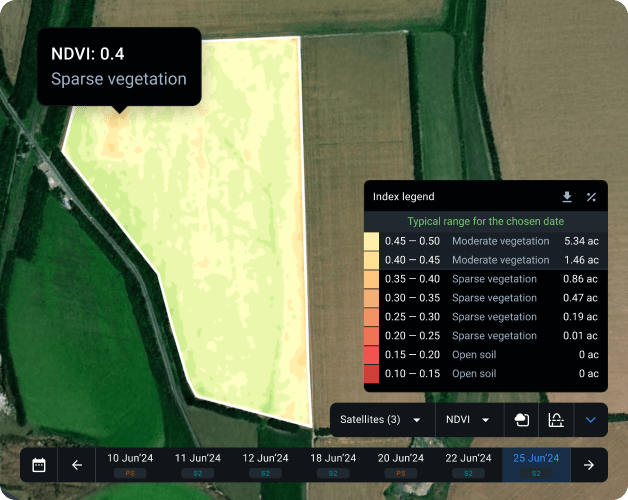
Spotting crop growth delays using NDVI imagery
An Iowa corn farmer caught a serious problem early using remote sensing and NDVI analysis. His field showed an average reading of 0.25, while EOSDA Crop Monitoring indicated that healthy corn should measure between 0.35 and 0.4 at that growth stage. Currently, the platform provides typical NDVI ranges for 20 common cash crops, reflecting average vegetation according to crop type and growth stage. Not taking chances, the farmer conducted a manual field inspection to verify satellite imagery warnings.
His on-the-ground inspection confirmed what the imagery signaled — plants were developing more slowly due to insufficient nutrients. So he quickly changed his field management approach, applying treatments to struggling areas while maintaining his standard program for healthy ones.
NDVI imagery helped the agriculture producer detect and address the specific nutrient deficiency early, allowing them to recover corn's healthy growth pattern and protect potential yields that might otherwise have been damaged.
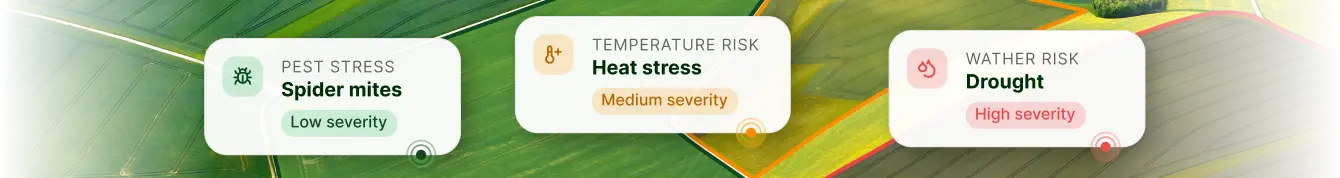
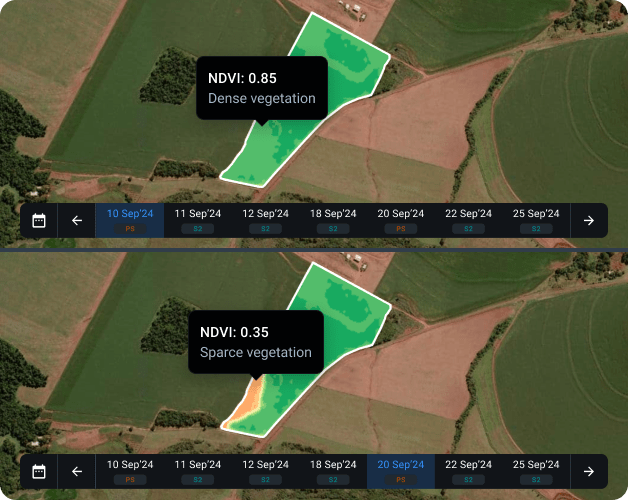
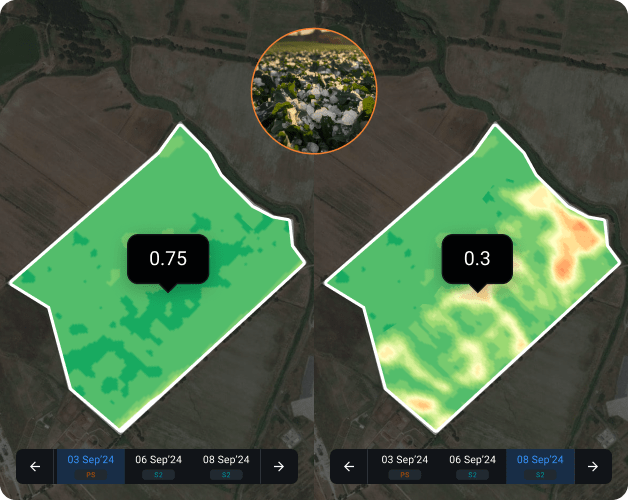
Detecting areas of crop stress through NDVI monitoring
When a hailstorm hit his farm, a German farmer turned to NDVI software to see the real damage rather than rely on estimates. Index monitoring showed a clear signature of damage — a sudden drop in vegetation health in specific field areas. Using Split View comparison, the farmer positioned pre-storm imagery alongside post-storm imagery, revealing the exact boundaries of the affected area.
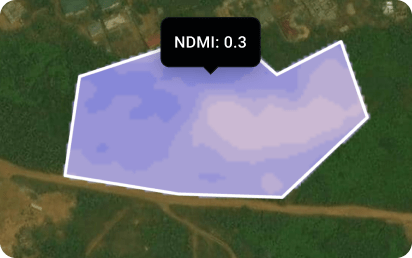
Damage assessment based on satellite imagery provided clear documentation for insurance purposes while enabling targeted recovery efforts in the hard-hit areas. Beyond this single weather event, his consistent satellite imagery monitoring helped detect other stress factors throughout the growing season. During dry spells, he noted how index patterns changed as drought stress developed. To confirm drought as the specific cause rather than disease or nutrient deficiencies, he incorporated Normalized Difference Moisture Index (NDMI) analysis — the index focused specifically on plant moisture content instead of general vegetation health.
NDVI imagery comparison revealed precise hail damage boundaries, saving time on field assessment while providing solid evidence for insurance claims and guiding targeted recovery actions.
Why choose NDVI imagery on EOSDA Crop Monitoring?
Several imagery providers: Sentinel-2 and PlanetScope
Updates daily with PlanetScope and every 3–5 days with Sentinel-2
High-resolution (3m) imagery from PlanetScope
Reliable cloud-detection algorithm
10+ vegetation indices available for deeper insights
Built-in NDVI-driven tools to inform better farming decisions
Smooth integration with weather, soil moisture, and other key data sources
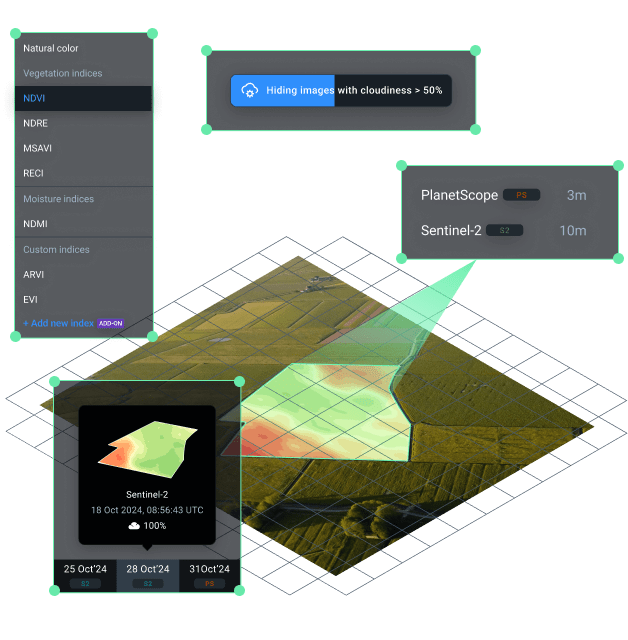
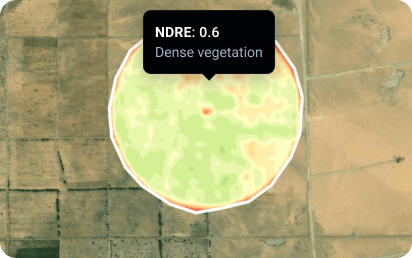
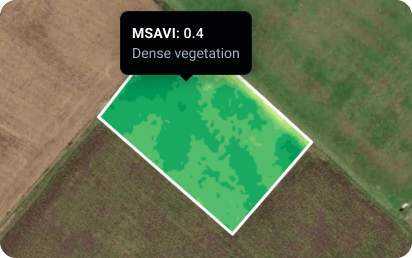
Go beyond NDVI with smart index selection
NDVI works great for precision agriculture, but occasionally it just isn't the best fit for a crop's current growth stage. If this happens, our algorithm recommends the most relevant index. Check out other readily available vegetation indices: