NDVI Explained: How The Index Helps Monitor Crop Health
It’s easy to think of the normalized difference vegetation index (the NDVI full form) as a simple health check for crops: high numbers good, low numbers bad. But real-world farming isn’t that binary. NDVI captures signals from the field that, depending on context, could mean success, stress, or just natural change. Learning to tell the difference is where its true value lies. In this article, we’ll explore how to move beyond surface readings, use the normalized difference vegetation index as part of a deeper field analysis, and avoid common mistakes that cost time and resources.
What is NDVI?
Normalized difference vegetation index (NDVI) is the essential metric for assessing crop health from satellite images. It shows their condition based on how much light of different wavelengths plants absorb and reflect without the need for regular field visits.
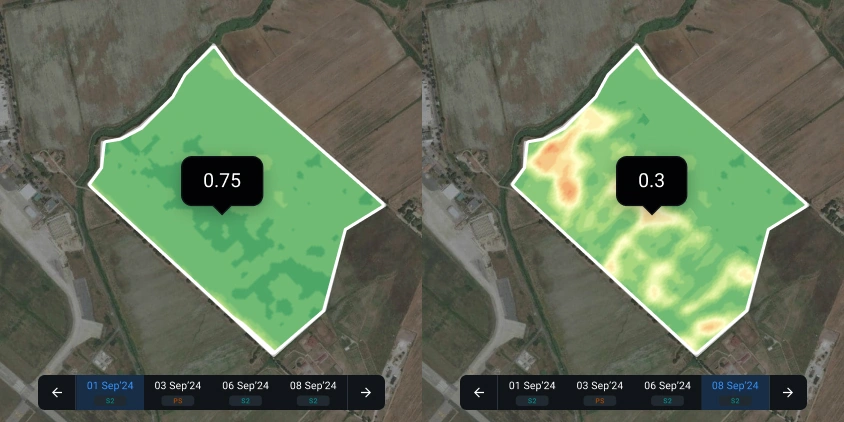
Monitoring index variations over time allows agronomists to track seasonal development, detect early signs of stress, and plan interventions before damage becomes critical. A sudden decline might indicate drought stress, disease outbreaks, nutrient deficiencies, or pest damage. Yet, not every decrease is a sign of trouble. Normal processes, such as harvesting or natural leaf aging (senescence), also lower NDVI values.
This is why the NDVI imagery should not be used in isolation. It should be evaluated together with ground data, weather reports, or other satellite indicators to avoid misinterpretation. Looking at historical index trends can also help set realistic expectations for a crop’s growth cycle, especially under variable weather conditions.
How is NDVI calculated?
To measure how the surface reflects light, normalized difference vegetation index typically relies on satellite-derived data. Here’s the formula of NDVI:
NDVI = (NIR-RED) / (NIR+RED)
where:
NIR is the amount of near-infrared light reflected by the surface;
RED is the amount of visible red light reflected by the surface .
During manual NDVI calculation, consider that the exact band numbers for NIR and RED differ depending on the satellite. However, a more convenient option is to use a precision agriculture platform for calculation. Our crop monitoring platform automatically processes satellite images, considering all the nuances, calculates the index for every field, and can display its distribution on interactive, downloadable maps.
How does NDVI work for crops?
The NDVI equation works by comparing how much visible red light a plant absorbs with how much near-infrared light it reflects. Healthy plants have chlorophyll, which absorbs RED and reflects NIR light. When plants get stressed, like being too dry or diseased, they reflect less near-infrared light and absorb more of it. By measuring the difference between different types of light absorbed and reflected, the normalized difference vegetation index gives us a good idea of how healthy the plant is based on the amount of chlorophyll it has.
Tips to interpret NDVI values
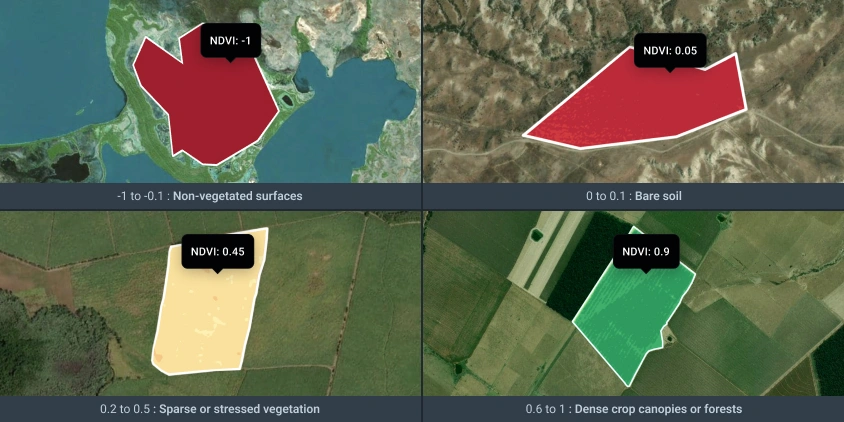
NDVI values give an easy-to-read picture of land cover and crop conditions, running from -1.0 (lowest) to 1.0 (highest) . Here’s what different ranges typically mean:
- -1 to -0.1 (negative values) usually signal non-vegetated surfaces like open water, snow, or thick cloud cover;
- 0 to 0.1 (low values) are typical for bare soil, rocky areas, or deserts — lands with little to no photosynthetic activity;
- 0.2 to 0.5 (moderate values) suggest sparse or stressed vegetation. Grasslands, shrubs, meadows, and fields under drought or entering dormancy often fall into this range;
- 0.6 to 1 (high values) point to lush, healthy vegetation, such as dense crop canopies or mature forests.
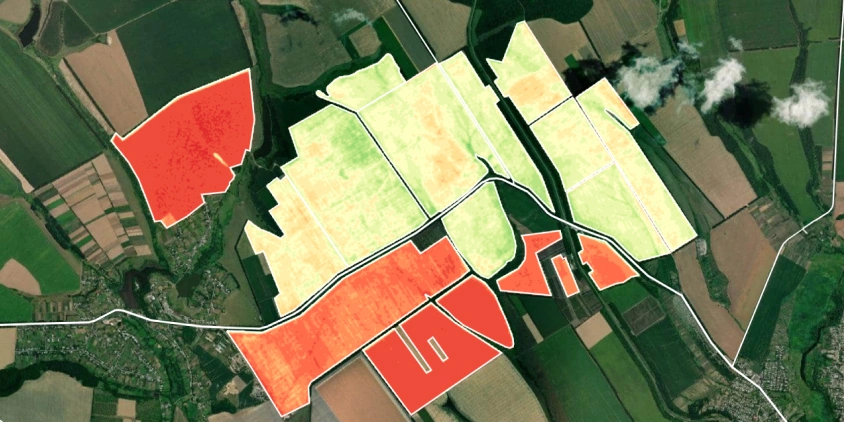
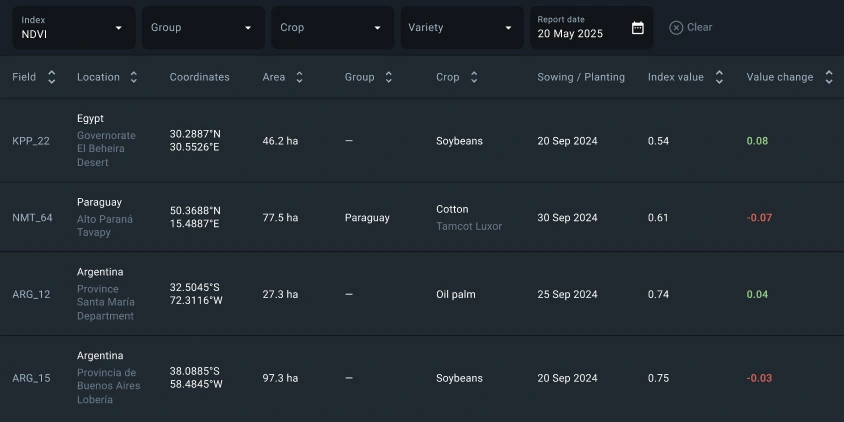
EOSDA Crop Monitoring uses these readings to show the exact condition of crops across fields at all times, helping farmers quickly detect where vegetation is dense, moderate, or sparse and spring into action.
What is the role of NDVI in agriculture?
Farmers refer to NDVI as an indicator of how well crops are growing, using light reflection as a signal of plant health. It’s based on a simple idea: healthy plants reflect the light differently than stressed ones. NDVI in agriculture is especially useful because it works even when lighting, slope, or weather conditions vary — it ignores those distractions and focuses just on the light reflection by the crop. It’s also a key input for large-scale crop monitoring and estimating vegetation traits, such as nutrient uptake that you can’t see directly from agriculture satellite data.
The biggest strength of NDVI for precision agriculture is scale. With just one satellite pass, farmers can check the entire field and pinpoint areas that need attention. What to do next with this data? Send scouts to specific problem areas; apply fertilizers and other chemicals at variable rates, depending on the health of crops in specific zones; use plant stress protection products selectively or in advance, etc. That kind of monitoring speed and accuracy is hard to match by hand. The result is better decisions, lower input costs, and higher returns — making NDVI crop monitoring a smart, long-term investment.
NDVI practical applications with the help of EOSDA Crop Monitoring
EOSDA Crop Monitoring offers an easy way to monitor crops remotely using NDVI and other common vegetation indices. Farmers can add their fields to the precision agriculture platform, adjust crop type and sowing date, and receive notifications about any NDVI changes.
Our agriculture platform provides:
- continuous monitoring for each field throughout the season;
- daily high-resolution satellite imagery for agriculture through PlanetScope integration;
- cloud-detection technology to ensure consistent, unobscured imagery;
- seamless combination of NDVI maps with weather, soil moisture, and other critical data.
Next, we’ll look at specific ways you can integrate normalized difference vegetation index insights into your farming practices.
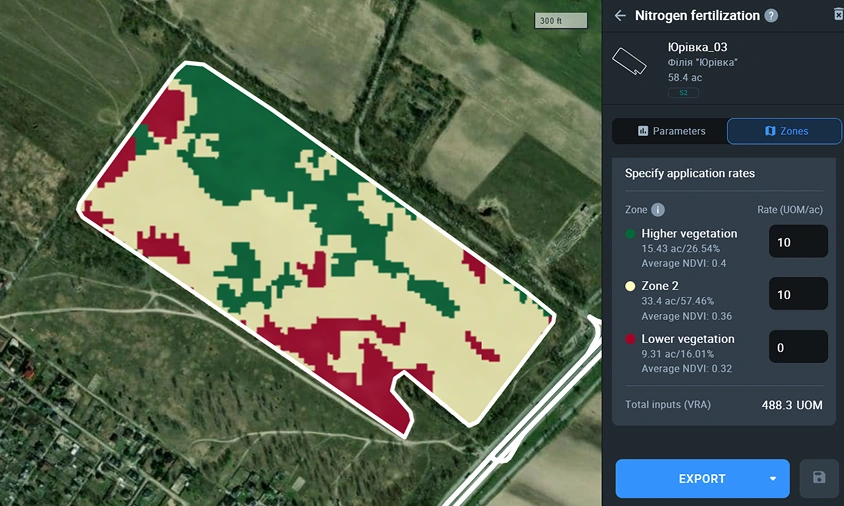
How to apply inputs at a variable rate based on NDVI maps
NDVI maps show how vegetation health differs across a field. Based on this data, farmers can split the field into management zones, such as high-productivity, medium-productivity, and low-productivity. Then, they can apply fertilizers, pesticides, or growth regulators at a variable rate — more in zones that are likely to pay off and less in zones that are not. NDVI-guided variable rate application cuts unnecessary costs, reduces pressure on the environment, helps crops grow more evenly across the field, and improves how well inputs work.
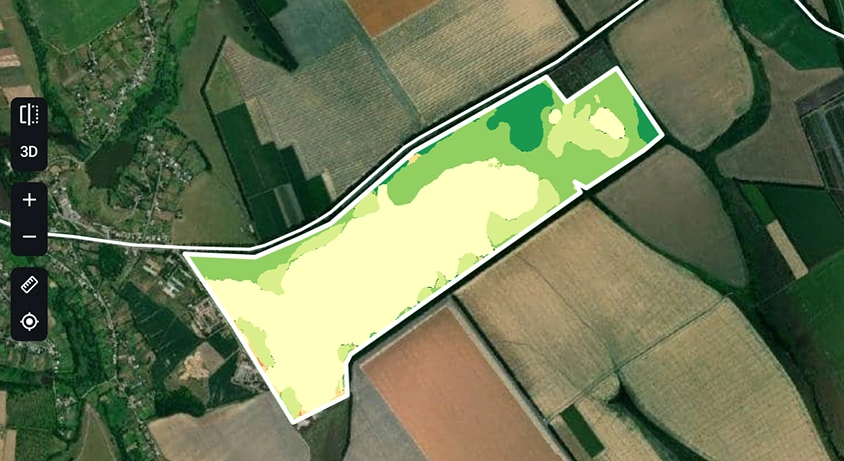
How to manage resources more efficiently with NDVI
On large farms, managing inputs evenly across hundreds or thousands of hectares often leads to inefficient use of resources. NDVI data helps pinpoint where crops are falling behind — whether due to under- or over-application of water, fertilizer, or other inputs. These low index values highlight areas that may need a different treatment rate or timing.
Even more importantly, the index acts as a feedback loop. When its value consistently lags in certain areas, it’s not just a sign of current stress — it may also reveal deeper issues like poor soil structure, drainage problems, or past management mistakes. Instead of increasing inputs haphazardly, growers can use this data to correct the underlying cause.
How to monitor vegetation recovery after extreme weather events using NDVI
After a severe hail or frost, a field might look uniformly damaged, but appearances can be misleading. Normalized difference vegetation index allows you to separate the areas that are still viable from those beyond recovery. A post-event index map quickly highlights zones of reduced plant vigor, helping target replanting or treatment efforts instead of managing the entire field blindly . On top of providing general health checks, monitoring index changes over time can shed light on which crop varieties are more hardy to inform future planting decisions.
Detailed index records can also support crop insurance claims, reducing the chances of disputes.
How to detect crop issues early by monitoring NDVI changes
You can use NDVI data to catch crop problems early, before they cause any serious damage. Here’s how it works in EOSDA Crop Monitoring:
- Every time a new satellite image is available, the system calculates NDVI values for your fields.
- If there’s a drop in the index values — an early sign of plant stress — the system flags it.
- You get an automatic notification showing which field needs attention.
This process helps farmers, agri consultants, traders, insurers, and others involved in crop production stay informed without having to check every image manually. It saves time and supports faster action when problems appear.
NDVI may be just one index, but when used right, it becomes a powerful tool for making smarter farm management decisions throughout the growing season. In the long run, it builds a more informed way of working with the farmland and boosting crop yields.
About the author:
Kateryna Sergieieva has a Ph.D. in information technologies and 15 years of experience in remote sensing. She is a Senior Scientist at EOSDA responsible for developing technologies for satellite monitoring and surface feature change detection. Kateryna is an author of over 60 scientific publications.
Recent articles
LandViewer integrates Satellogic high-frequency imaging
LandViewer has expanded its high-resolution monitoring options by integrating Satellogic NewSat data. This update provides more frequent revisits and detailed imagery for tracking daily changes.
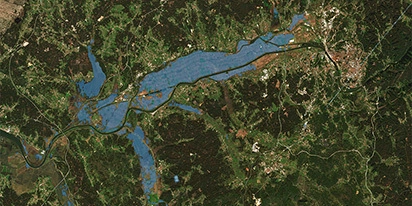
Validating satellite tech for flood analysis and damage mapping in Coimbra
Can satellites improve disaster response? We explored this in the Coimbra district, showing how integrated satellite intelligence can assess flood impacts and fill critical data gaps during a crisis.
What’s Better Than Google Earth For Professional Use?
Is the resolution of free maps too low for your project? LandViewer offers a professional alternative to Google Earth with up to 0.3m imagery and daily revisits to ensure you never miss a detail.