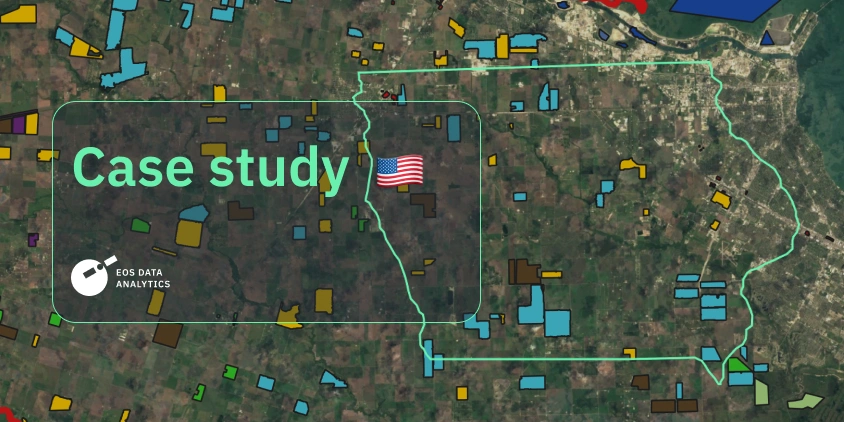
Mapping Iowa: Smarter Crop ID And Field Boundaries
Iowa’s landscape tells a story of agriculture woven into its very fabric. This state is devoted to farming. Iowa embodies the quintessential image of American agriculture, from rolling fields of corn and soybeans to barns sheltering cattle. But it’s not just tradition fueling this state — it’s innovation. Leading the nation in corn, soybean, ethanol, and biodiesel production, Iowa feeds the US and the world while setting the bar for sustainability.
Along with sustainability and innovation comes the need to classify crops and detect field boundaries, which can prove to be difficult due to the region’s diverse farming practices and land use patterns. EOSDA’s science team decided to see if our ML models could produce satisfactory results in the area of the US’s Corn Belt. Read on to know how they did it.
| Challenge | Iowa’s farmers use diverse farming practices and land use patterns, so crop classification and field boundary detection require the use of satellite data. |
| Solution | EOSDA utilized satellite imagery with an advanced ML model, Conv-LSTM, to automatically identify crop types and detect field boundaries. |
| Outcome | The project successfully classified different crops and land types, as well as accurately detected field boundaries across Texas. |
Overview: Iowa’s Agriculture Market
Iowa isn’t just a leader in agriculture; it’s a living, breathing farming legacy. With over 85% of its land farmed, agriculture is more than an industry here but rather a way of life. Iowa has about 86,600 farms . In 2023, those covered a staggering 30.6 million acres . Among those, cropland accounts for 26.3 million acres, producing top-tier crops like corn, soybeans, and alfalfa that dominate the state’s vast fields.
Known as the nation’s top producer of corn, soybeans, ethanol, and biodiesel, Iowa plays a pivotal role in feeding the US and the world. The state’s farmers have also embraced conservation practices, planting nearly 3.8 million cover crops and restoring over 416,000 wetlands to protect soil and water quality.
Iowa’s agriculture industry isn’t just massive; it’s deeply personal. Most of the farms are family-owned, and many carry a legacy spanning hundreds of years. Beyond crops, Iowa ranks highly in livestock. Agriculture supports one in five jobs across the state and contributes $159.5 billion to the economy — almost a third of Iowa’s total economic output.
Whether it’s the endless fields, thriving farmers’ markets, or cutting-edge sustainability efforts, Iowa’s farms truly embody the heartland of America.
Challenge: Diverse Farming Practices And Land Use Patterns
Iowa is an agricultural powerhouse known for its extensive corn, soybeans, oats, and alfalfa fields. However, identifying these crops across such a vast and dynamic landscape using satellite data is not as straightforward as it sounds. For starters, Iowa’s farmlands present a variety of challenges. The state features diverse farming practices and land use patterns that blend agricultural areas with general vegetation, wetlands, and human-made features. That is why crop classification may seem like an unliftable task.
However, EOS Data Analytics did not shy away from the challenge and wanted to evaluate how well the Conv-LSTM-based model — a neural network designed for time-series satellite data — could tackle the challenge. The goal was to classify five target crop types: corn, soybeans, oats, alfalfa, and a category labeled “other crops,” along with broader land-cover types like grasslands, forests, and water.
Another layer of complexity is that Iowa’s growing season spans April to October, with crops maturing and changing throughout the season. This required the model to account for these time-based changes, relying on Sentinel-2 satellite imagery to capture the evolving vegetation. EOSDA wanted to go one step further — testing whether the model could detect field boundaries.
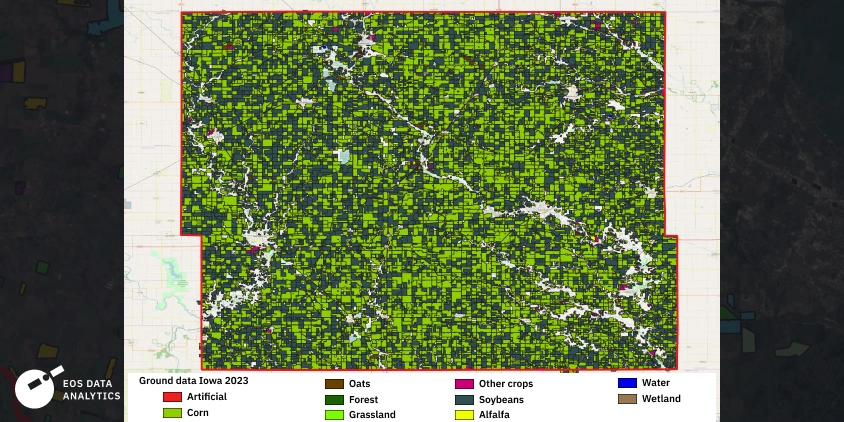
In short, the team faced a tall order: analyze a diverse region with varying vegetation, produce accurate results, and identify any gaps in the system for future improvements. In the entire state, four counties were chosen: Franklin, Hamilton, Hardin, and Wright.
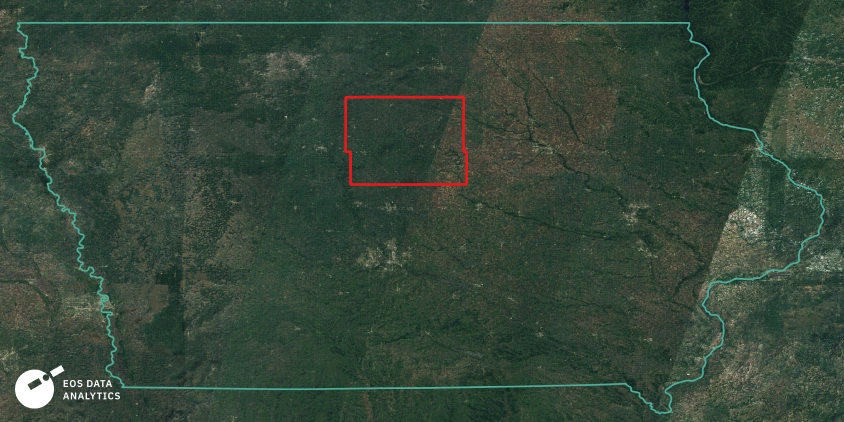
Iowa is a part of the so-called Сorn Belt. We were interested in experimenting there because it is a developed agricultural region.
Solution: Space And Time Analyzed Through Neural Model
EOSDA leaned on their Conv-LSTM model, a cutting-edge neural network combining convolutional and long short-term memory methods to tackle these challenges. The model was designed to analyze satellite imagery in space and time, making it ideal for Iowa’s dynamic growing season.
Here’s how the team approached the project step by step.
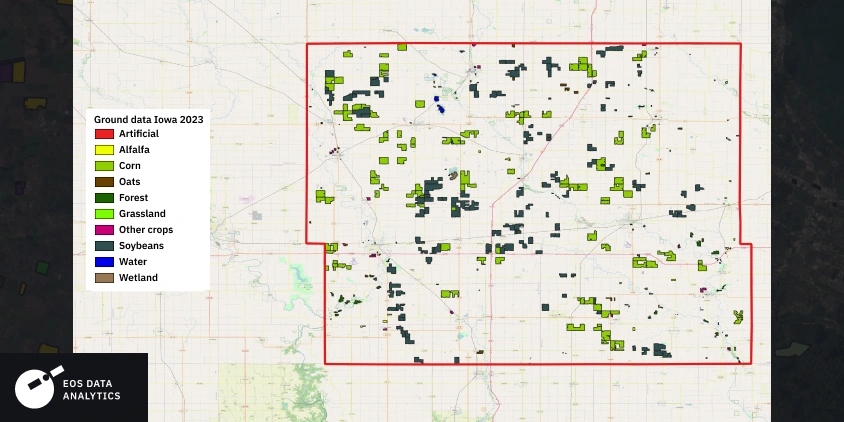
The first step was ensuring the model had high-quality training data. The team gathered ground truth data (GTD) from the USDA’s National Agricultural Statistics Service. This dataset provided a comprehensive list of 46 land-cover classes for Iowa, which EOSDA narrowed down to the most relevant ones for this project.
The team cleaned and validated the data to be compatible with their model. They unified class names and focused on creating accurate training polygons by comparing USDA data with Sentinel-2 satellite images. For added precision, they manually marked up additional classes like artificial surfaces, bareland, and wetlands to help the model distinguish agricultural lands from non-agricultural areas.
EOSDA’s science team knew the timing was everything. To make sure the model focused on the right periods for crop growth, they analyzed Iowa’s planting and harvesting calendar. For example, corn planting typically begins in late April and wraps up by late May, while soybeans are planted in mid-April and harvested in early October. Using this information, they filtered the Sentinel-2 imagery to include only the growing season, capturing the vegetation’s full lifecycle.
The Sentinel-2 satellite, with its high-resolution 10-meter imagery and multispectral capabilities, was the backbone of the project. EOSDA used specific bands that highlight vegetation health and soil characteristics, such as the red, green, and shortwave infrared bands. Only images with less than 50% cloud cover were selected to ensure consistency, resulting in a time-series dataset spanning April to October 2023.
Once the data was ready, the Conv-LSTM model was trained using the 2023 season’s data. The model classified the five target crop types and broader land-cover categories across the four counties in the study area. To push the boundaries (literally), EOSDA also tested the model’s ability to detect field edges. This wasn’t about matching official cadastral boundaries but instead using satellite data to identify the natural divisions between fields based on the contrast in vegetation and soil features.
Outcome: Crops Classified And Field Boundaries Detected
The results of the project were encouraging, showing that EOSDA’s crop classification model could hold its own in Iowa’s complex agricultural landscape.
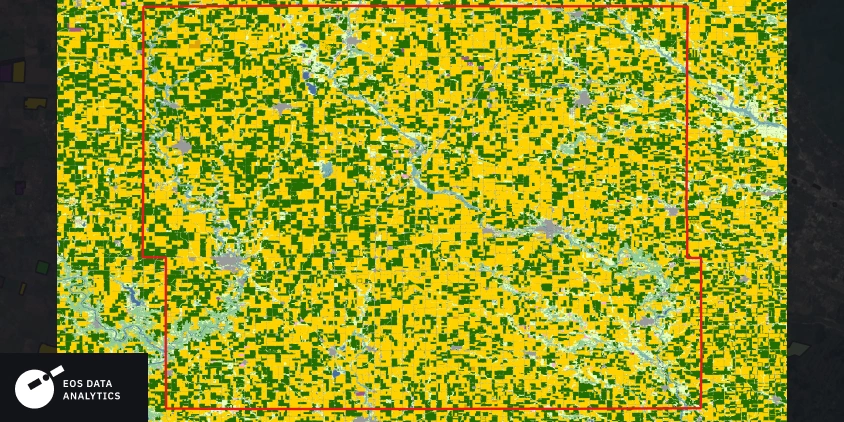
The specifics of this project were quite interesting. In the area of interest, almost 100% of the area is divided between corn and soybeans. Because there are only two dominant crops and also large fields mostly with correct shapes, the classification was much easier, and the accuracy was better for this region than, for example, for Texas, not to mention Asia and Africa, where the fields are hundreds of times smaller.
The classification results aligned well with USDA data, demonstrating that the model could effectively distinguish between different crops and land-cover types. EOSDA science team compiled maps of the area that showed the spatial distribution of corn, soybeans, oats, alfalfa, and other crops. These outputs, delivered in formats like GeoTIFF and PNG, provided actionable insights for stakeholders.
While the model performed well overall, some challenges surfaced. For instance, the model struggled with the “wetland” category, often confusing it with agricultural fields. This issue stemmed from the overlap between wetlands and farmlands, highlighting the need for additional training data and fine-tuning of the model.
The field boundary detection experiment also yielded positive results. The model successfully identified boundaries in the test area with up to 90% accuracy, though it relied on contrast in satellite imagery rather than official cadastral data. This showed promise for future applications but also underscored the need for caution when interpreting boundary data.
Perhaps the most exciting takeaway was the project’s scalability potential. EOSDA’s science team concluded that there were no major technical barriers to expanding the model’s use across other counties in Iowa or even nationwide. The technology could be easily used for large-scale agricultural monitoring with a few tweaks.
This project showed that advanced ML models like Conv-LSTM can handle the complexity of agricultural classification, even in challenging regions like Iowa. It’s a win for EOSDA and anyone looking to leverage satellite data for more intelligent and efficient farming. By combining cutting-edge technology with careful data preparation and validation, EOSDA has laid the groundwork for future innovations in precision agriculture. The potential to scale this approach across the US and beyond is undeniable.
About the author:
Kseniia Kunakh has over 6 years of writing experience, working in various domains, including business, educational, and media-directed texts. Kseniia’s previous experiences as a development manager in a Ukrainian eco-NGO and as a talent matcher in an IT company make her a perfect combination of someone who is passionate about eco-tech innovations and can communicate about them with ease.
Recent articles
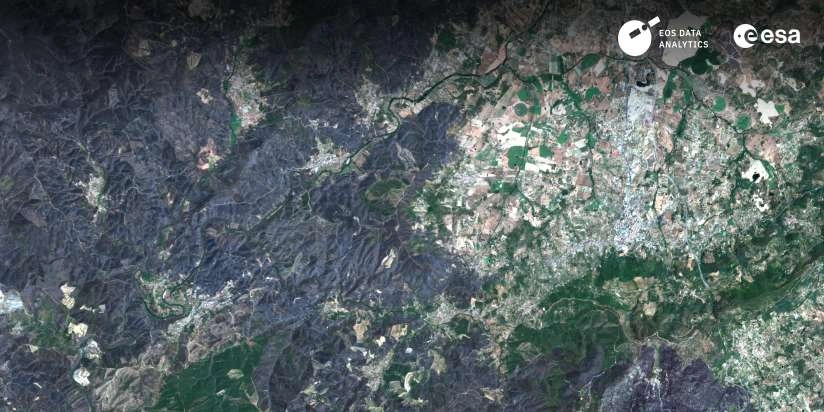
EOSDA to Monitor Wildfires in Portugal Using Satellite Data Under ESA’s InCubed Programme
The company signed a contract with ESA to create an innovative satellite-based solution for forest monitoring and wildfire prevention.
EOSDA Forecasts Yields For 2025 In Saskatchewan
EOSDA created RM-level crop yield forecasts for Saskatchewan to address limitations of official data. The project shows how satellite and weather inputs reveal local yield changes during the season.
Digital Tools Improve Soil Health And Yields In Mexico
EOSDA and ITTA supported a Guanajuato farm with contour-line planning, monitoring tools, and practical guidance to reduce soil erosion and improve yields in the long run.