EOSDA Validates Sugarcane Mapping In São Paulo
Brazil’s São Paulo state is a powerhouse in sugarcane production, yet accurately mapping this vast crop can be a daunting task.
EOS Data Analytics set out to verify its innovative classification technology in this complex landscape. The focus was on validating the model’s accuracy and potential for broader use. Read on to find out how effective this approach was in mapping one of the world’s largest sugarcane-producing regions.
| Challenge | Verifying EOSDA’s sugarcane classification model in a diverse agricultural area of São Paulo. |
| Solution | EOSDA utilized Sentinel-2 satellite imagery and Conv-LSTM deep learning models to classify sugarcane fields and detect field boundaries. |
| Outcome | EOSDA’s team accurately predicted sugarcane yields. |
Overview: São Paulo, Brazil’s Agricultural Hub, Faces Troubles
São Paulo is a major agricultural hub in Brazil, known for its diverse and high-quality production. The state’s agricultural sector contributes around 12.5% to Brazil’s total agricultural income . Key products include sugarcane, oranges, coffee, soybeans, maize, bananas, peanuts, lemons, persimmons, tangerines, cassavas, carrots, potatoes, and strawberries.
In recent years, São Paulo has faced significant challenges due to severe droughts and wildfires. In 2024, the state experienced its worst drought in over seven decades, severely impacting coffee plantations and leading to reduced yields . Additionally, extensive wildfires in the same year ravaged over 34,000 hectares, causing substantial agricultural and environmental losses.
Despite these adversities, São Paulo’s agricultural sector remains resilient, continuing to play a crucial role in Brazil’s economy .
Challenge: The Need For Precise Sugarcane Mapping
Although agriculture in São Paulo contributes significantly to Brazil’s economy, monitoring and managing such an extensive area — particularly in the eastern part of the state, where sugarcane dominates — is fraught with challenges. Field-level data validated by direct observation is often unavailable, outdated, or prohibitively expensive to gather.
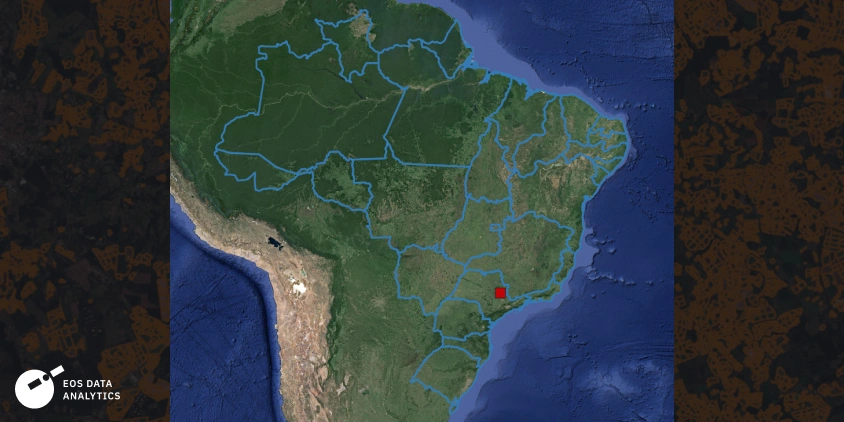
The main goal of this project was to validate EOSDA’s sugarcane classification technology by testing its performance in a real-world scenario. The chosen area of interest was in São Paulo since this region is a hub of agricultural activity, and its diverse land cover featuring various types of crops and cover posed a challenge for accurate classification.
To ensure the model’s reliability, the exact AOI had to meet specific criteria. It was selected based on the following considerations:
- High Agricultural Significance: The region is a historical center for sugarcane cultivation, which makes it a perfect testing ground for the model.
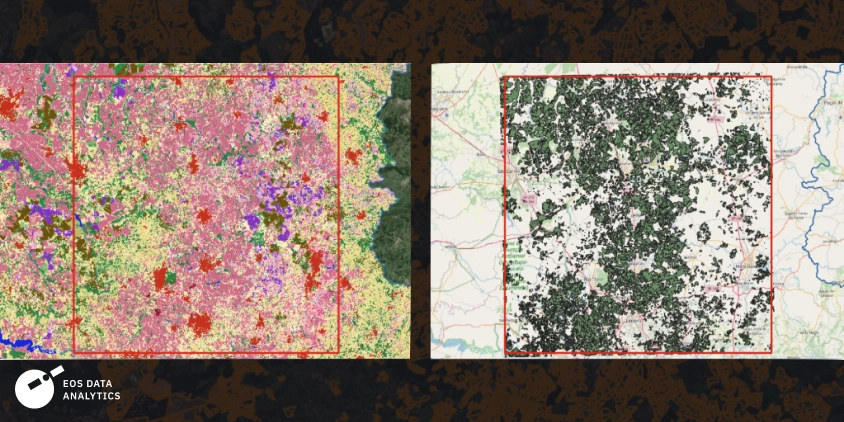
- Availability of Historical Data: The area had a substantial amount of historical ground truth data from the 2022 season, sourced from MapBiomas Brazil. This data included 29 land cover classes and provided a strong foundation for validating model predictions.
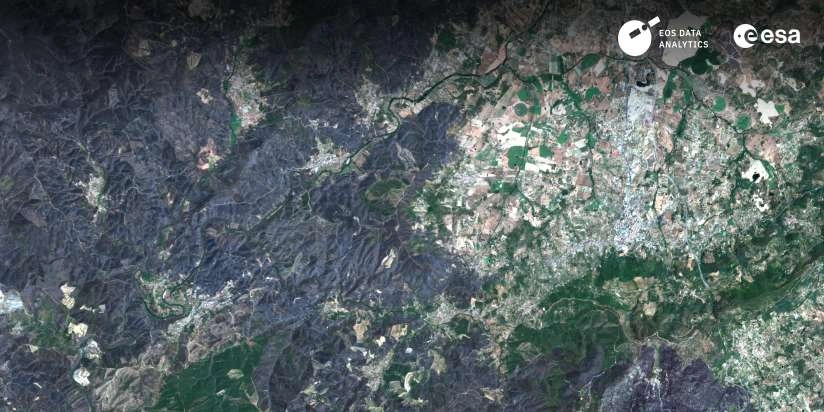
- Satellite Image Quality: A tile of Sentinel-2 imagery was chosen because it offered sufficient cloud-free images across the sugarcane growing season, a critical factor for robust classification.
These criteria ensured that the selected AOI could effectively test the model’s ability to distinguish sugarcane fields from other land cover types under real-world conditions.
Solution: A Step-by-Step Validation Of Sugarcane Classification
EOSDA designed and implemented a systematic approach to validate its sugarcane classification technology. This process involved several key stages.
First, the team collected a time series of Sentinel-2 images covering the entire 2023-2024 sugarcane growing season. These images, with cloud coverage below 40%, were preprocessed to correct for atmospheric effects and prepare them for analysis.
Then, EOSDA’s GIS experts analyzed and refined the ground truth data from MapBiomas Brazil’s 2022 season. This included converting raster data into vector polygons and adding key land cover classes to ensure the model could separate sugarcane fields from other areas.
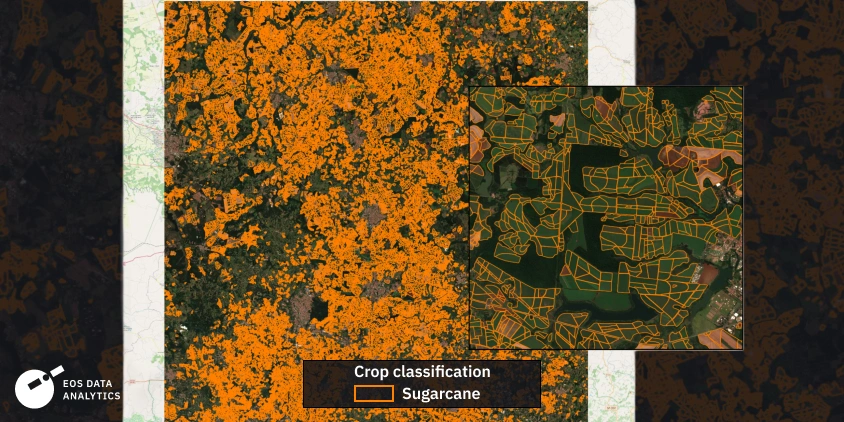
Once data was ready, EOSDA trained its Conv-LSTM model to classify land cover types using Sentinel-2 spectral bands, including RGB, near-infrared, and vegetation red-edge bands. This multi-level architecture enabled the model to analyze both spatial and temporal patterns, critical for differentiating sugarcane from other vegetation.
Finally, classification focused on two primary target classes (sugarcane and other crops) and four general classes (artificial, forest, water, and other vegetation). EOSDA also tested its field boundary detection solution, which uses satellite imagery and contrast differences to outline field borders.
The results were validated against the ground truth data. Deliverables included classification maps, vector layers, and shapefiles, all tailored for integration into geospatial analysis tools.
Outcome: Demonstrating Reliable Sugarcane Classification
With this project, the EOSDA team successfully validated its sugarcane classification technology. The classification results aligned closely with historical ground truth data from MapBiomas Brazil and confirmed the model’s ability to detect sugarcane fields and differentiate them from other land cover types.
The use of MapBiomas ground data turned out to be critical for the project’s success. This dataset offered a reliable benchmark for validating the classification results and also enabled EOSDA to refine its model for São Paulo’s specific agricultural context.
The analysis also highlighted some challenges, such as difficulty in distinguishing crops from visually similar vegetation like pastures, which the team identified as a target for future improvements.
Nevertheless, the project demonstrated the model’s scalability and reliability. The technology’s performance in São Paulo confirmed its potential for broader application in other regions and crop types.
By validating its technology under real-world conditions, EOSDA reinforced its capability of delivering actionable insights for complex agricultural landscapes.
About the author:
Maksym Sushchuk is at the forefront of realizing EOSDA's vision to make space tech a global driver of sustainability on Earth. He has over 15 years of experience in journalism and content creation for prominent Ukrainian startups, charitable funds and ESG businesses. As Head and Co-founder of PR Army Maxim brings attention to the human and social tolls of the aggression against Ukraine.
Recent articles
EOSDA to Monitor Wildfires in Portugal Using Satellite Data Under ESA’s InCubed Programme
The company signed a contract with ESA to create an innovative satellite-based solution for forest monitoring and wildfire prevention.
EOSDA Forecasts Yields For 2025 In Saskatchewan
EOSDA created RM-level crop yield forecasts for Saskatchewan to address limitations of official data. The project shows how satellite and weather inputs reveal local yield changes during the season.
Digital Tools Improve Soil Health And Yields In Mexico
EOSDA and ITTA supported a Guanajuato farm with contour-line planning, monitoring tools, and practical guidance to reduce soil erosion and improve yields in the long run.