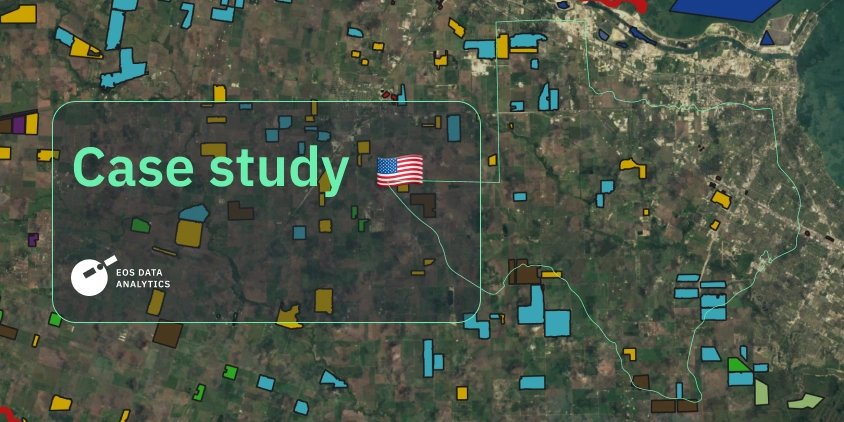
Boundaries And Crop Types: A Custom Project In Texas
Texas, a cornerstone of America’s agriculture, is home to vast farmlands and a diverse range of crops, playing a critical role in both national and global food supply chains. With the majority of the state dedicated to farmland, Texas farmers support the food and fiber needs of millions. However, tracking and managing this agricultural expanse has long been a challenge, relying on outdated, labor-intensive methods that fail to provide the precise and timely data required for modern farming practices.
EOS Data Analytics (EOSDA), a global provider of AI-powered satellite imagery analytics, decided to leverage its power to help Texas growers change crop monitoring. EOSDA’s science team combined their collective intelligence with an advanced ML algorithm. What was the result? A new approach that enhances efficiency and provides a scalable solution for the future of farming, setting a new standard for agricultural management worldwide.
| Challenge | Traditional methods of crop tracking in Texas, such as manual surveys and basic aerial imaging, proved inefficient, costly, and inaccurate, especially given the state’s vast and varied agricultural landscape. |
| Solution | EOSDA utilized satellite imagery with an advanced ML model, Conv-LSTM, to automatically identify crop types and detect field boundaries. This approach allowed for a more efficient, scalable, and accurate solution. |
| Outcome | The project successfully classified various crops and accurately mapped field boundaries across Texas. |
Overview: Texas’s Crops
Texas, the backbone of America’s agricultural industry, hosts the largest scale farming operations in the nation, with 86% of the state dedicated to farmland. Each Texas farmer supports food and fiber needs for about 155 people, making the state crucial to both national and global food security . The diverse climate, with varying temperatures and weather conditions, creates an ideal environment for growing various crops and raising livestock year-round. This abundance supplies fresh produce and natural fibers to local communities and fuels the national and international markets.
Agriculture is more than just an economic driver for Texas; it’s a lifeline for rural communities, generating significant employment opportunities. With a vast majority of farms family-owned, the industry is a cornerstone of Texas life, contributing to its low unemployment rate and ranking it second in the nation for GDP. Despite a decline in the number of farms, the value of agricultural products surged from $24.9 billion in 2017 to $32.2 billion in 2022 . Leading the nation with over 230,000 farms covering 125.5 million acres, Texas remains a powerhouse of agricultural production.
With such a climate diversity, this state produces many crops, among which cotton and corn are prominent. Cotton has been a cornerstone of Texas agriculture for over a century. Texas has accounted for approximately 37.5% of the US total cotton output in recent years, with an average annual harvest of 5.8 million bales since 1996 . Cotton in Texas is mainly machine-harvested and is vital in various industries, including ginning, oil milling, and textile manufacturing.
Corn has also emerged as a major crop in Texas, particularly since the 1970s, with the development of high-yield hybrids. In 2018, Texas farmers harvested 1.8 million acres of corn, producing 108 bushels per acre. The total value of the corn crop was $774.9 million that year. In 2024, that number rose to 121 bushels per acre, with 215 million bushels gathered . Most of the corn produced in Texas is used for livestock feed, but it also plays a significant role in the ethanol and food product industries. Corn production is concentrated in Central and South Texas, reflecting the region’s favorable growing conditions.
While cotton and corn are the leading crops, Texas’s diverse agricultural landscape also supports the production of grain sorghum, rice, wheat, and forage crops. Though not as dominant, these crops contribute to the state’s agricultural output and provide additional support for the rural economy and food security.
Challenge: Ineffective Manual Methods Of Crop Tracking
Managing an area as vast as Texas state comes with significant challenges. With the variety of climates, soil types, and crops, it is hard to track what’s being grown and where. This information is crucial for managing resources better, predicting harvests, and making informed farming decisions. Though local farmers have used traditional methods of crop monitoring for centuries, they often involve people manually surveying the land, which might be slow, expensive, and ineffective in such a large and diverse area like Texas.
The more modern method of using simple aerial photos might not provide detailed, up-to-date information to make quick, accurate decisions. Flying a vehicle to take pictures of the land, be it a UAV or an airplane, produces additional climate impact, does not always consider different land elevations, and gives out tons of pictures that must be stitched together to create one comprehensive image.
Considering all of that, satellite imagery analytics is cost-effective, relatively fast, and scalable, meaning that the same instruments can be used for various tasks. EOS Data Analytics decided to tackle the challenge of creating a system that could automatically and accurately identify different crops and map out field boundaries across Texas. The EOSDA’s science team aimed to do this using satellite images combined with advanced machine learning algorithms.
Solution: Sophisticated Software And Human Intelligence
To solve the problem, EOSDA’s team used high-tech satellite images and sophisticated computer models. The scientists chose five counties we already encountered before during our journey into Texas cotton yield prediction methods. The counties were Lubbock, Hale, Lynn, Crosby, and Nueces.
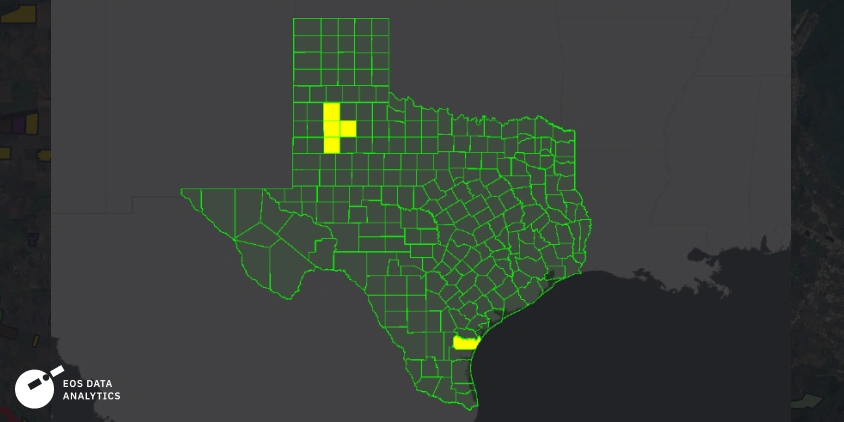
Those counties are with the biggest cotton production land, so that is why they were chosen for the task.
The core of the solution was a special type of machine learning model called Conv-LSTM. This model is powerful because it can look at images over time, helping to track how crops grow throughout the season. The Conv-LSTM model used images from the Sentinel-2 satellite, which captures detailed pictures in different light colors, including some that the human eye can’t see. These images help distinguish between different types of crops and other land features like forests, water bodies, and bare land.
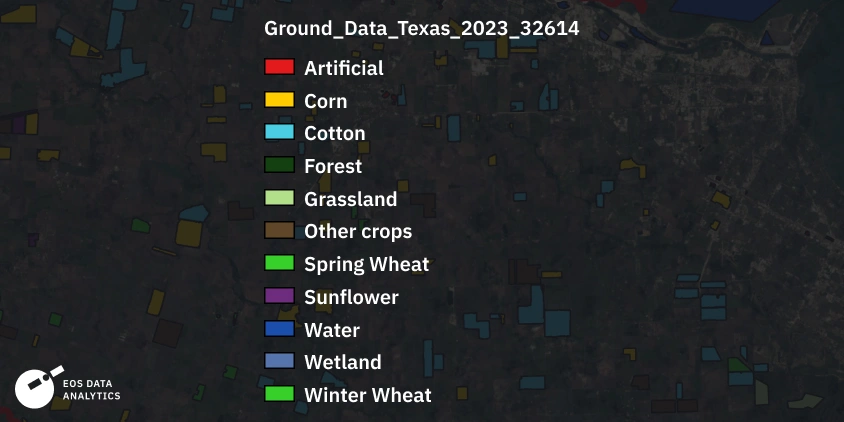
A key part of the project was gathering accurate on-the-ground data from the US Department of Agriculture. This data included maps showing where different crops were planted. The EOSDA’s scientists used this data to train the model, ensuring it could accurately identify and classify different types of crops from the satellite images.
The science team cleaned the data to fit the requirements, merged it to train the model, and carried out a markup of “general” classes of land cover from agricultural lands.
We conducted a basic data validation and removed suspicious pieces of information in order to train the model correctly.
The project focused on the whole growing season of 2023, from April to October. The model could learn the growth patterns of crops like cotton, corn, and wheat by looking at satellite images taken during this period. This was important because different crops grow and change uniquely throughout the season.
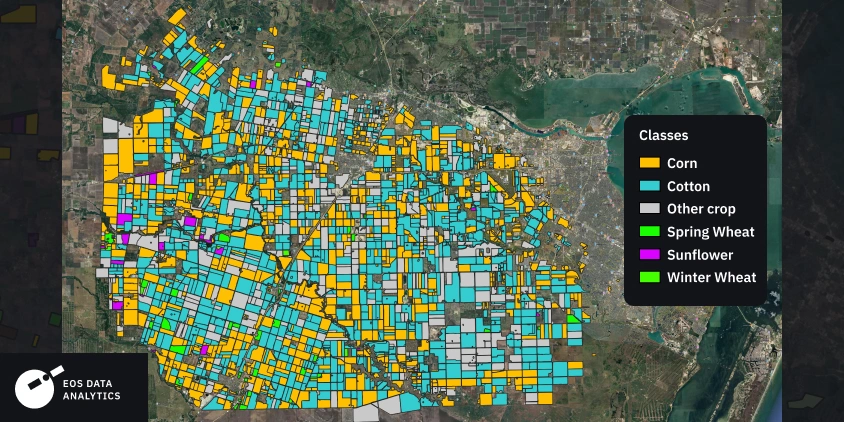
One of the most impressive features of the solution was its ability to classify crops accurately. The model did an excellent job with cotton, a major crop in Texas, but it also successfully identified other crops and classes of land. Those classes included corn, cotton, forest, spring wheat, winter wheat, grassland, artificial, sunflower, water, wetland, and other crops. This was made possible by the model’s ability to analyze how each crop grew over time using satellite images.
Outcome: Crop Classification And Field Boundary Detection Done
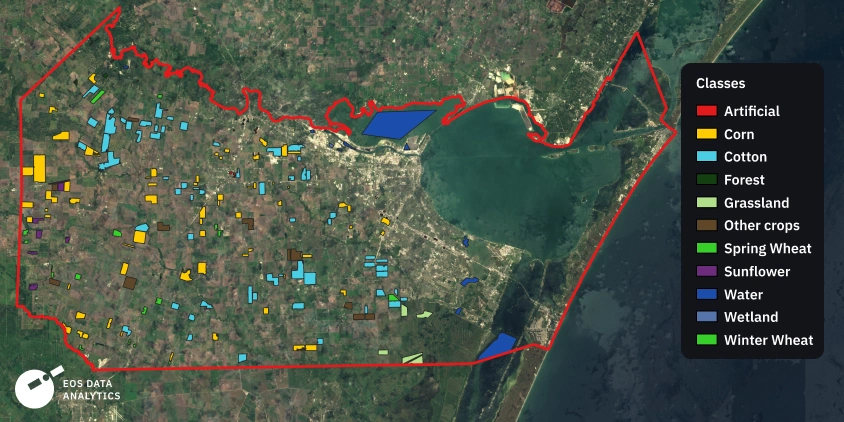
The results of the project were solid. EOSDA’s technology showed it could accurately identify different crops and map out field boundaries across Texas, confirming the system’s accuracy by comparing its results to the on-the-ground data provided by the USDA. This comparison showed that the model was very good at separating different crops.
This project wasn’t very complex, but we needed to find ground data to train the model and validate it to ensure a successful project.
The project produced several important outputs, including detailed maps showing where various crops were grown and the boundaries of each field. These maps are valuable tools for farmers, policymakers, and others involved in agriculture, as they provide clear and detailed information that can be used for planning and decision-making.
In addition to the maps, the team generated reports that offered insights into the distribution of crops across the area. These reports are crucial for helping agricultural planners and policymakers understand the current state of farming in Texas and make informed decisions.
The success of this project proved that combining raw data sets with advanced ML models is highly effective and could be used in other regions as well. The system is scalable and can be applied to monitor agriculture in different parts of the world, not just Texas. This makes it an efficient tool for global agricultural monitoring.
The broader implications of the project are significant. Using satellite images and AI, EOSDA has created a system that provides real-time, accurate crop types and field boundaries data. This helps make agricultural management more efficient, reduces the need for manual surveys, and supports sustainable farming practices.
The EOSDA science team approach also demonstrates the importance of integrating different types of data — ground-based information, satellite images, and advanced models — to create a comprehensive solution. This integration not only improves the accuracy and reliability of the data but also ensures that the system can adapt to different environmental and farming conditions.
About the author:
Kseniia Kunakh has over 6 years of writing experience, working in various domains, including business, educational, and media-directed texts. Kseniia’s previous experiences as a development manager in a Ukrainian eco-NGO and as a talent matcher in an IT company make her a perfect combination of someone who is passionate about eco-tech innovations and can communicate about them with ease.
Recent articles
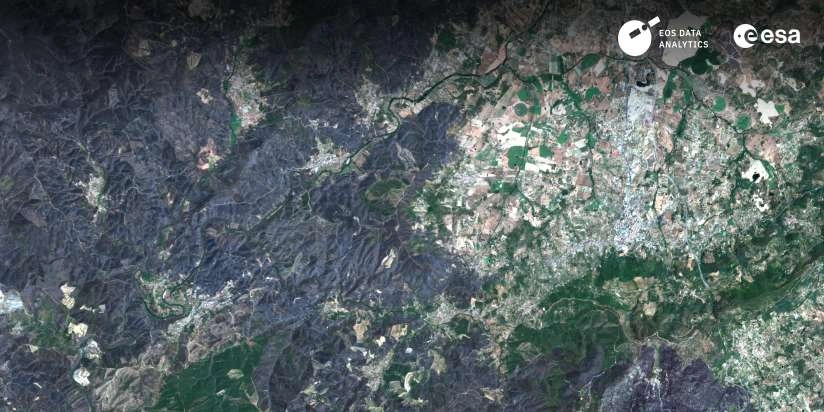
EOSDA to Monitor Wildfires in Portugal Using Satellite Data Under ESA’s InCubed Programme
The company signed a contract with ESA to create an innovative satellite-based solution for forest monitoring and wildfire prevention.
EOSDA Forecasts Yields For 2025 In Saskatchewan
EOSDA created RM-level crop yield forecasts for Saskatchewan to address limitations of official data. The project shows how satellite and weather inputs reveal local yield changes during the season.
Digital Tools Improve Soil Health And Yields In Mexico
EOSDA and ITTA supported a Guanajuato farm with contour-line planning, monitoring tools, and practical guidance to reduce soil erosion and improve yields in the long run.