Landsat 8 images: Reliable satellite data for long-term analysis
Get Landsat 8 wide-swath, medium-resolution, and high-frequency multispectral satellite imagery on the EOSDA LandViewer platform:
-
Spatial resolution
15 m (panchromatic), 30 m (multispectral), 100 m (thermal)
-
Scene size
185 × 180 km
-
Revisit time
Every 16 days
-
Data archives
From 2013 to present
-
Spectral bands
11 bands, covering coastal, NIR, SWIR, and thermal
-
Analytical tools
Change detection, clusterization, time series analysis
How to get Landsat 8 satellite images on EOSDA LandViewer
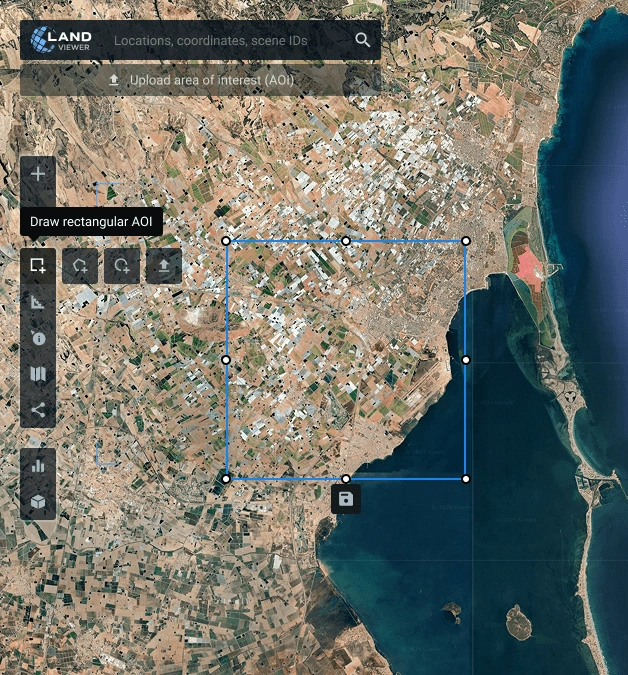
Define your AOI (area of interest)
Specify the AOI to monitor: search for a location and manually draw an area on the Landsat map or upload a predefined area from your device.
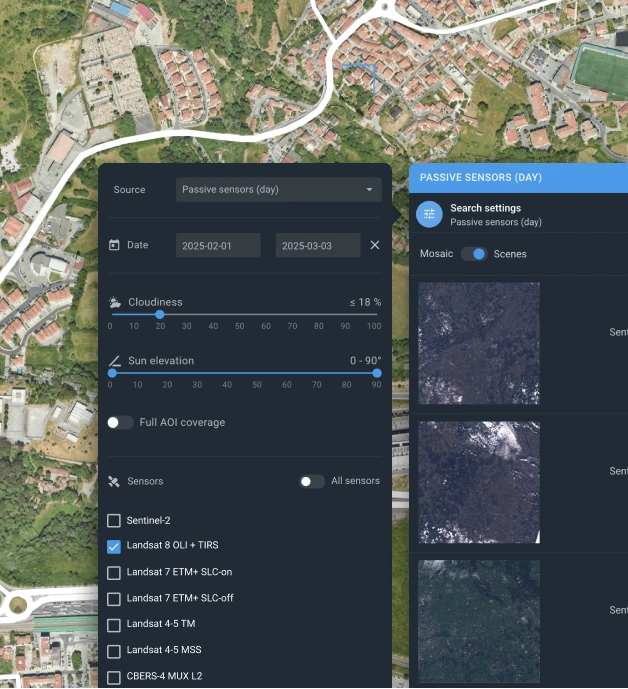
Refine your search with filters
Use filters to refine your search and easily find relevant Landsat 8 satellite images based on date, cloud cover, sensor, and AOI coverage.
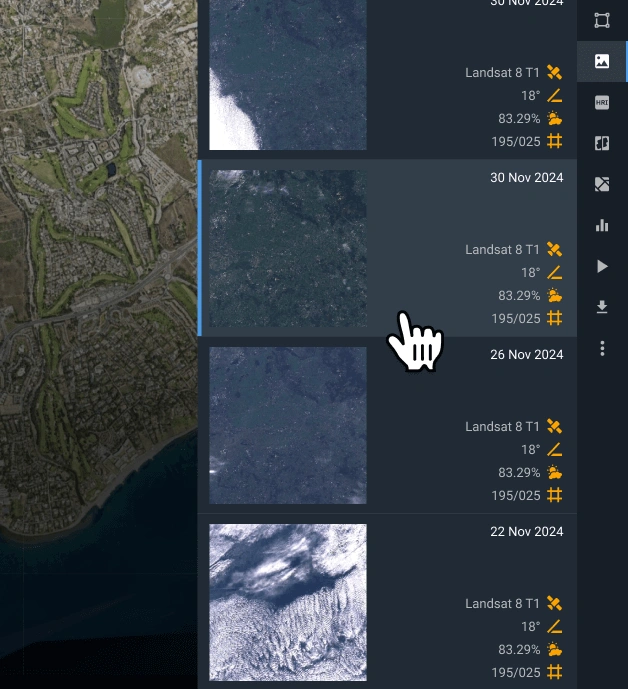
Pick the scene matching your criteria
Go through the filtered options and select the scene that aligns with your project goals.
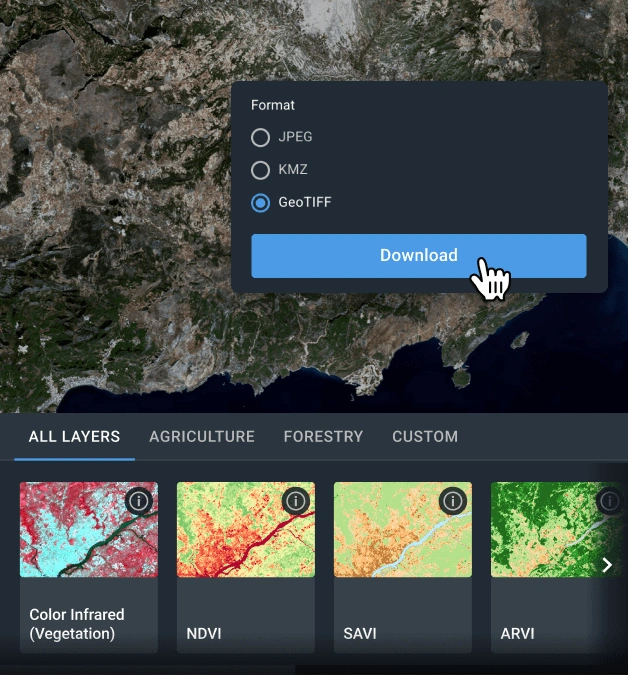
Export data or conduct on-platform analytics
Once you’ve selected the most relevant Landsat 8 data, you can download it in GeoTIF, KMZ, or JPEG format for third-party processing in GIS software (e.g., QGIS or ArcGIS). You can also perform analysis directly on EOSDA LandViewer using in-built indices and band combinations or advanced analytical tools, such as change detection, time series analysis, and clustering.
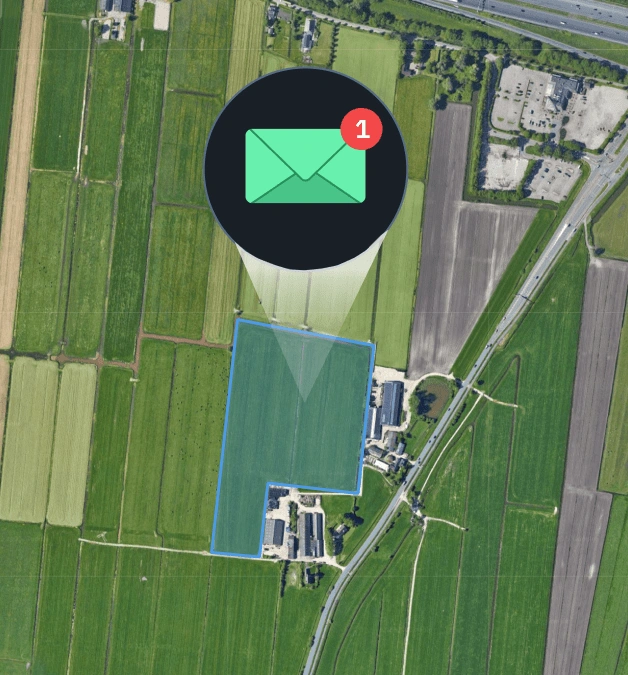
Set up email updates for fresh images
If the most relevant Landsat satellite imagery isn't available right away, enable notifications to get updates when fresh data appears for your area.
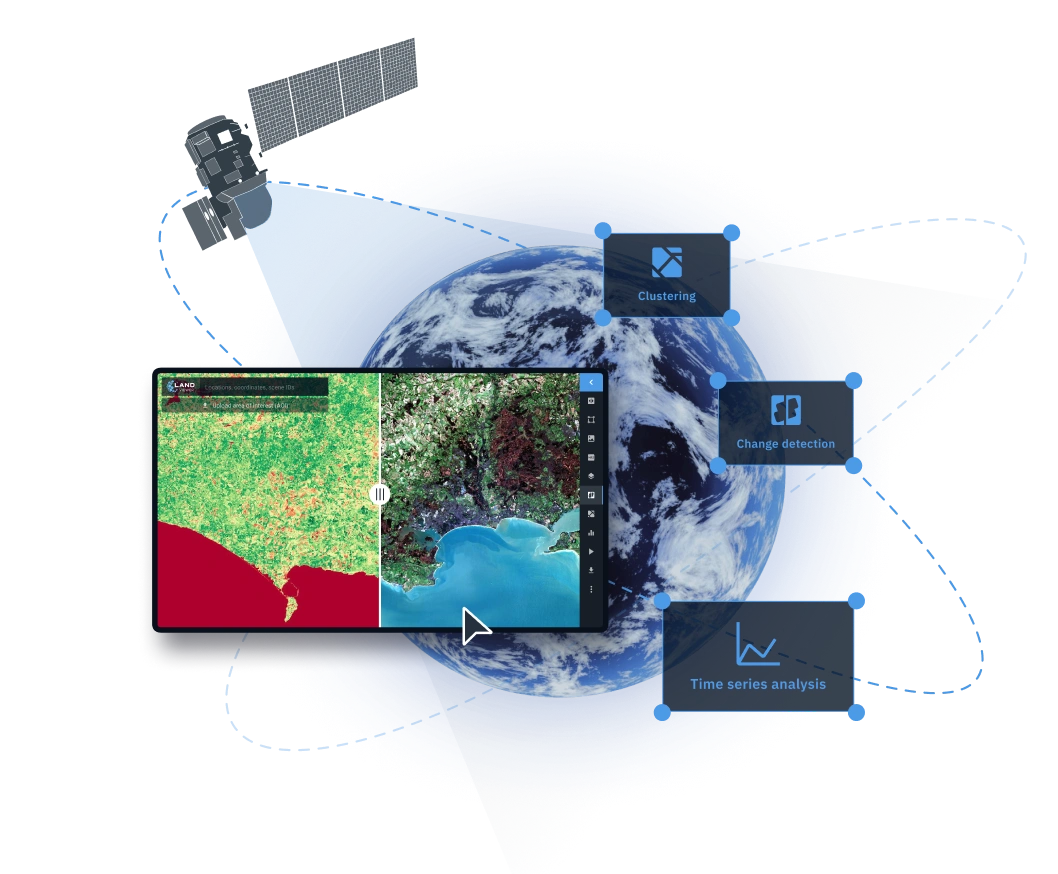
Extract meaningful insights from Landsat 8 satellite imagery with EOSDA LandViewer
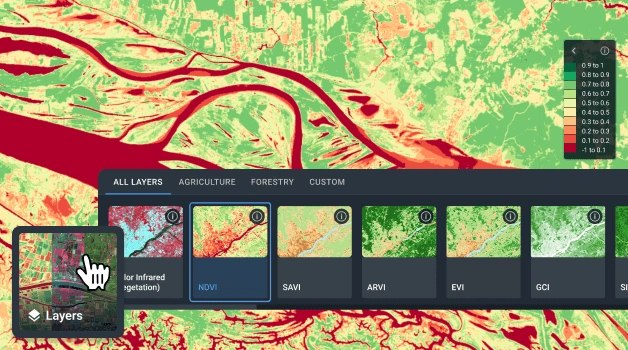
Indices and Band Combinations
For precise feature recognition on Landsat maps, adjust the spectral band selection based on your analysis goals. EOSDA LandViewer features over 20 built-in indices and band combinations designed to provide insights into vegetation conditions, soil characteristics, and environmental disturbances. If none of the preset options meet your specific needs perfectly, you can create and apply custom indices.
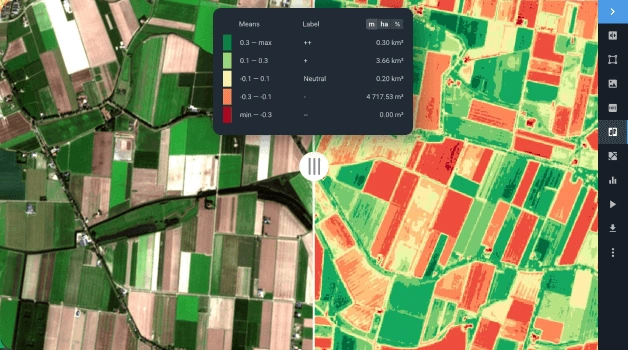
Change Detection
Monitor changes in land features by comparing multiple Landsat 8 satellite images taken at various times. Whether studying urban development, ecological processes, or disaster aftermath, the change detection technology equips decision-makers with insights for risk management and sustainable planning.
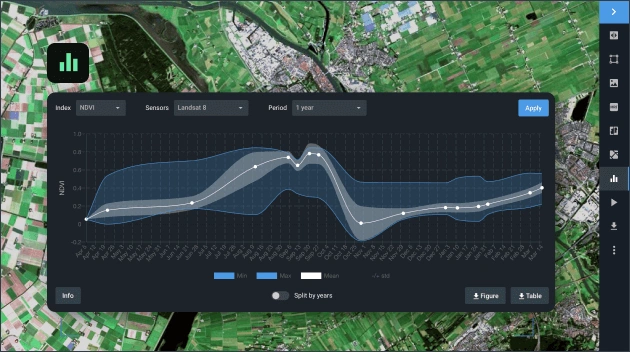
Time Series Analysis
Analyze trends over time by generating spatiotemporal graphs for your AOI. Apply the most relevant indices from our wide range to detect landscape changes, vegetation cycles, or human impact. This tool examines Landsat 8 satellite data across multiple timeframes to illuminate long-term trends, seasonal fluctuations, and the pace of urbanization, fostering better planning and resource use across industries.
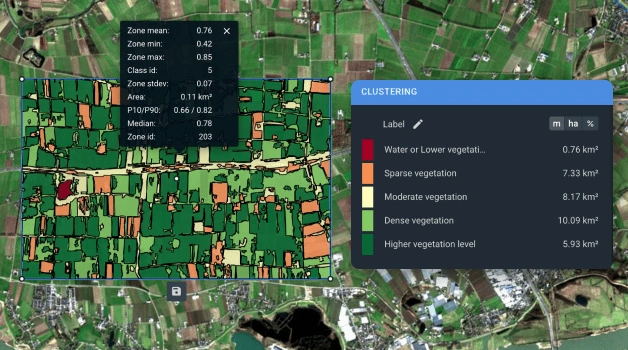
Clusterization
Gain deeper understanding by structuring raw Landsat 8 raster data into meaningful, clearly defined zones with shared index values using clustering and vectorization. These algorithms generate two new layers within your area of interest, which help detect hidden patterns in vegetation, monitor water conditions, and track land cover changes. Industries from agriculture to coastal conservation can benefit from clusterization insights.
Real-world applications of Landsat 8 imagery analytics
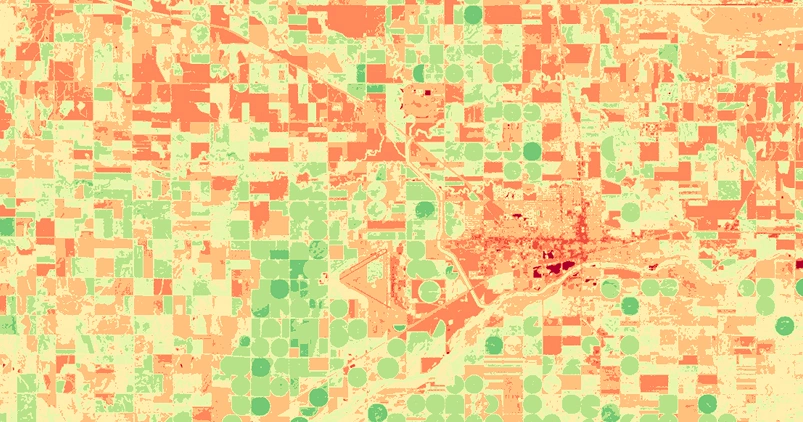
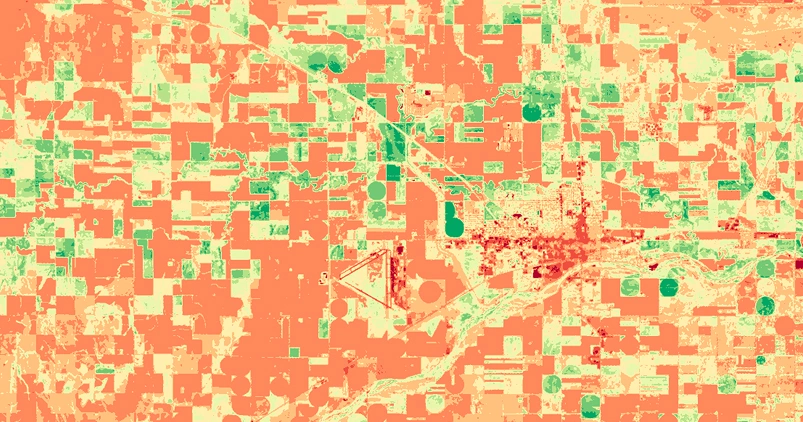
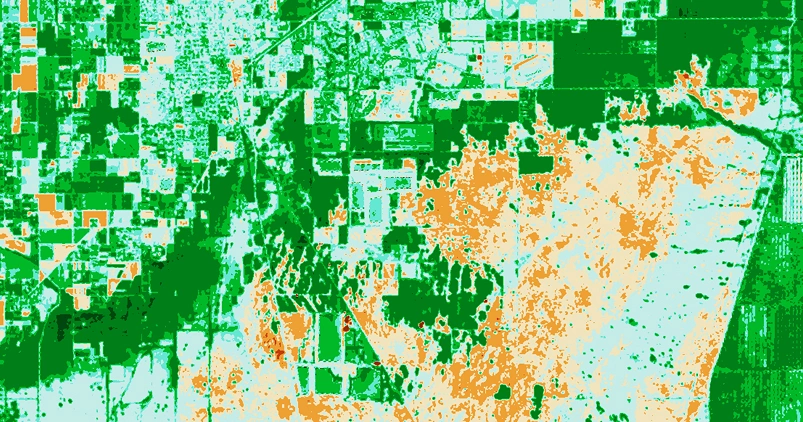
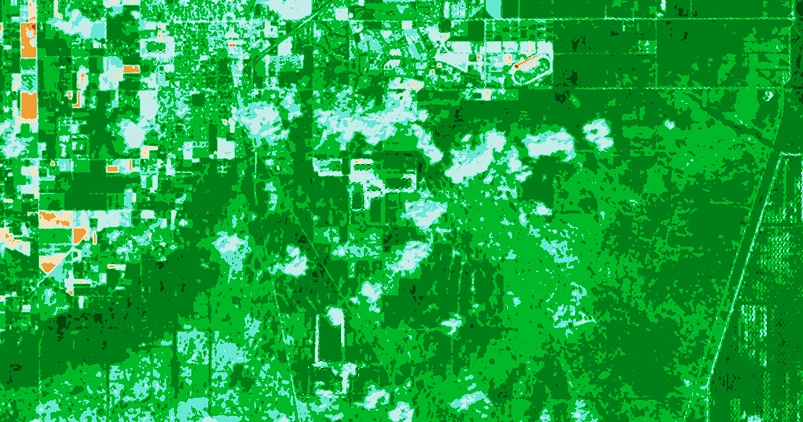
Crop health monitoring
- Great Bend, Kansas, USA
- NDVI index
- May 7, 2024 – Jul 26, 2024
Assessing vegetation loss after wildfire
- Florida City, Florida, USA
- NBR index
- Feb 15, 2024 – Mar 21, 2025
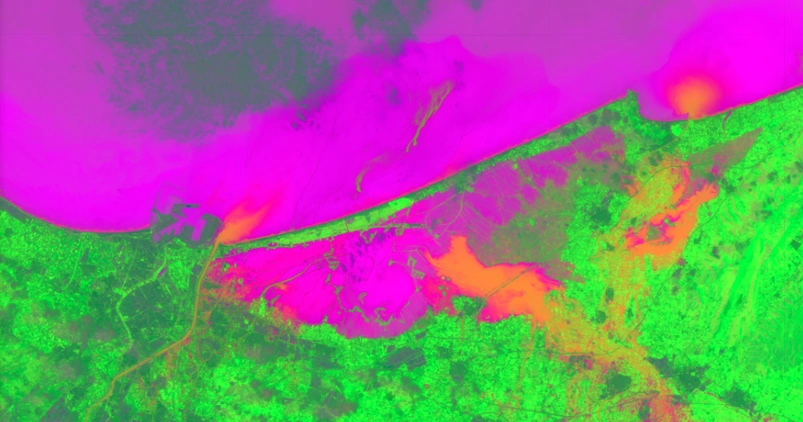
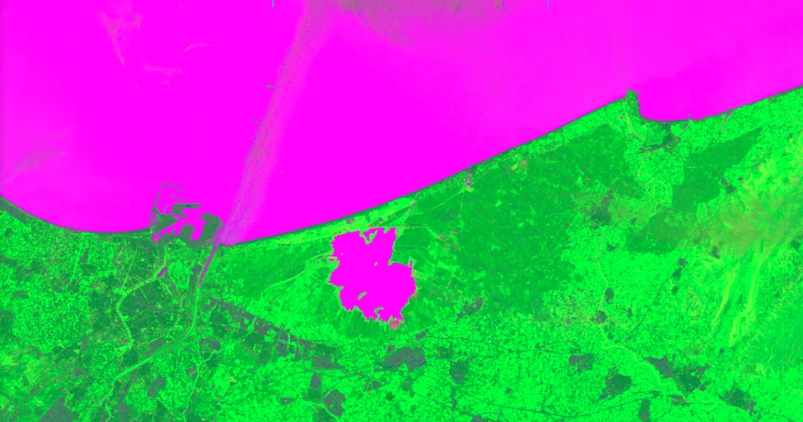
Monitoring flood impact
- Valencia, Spain
- Index stack (NDVI, NDWI, NDSI)
- Oct 5, 2024 – Oct 30, 2024
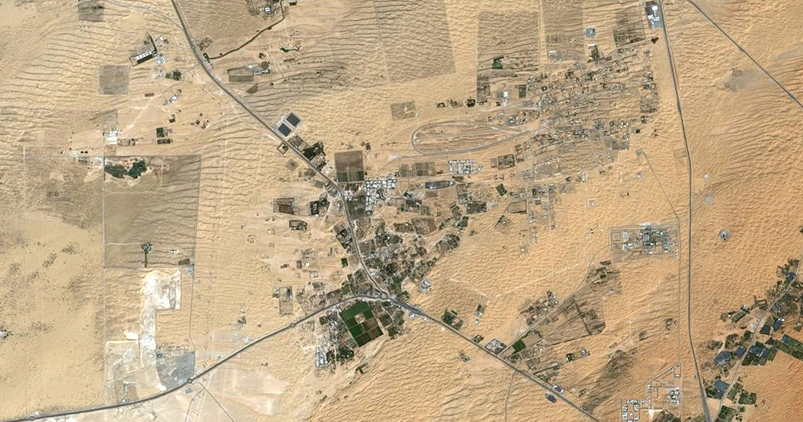
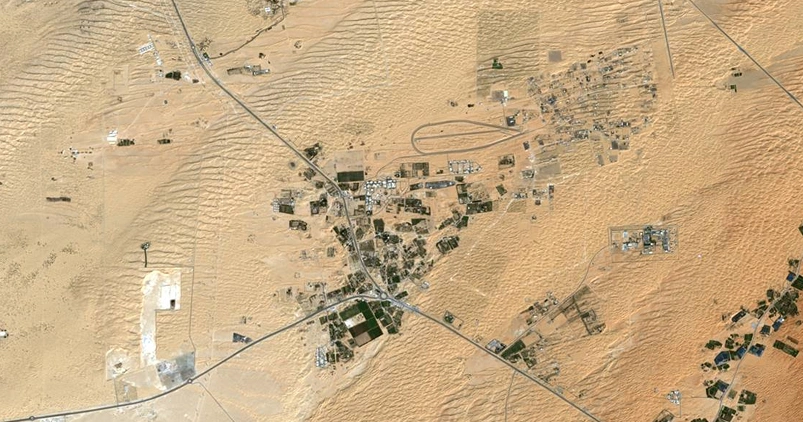
Tracking urban growth
- Lahbab, Dubai, UAE
- Natural color band combination
- Dec 25, 2013 – Jan 24, 2025