Weather Data Analytics On EOSDA Crop Monitoring
Weather intelligence is key to thriving agricultural production.
Effortlessly make sense of daily historical weather data and forecasts on EOSDA Crop Monitoring to streamline crop and fieldwork planning, risk management, and resources.
Why Our Weather Software Stands Out
Our agriculture weather solution holds a competitive edge, offering enhanced accuracy and granular insights into climate in your fields, thanks to:
Global gridded data at a 90x90 meter resolution
Hourly agriculture weather forecasts
Weather analytics based on historical data dating back to 1979
Access to data from ground meteorological stations
Meteorological and vegetation data gathered in one place for deeper insights
A blend of meteorological data from international providers and forecasting models
Intuitive interface that streamlines online workflow
Downloadable Excel reports for further use in business processes
Ways To Benefit From Our Weather Analytics
-
Optimized Water Use
- Keeping tabs on farm's weather with reliable forecasts eliminates guesswork when it comes to watering crops. By tracking rainfall, temperature, and evapotranspiration rates, field managers can irrigate sustainably: avoid over- or underirrigation, conserve water resources, and prevent water or drought stress in crops.
-
Meteorological Risk Reduction
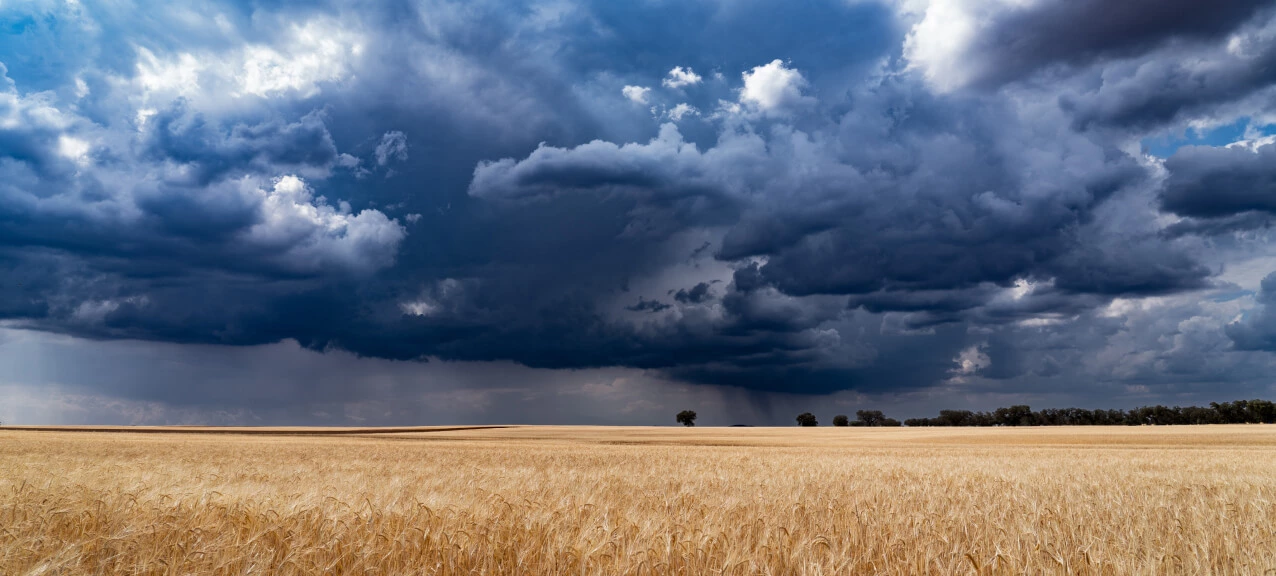
- Natural calamities, such as storms, frosts, and heatwaves hurt agricultural production. Weather apps for farmers prove indispensable, alerting to potential natural risks and enabling on-time damage prevention — reinforcing structures, securing equipment, or adjusting planting dates — to protect infrastructure and crops.
-
Pest and Disease Control
- Unfavorable climatic conditions cause stress in crops, making them vulnerable and elevating the risks of yield loss. Accurate meteorological forecasts help predict the emergence of pests, diseases, or weeds and take timely action to minimize crop damage.
-
Informed Crop and Sowing Planning
- Past weather data and forecasts are the backbone for crop selection and sowing planning. Equipped with historical meteorological records, growers can better predict dates with optimal planting conditions and which varieties are likely to produce lavish yields.
-
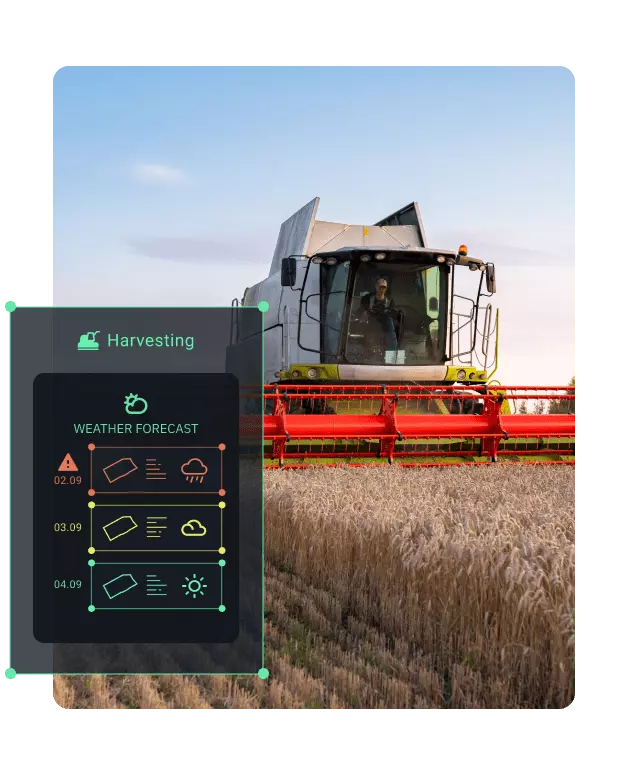
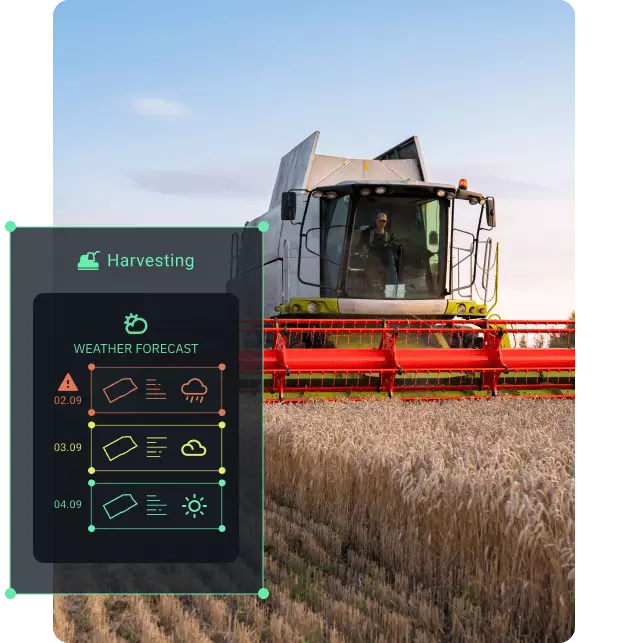
Efficient Harvesting and Storage Planning
- Rainfall amid harvesting brings in significant risks of crop lodging, mold growth, and rotting. Accurate meteorological forecasts come in handy to pick a streak of dry days for reaping and adjust operations to ensure smooth post-harvest management.
Weather Data Available On EOSDA Crop Monitoring
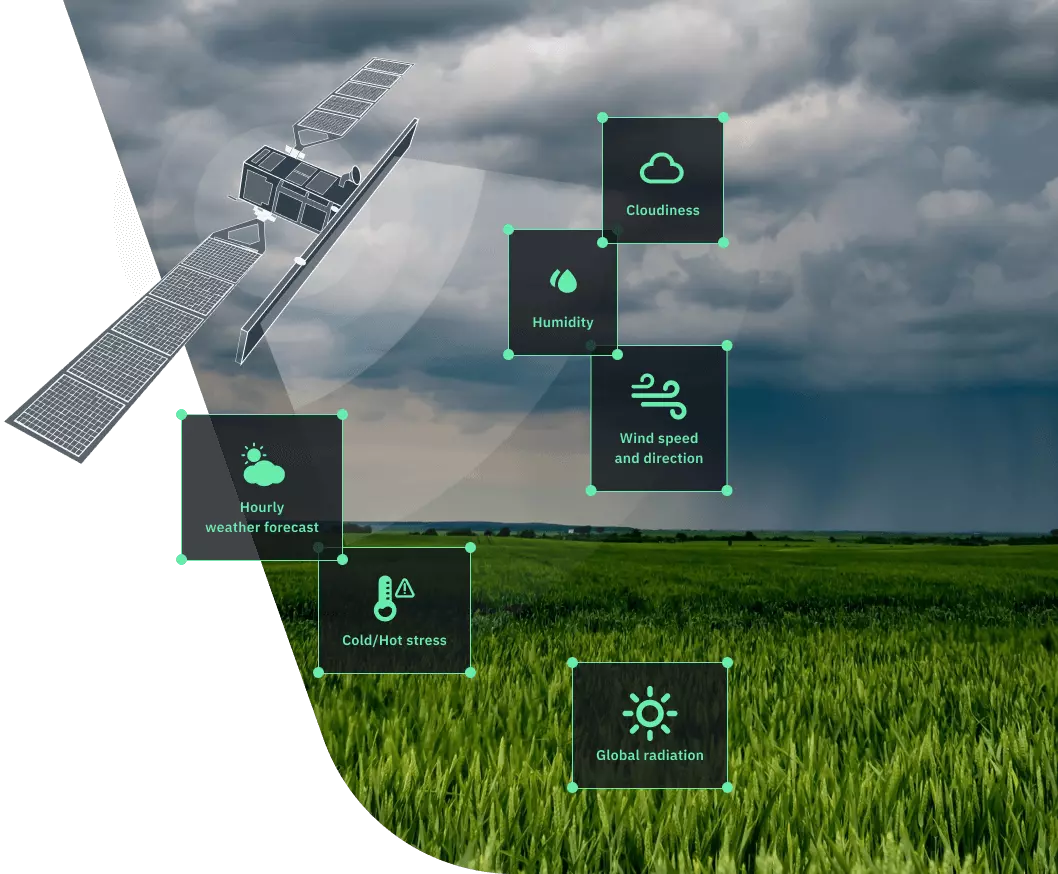
EOSDA Crop Monitoring offers the following types of meteorological observations:
- Temperature
- Precipitation
- Relative humidity
- Evapotranspiration
- Global radiation
- Wind speed and direction
- Cloudiness
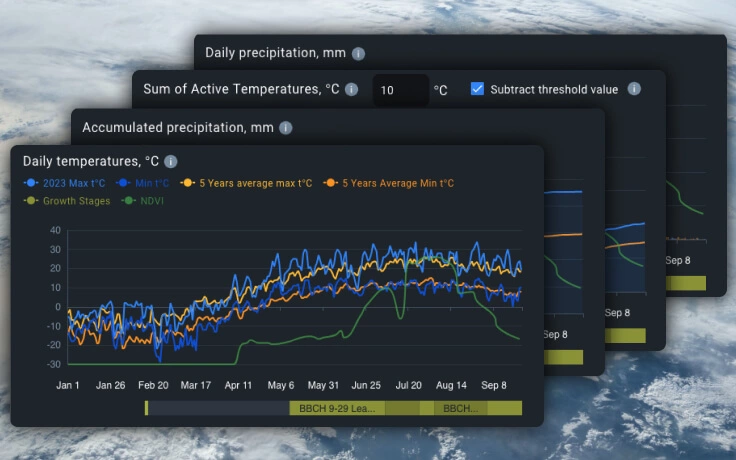
Historical Weather Data
Probe into years of historical meteorological observations on EOSDA Crop Monitoring — from 1979 till now — to extract climatic patterns and make informed decisions:
Detect minimum and maximum temperatures in each field over a particular period of time
Identify periods of heat or cold stress in a field
Analyze how meteorological parameters relate to changes in values of vegetation indices
Obtain temperature and precipitation averages over a 5-year period
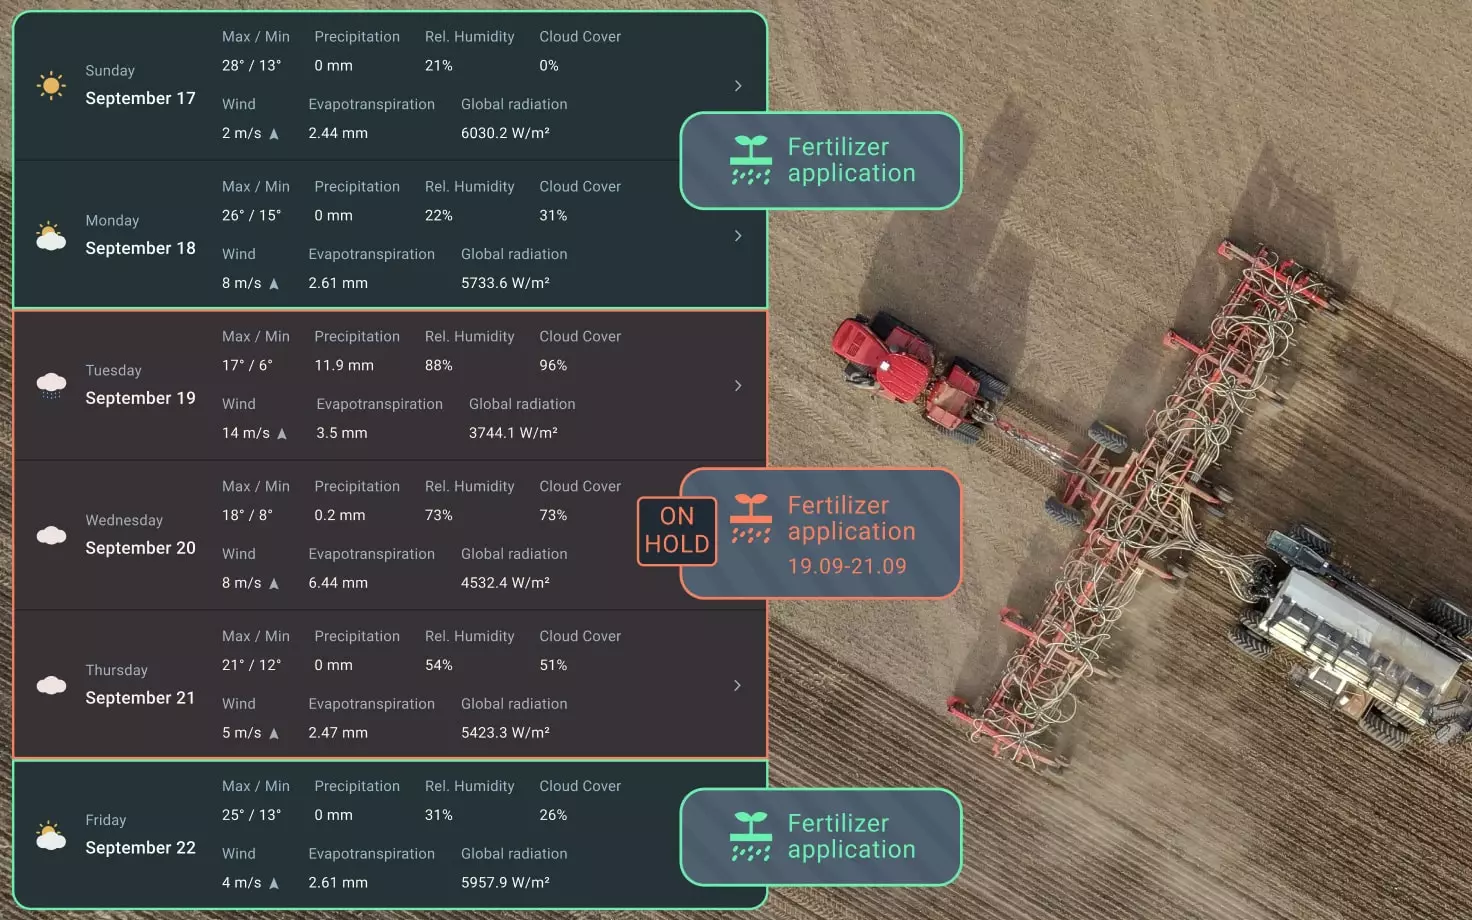
Agricultural Weather Forecast
Access a 14-day hourly forecast to determine the most favorable time for field activities:
Schedule irrigation
Avoid fertilizer and pesticides run-offs
Determine optimal seeding and harvesting dates
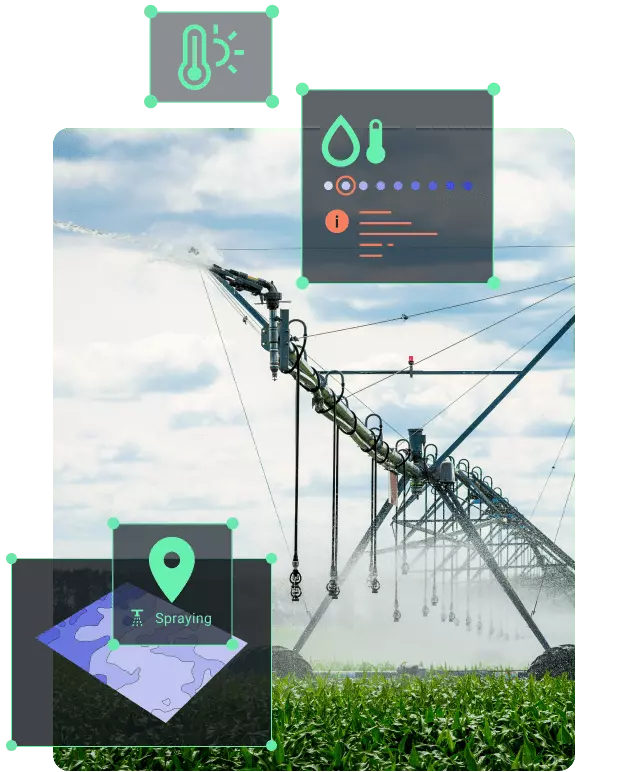
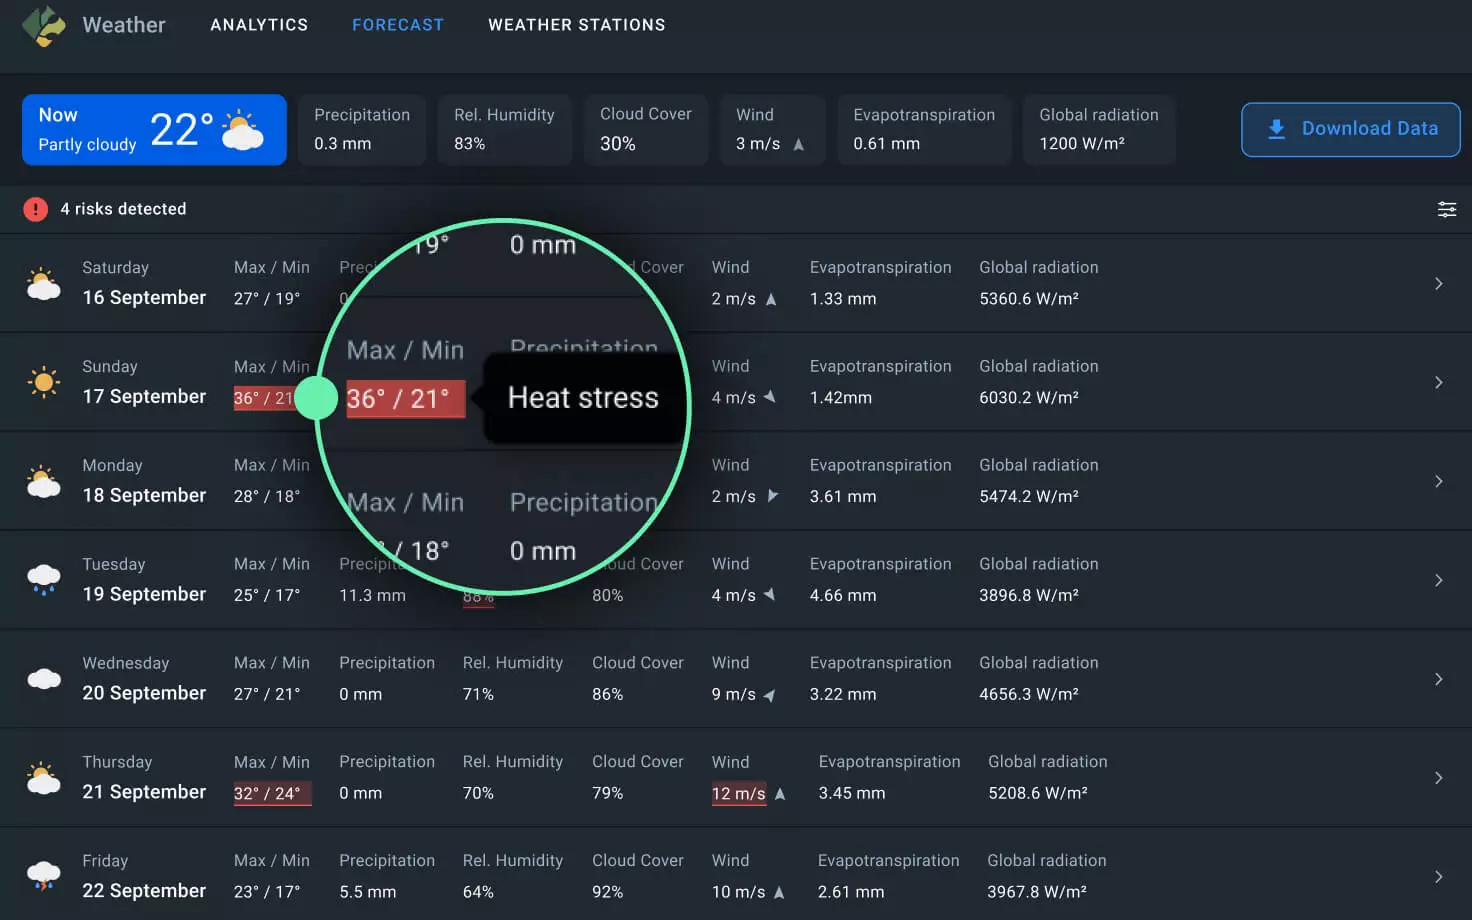
Meteorological Risk Assessment
Keep your crops safe by mitigating climate-related risks:
- Receive alerts on critical meteorological conditions to prevent crop loss
- Get notified of temperature stress in your fields
- Set temperature thresholds and durations on weather analytics graphics
- Get historical weather data on past temperature stress patterns
Stay alert about critical changes in temperature by setting up email notifications tied to the temperature thresholds you specify:
Cold Stress
Heat stress
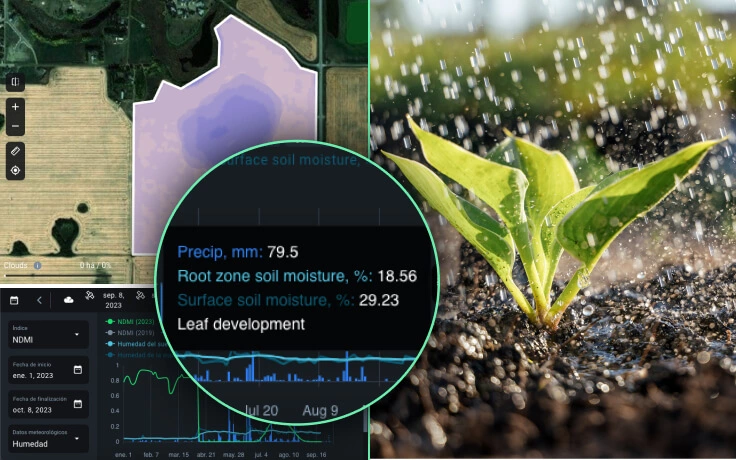
Soil Moisture Analytics
Monitor soil moisture across fields to optimize yields and management strategies:
- Prevent waterlogging and droughts.
- Analyze the relationship between precipitation and soil moisture levels.
Soil moisture monitoring is possible on two depth levels:
Root zone soil moisture (up to 70 cm deep)
Surface soil moisture (0-7cm)
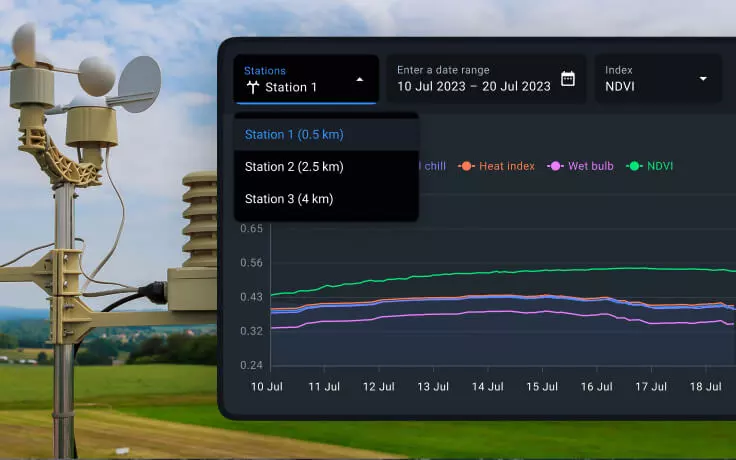
Ground Weather Stations
Enhance your weather data analytics by integrating and storing data from your local meteorological stations. While Davis stations are supported, other agricultural weather stations can also be connected by request.
EOSDA Custom Solutions Based On Meteorological Data
Weather analytics is a primary tool we use in our custom solutions.
- Our R&D team crafts algorithms tailored to your needs, from pre-sowing tillage based on soil moisture to creation of temperature-based sowing maps, and much more.
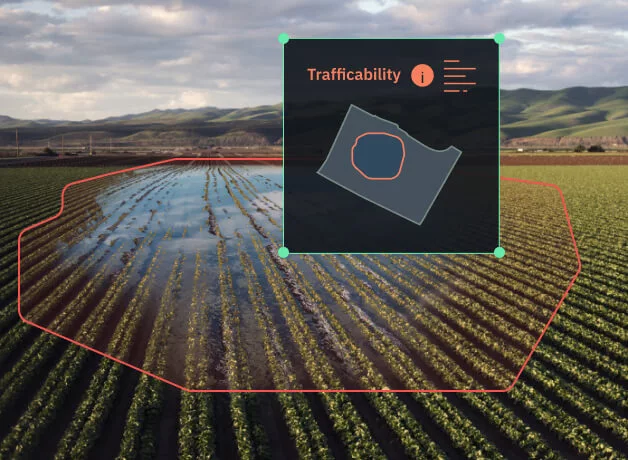
- For example, using a detailed soil model combined with meteorological data, we can analyze soil trafficability — an indicator of field's or forest’s adaptability for vehicle movement.
- In our soil trafficability analysis, we rely on different data: soil type, soil granulometric composition, solar radiation, evaporation, precipitation, meteorological forecasts, expert judgment of our scientists team, and our AI technologies.
- The result is a set of soil trafficability coefficients for different machinery, enabling field owners to strategically plan field activities performed by heavy machinery: sowing, sprinkler irrigation, combine harvesting, and other.