Live satellite images: View and analyze Earth in real time
- Access high-resolution optical and SAR imagery, terrain maps
- Explore archival and live satellite images from around the globe
- Detect changes with 20+ built-in indices, no complex GIS tools
Most popular satellites on LandViewer
Key features for satellite insights
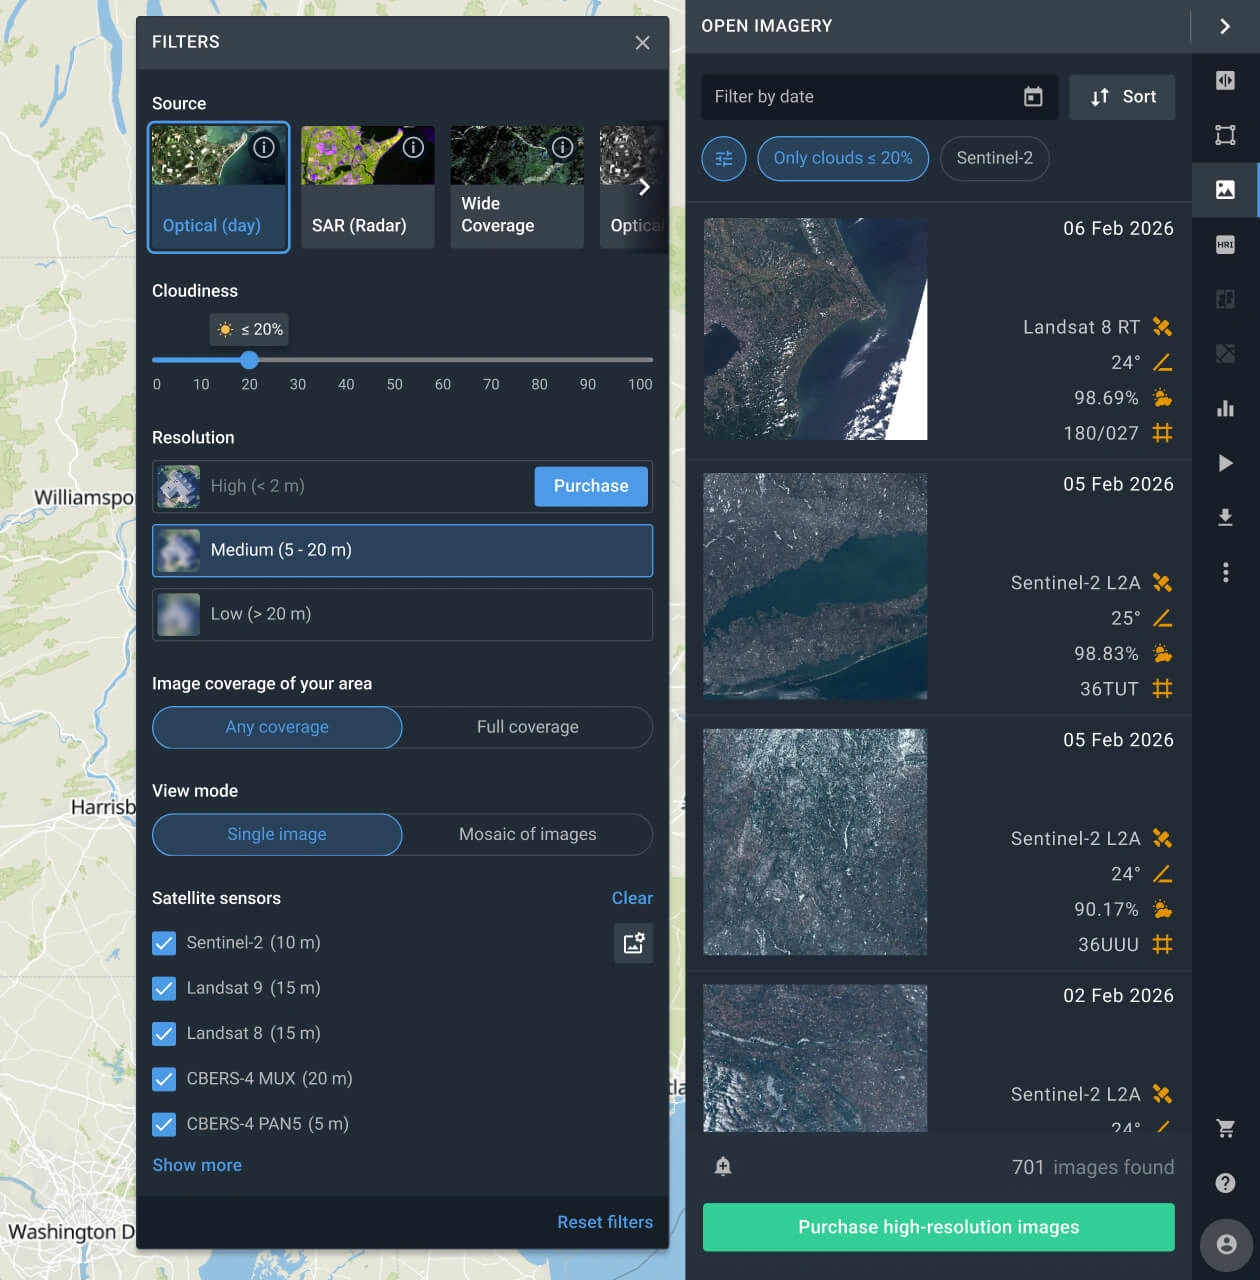
Satellite imagery search and mosaic
Easily find current and historical satellite views based on their capture date and coverage area while filtering out cloudy images. You can view a single image in detail or combine multiple images into a seamless mosaic to see larger areas. Works precisely whether you're studying a small field or a whole region.
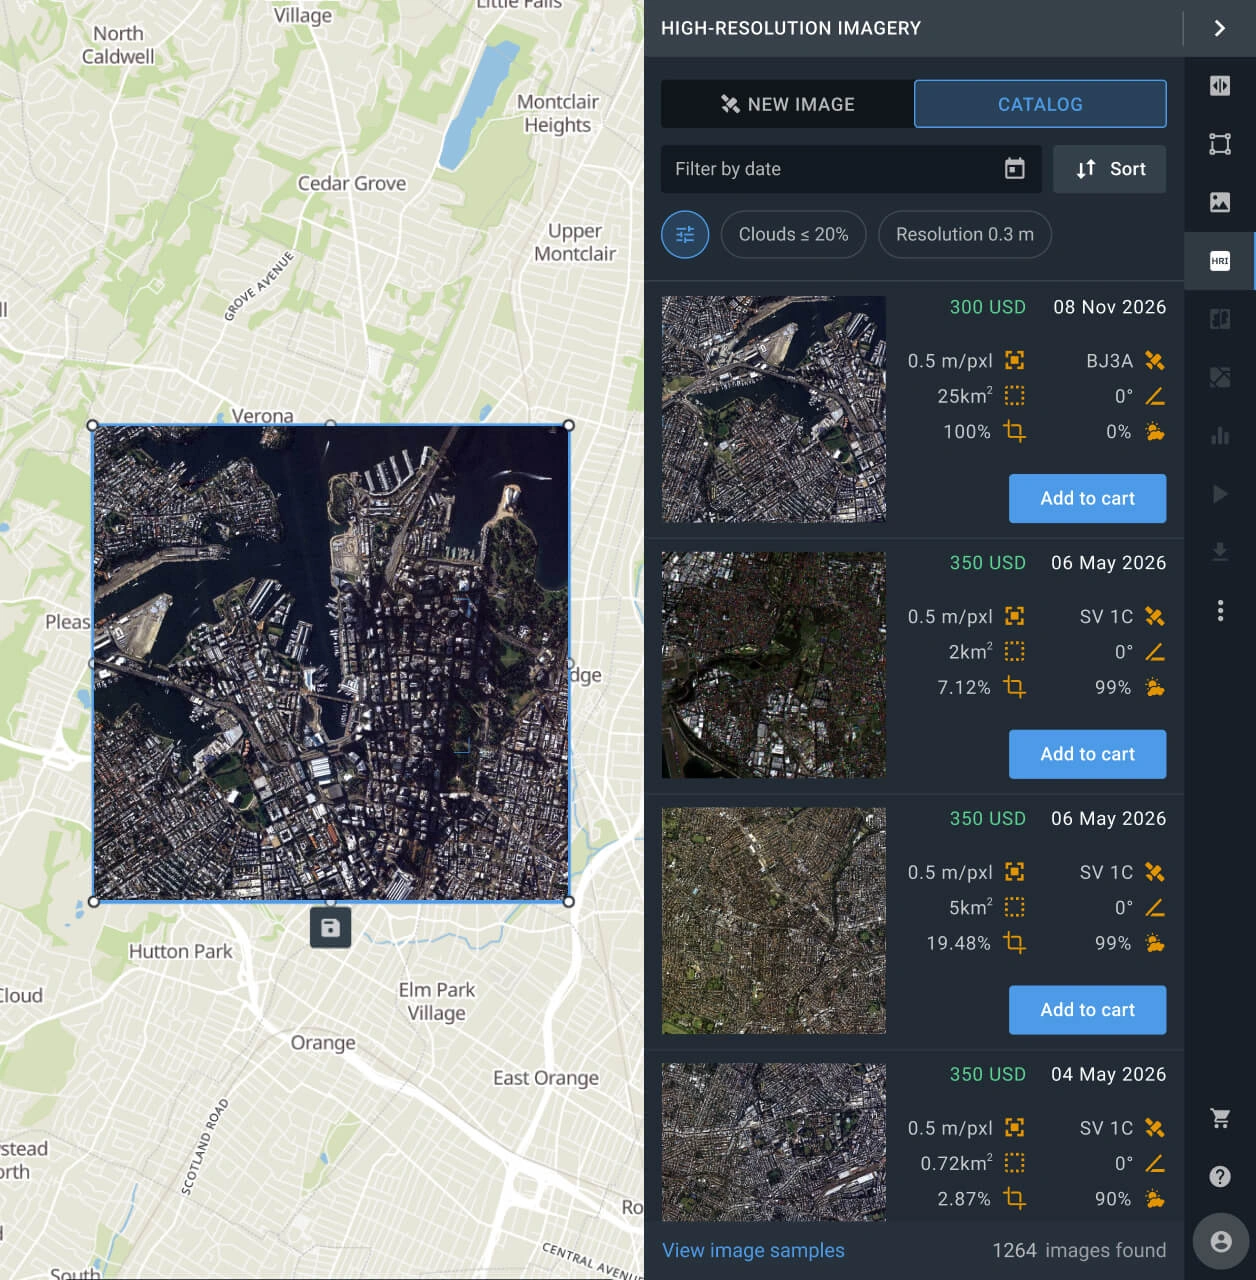
High-resolution imagery archive and tasking
Get high-resolution satellite imagery (down to 30 cm in detail) from our extensive archive or request the most current satellite images captured specifically for your needs. Use detailed historical and real-time satellite views from leading providers for city planning, infrastructure monitoring, or environmental research.
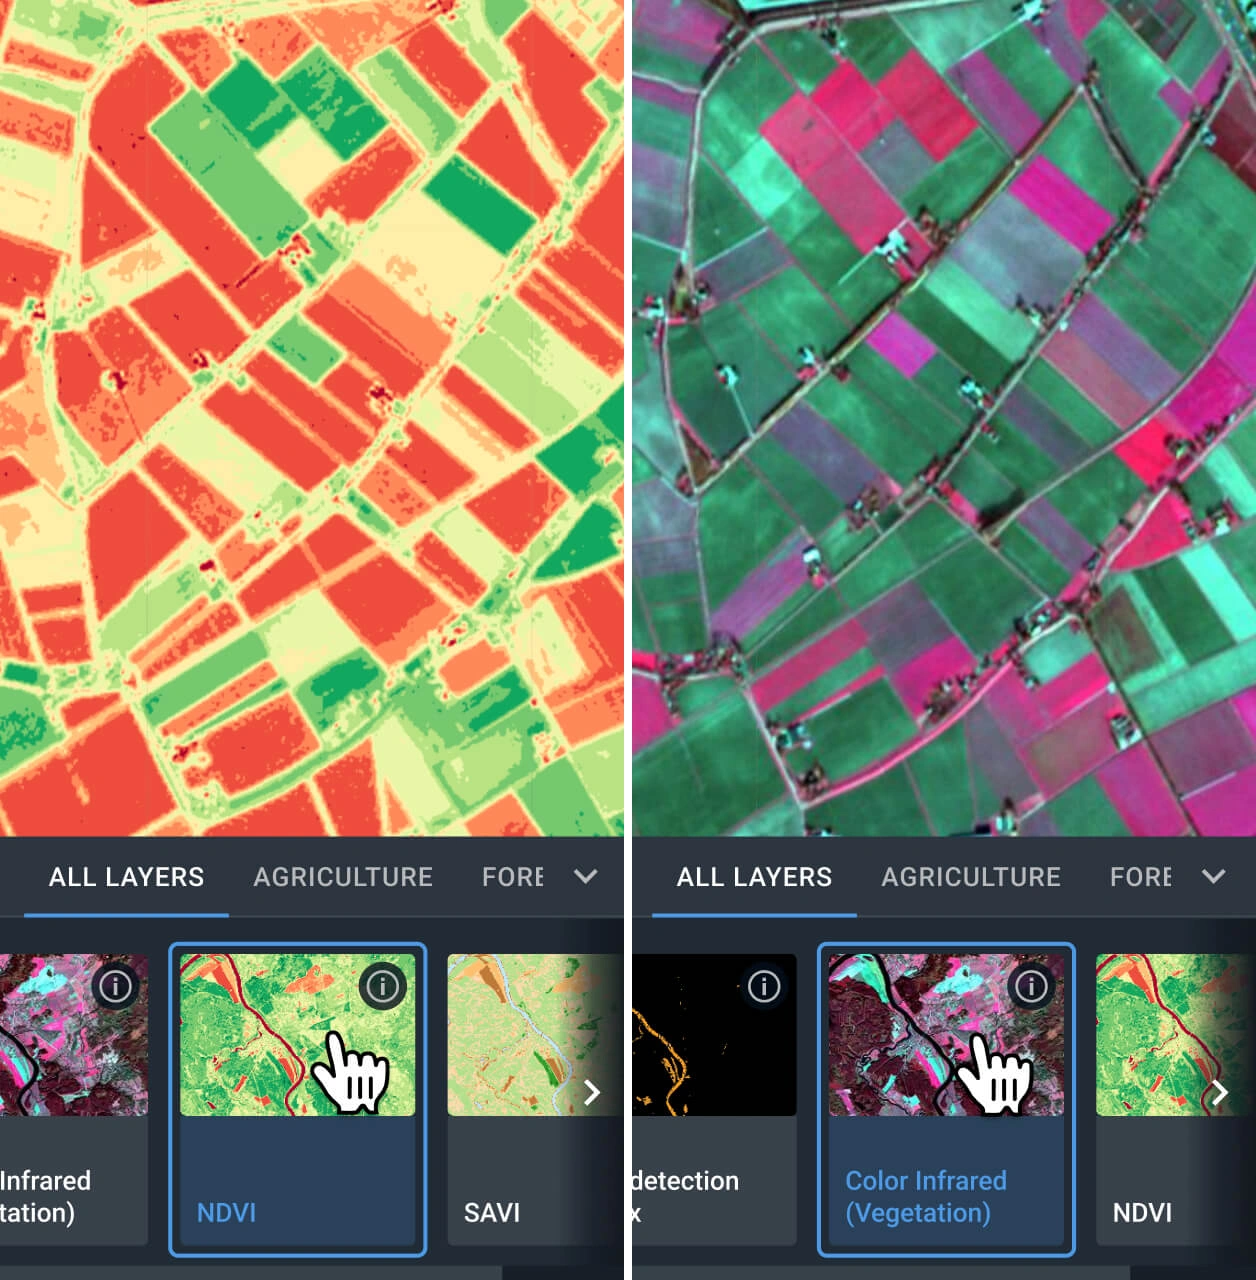
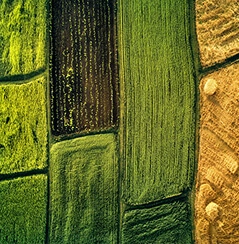
Customizable indices and band combinations
Choose from over 20 ready-made indices, including NDVI, Color Infrared (Vegetation), and Land/Water, or create custom band combinations to study land features. From current crop health and water distribution to urban density, tailor the analysis to your exact needs.
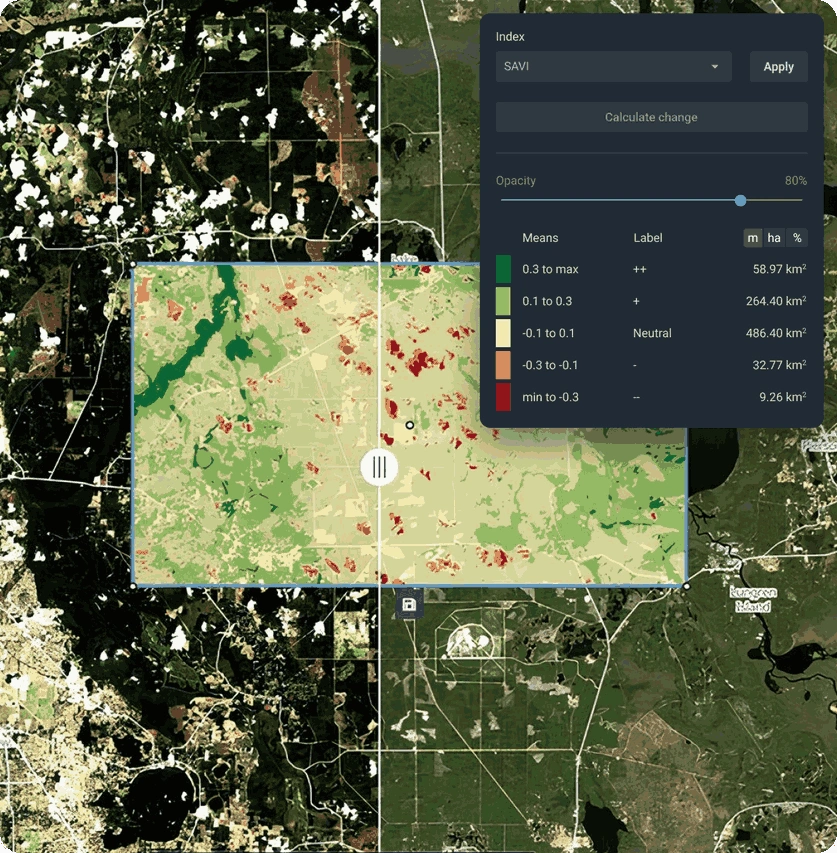
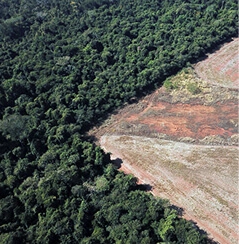
Image comparison and change detection
See exactly what's changed in your areas of interest by comparing current and historical satellite images from different sources. Our automated tools help you spot and measure differences live — whether new buildings, cleared forests, or variations in crop health — with pinpoint accuracy.
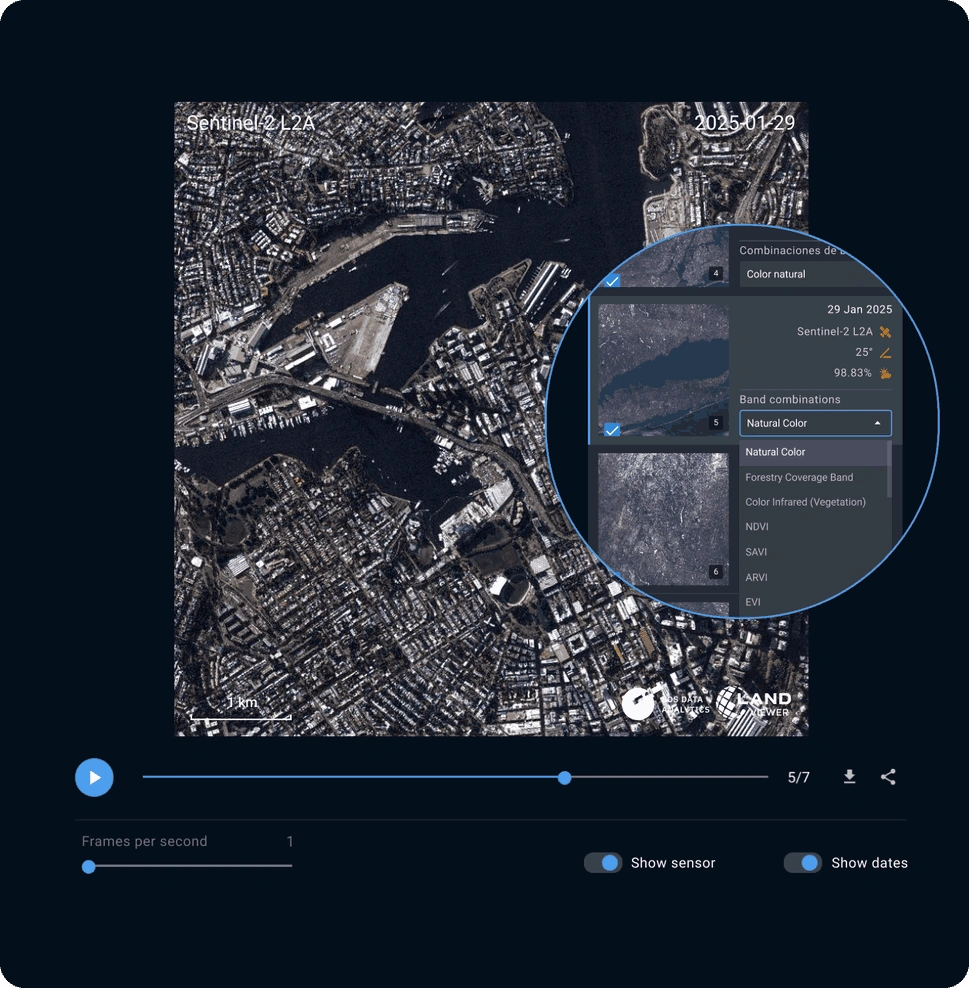
Time-lapse animation
Create dynamic visual stories with time-lapse animations based on current and historical satellite imagery. Capture the evolution of landscapes, from city growth and seasonal land use cycles to melting glaciers, and create compelling visuals for presentations and reporting.
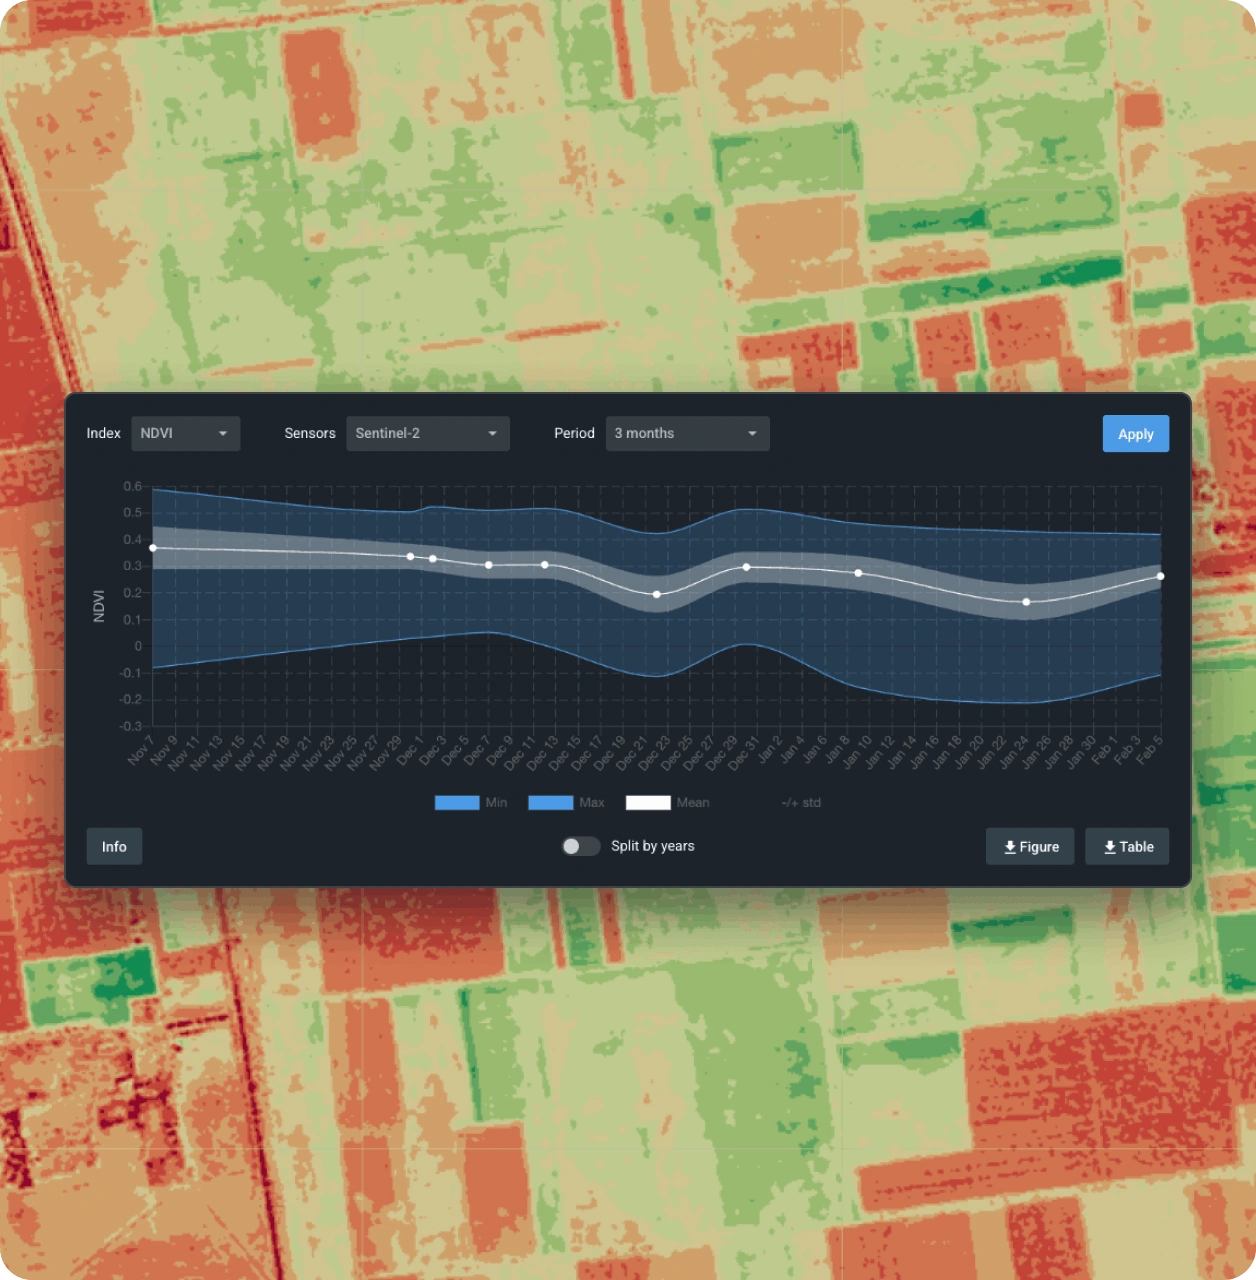
Satellite time series analysis
Understand long-term trends using historical imagery. Choose from multiple indices to monitor seasonal vegetation changes, track urban sprawl, or measure conservation success. See current trends clearly to forecast what's ahead.
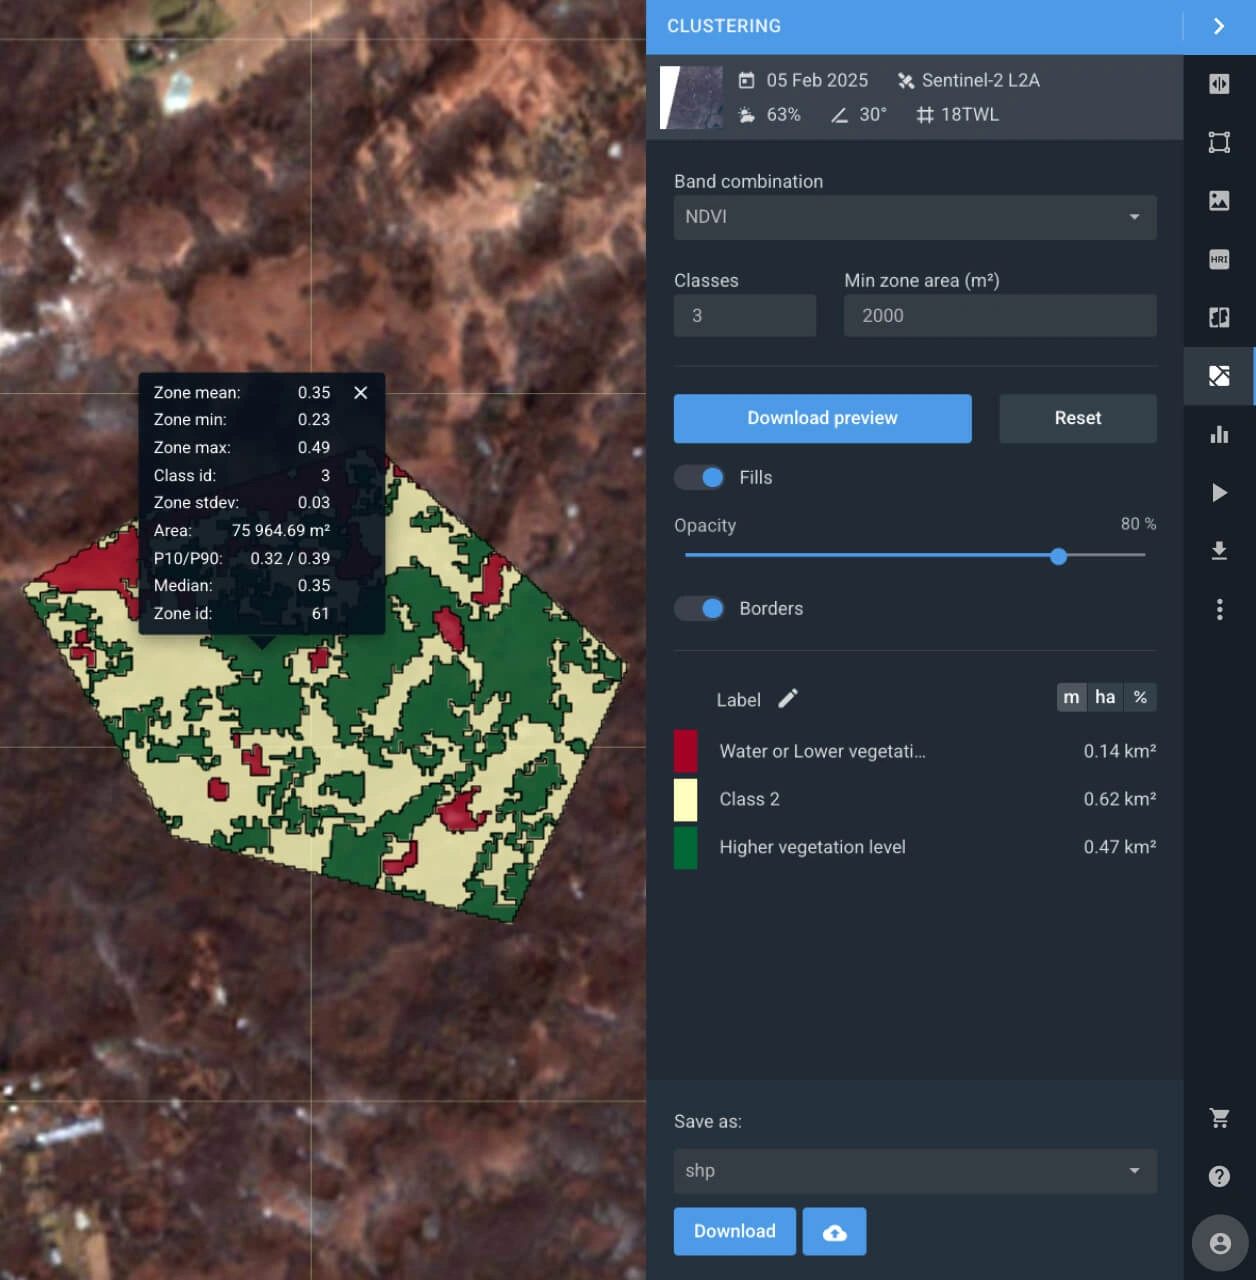
Data clustering
Turn complex datasets into easy-to-understand groups of data based on spectral similarities. Whether you're monitoring water bodies, tracking crop health, or studying urban areas, this tool automatically finds and groups similar regions, making it simple to understand current patterns and make informed decisions.
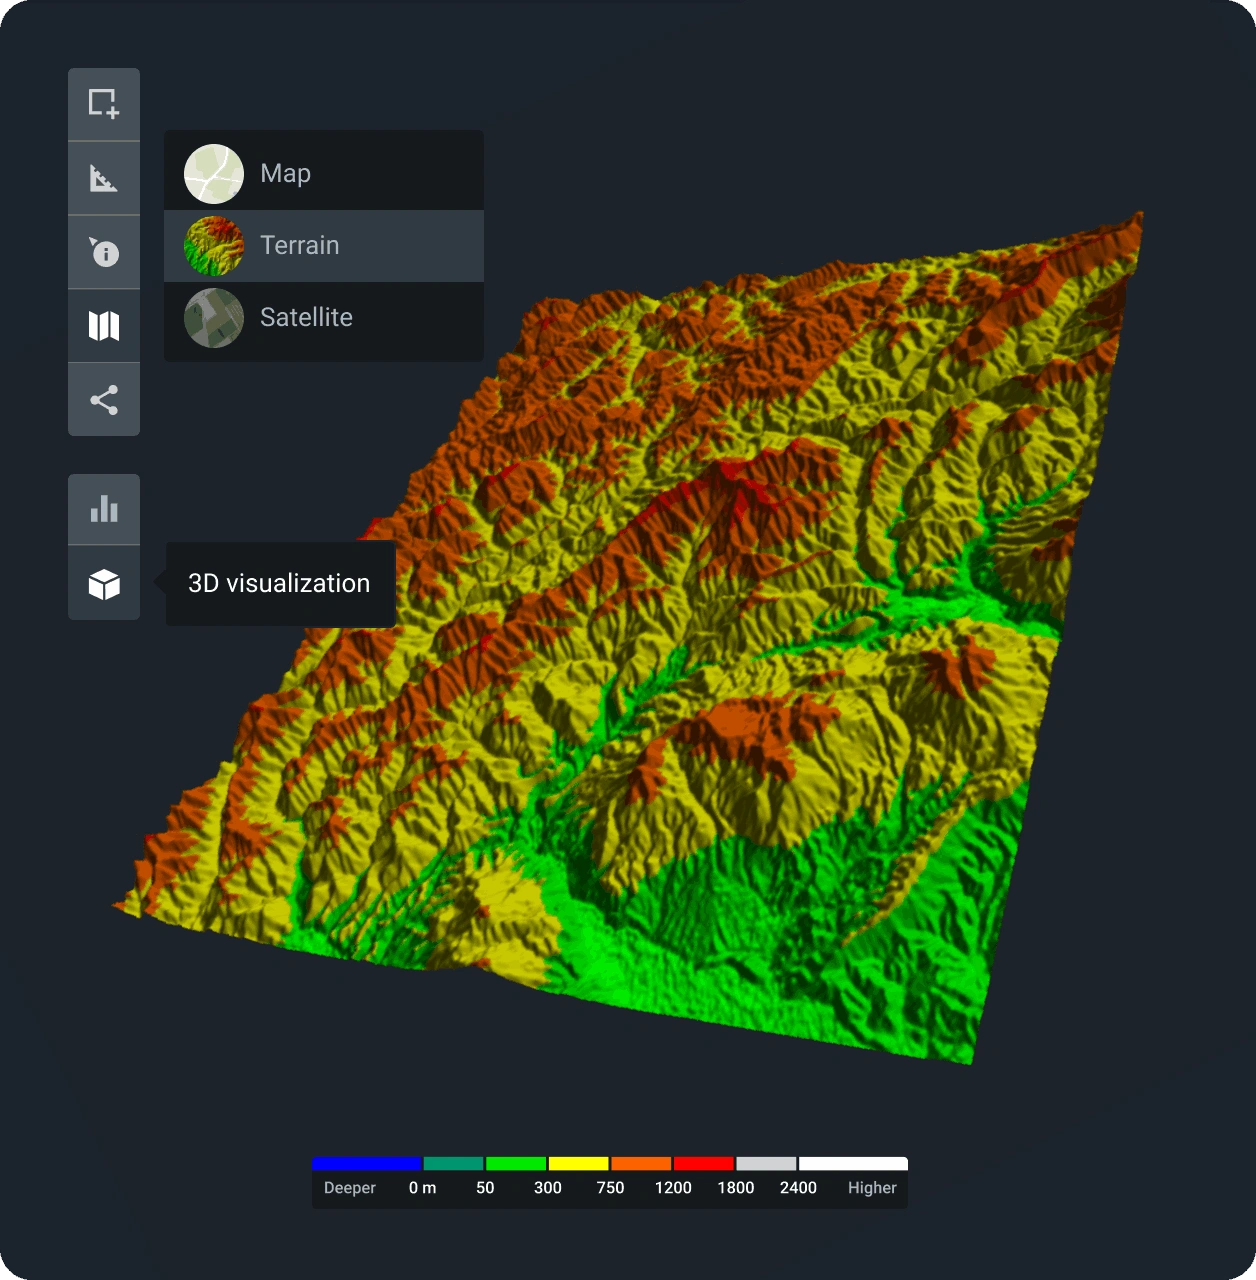
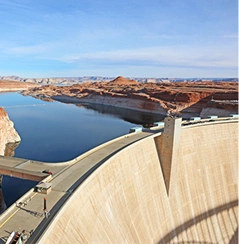
3D modeling
Transform historical and live satellite imagery into 3D visualizations to better understand terrain and structures. Ideal for planning infrastructure, assessing real-time natural disaster impacts, or conducting geological studies.
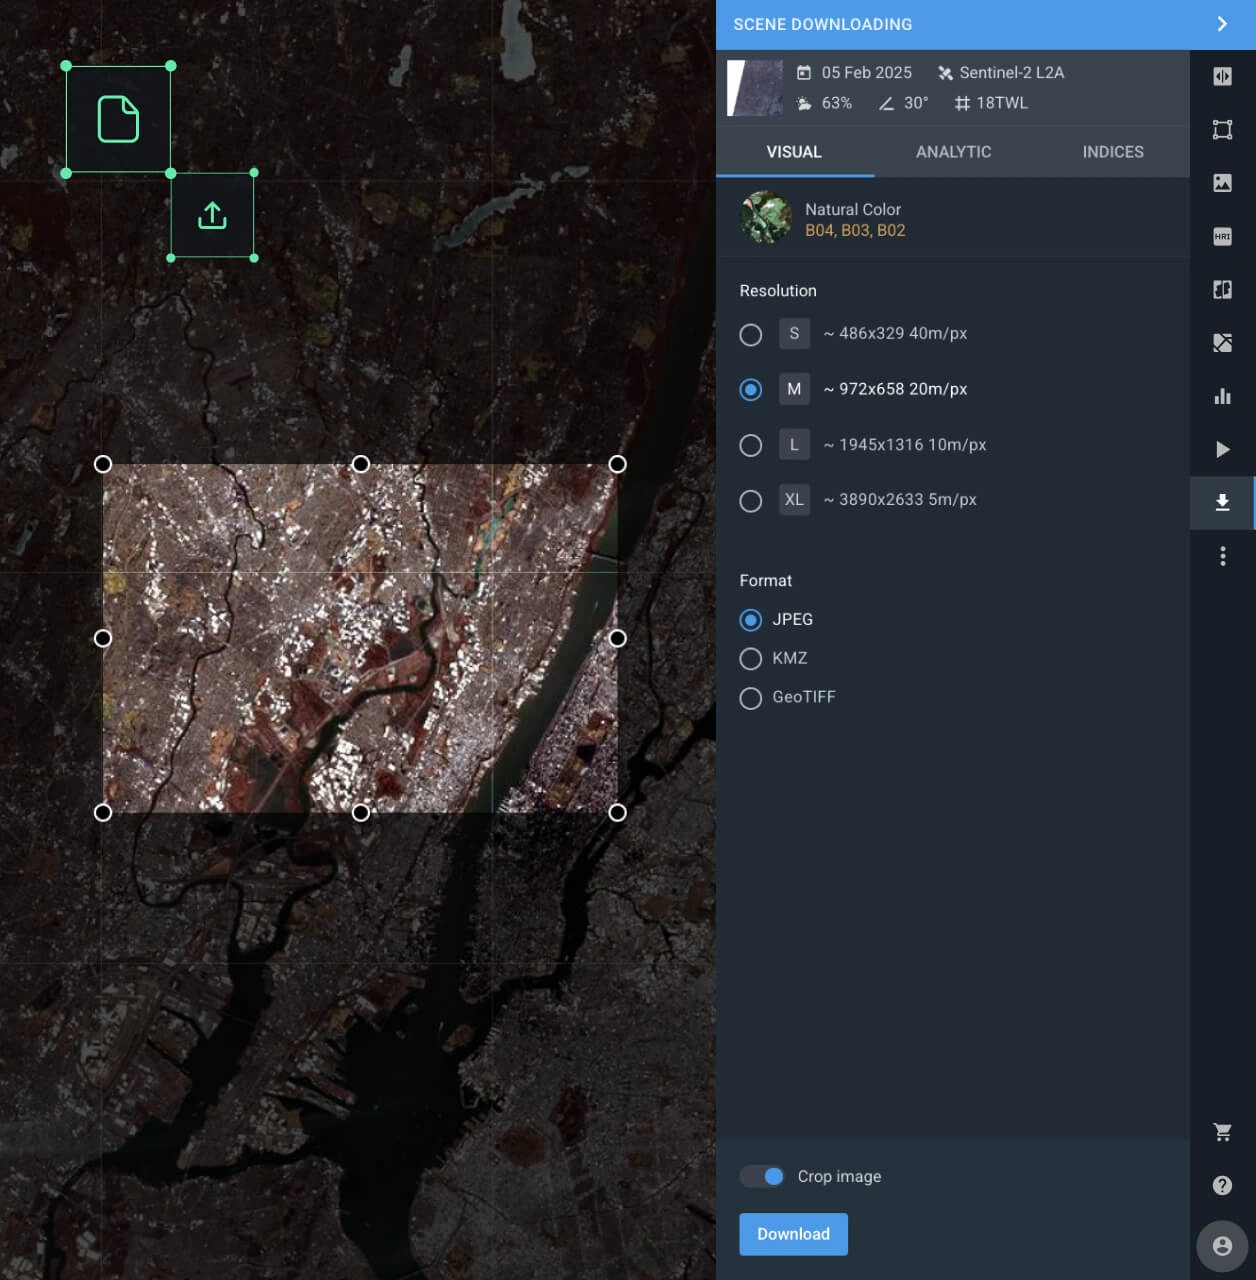
Exporting imagery and analytics
Get your live and historical space-derived data the way you need it. Download high-quality live imagery and processed analytics or integrate data into GIS tools via WMS (Web Map Service). Share real-time insights with your team or seamlessly include them in larger analytical projects.
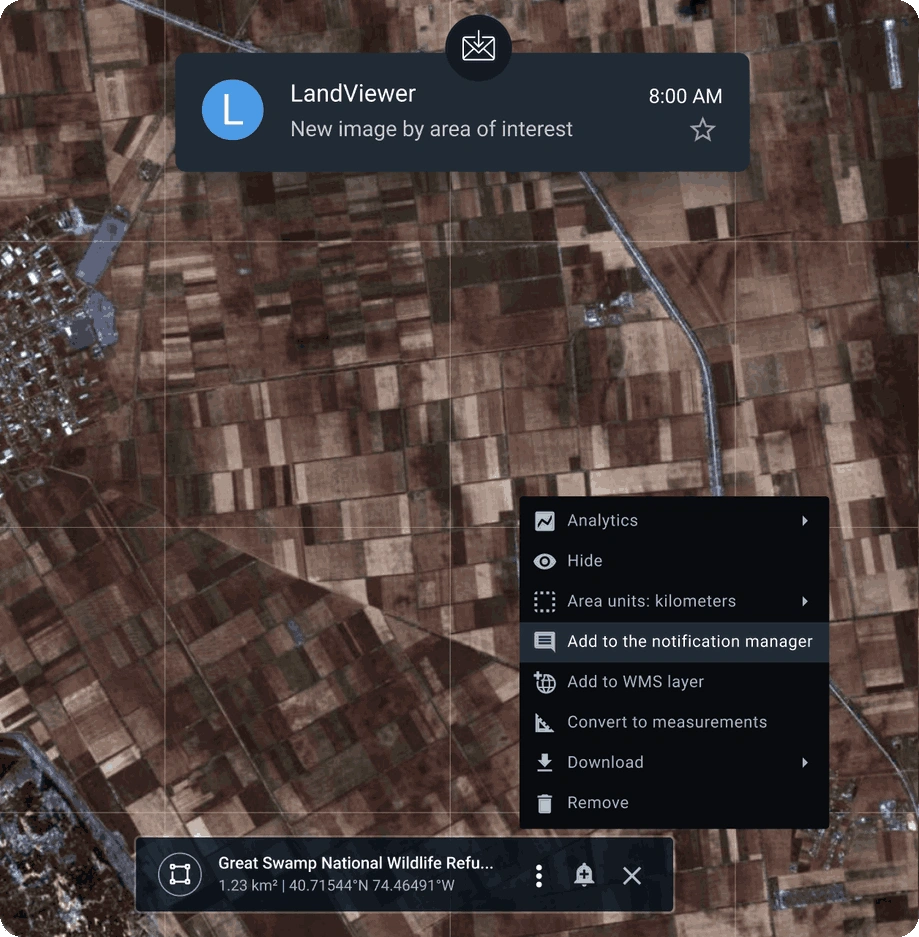
Notifications for selected areas
Never miss any live satellite image of your area or a change in key indices. Always stay ahead with real-time alerts tailored to your monitoring needs.
Industries that benefit most from real-time satellite data


LandViewer achieved AWS Qualified Software status by passing the Foundation Technical Review.
Satellite imagery data providers


FAQ
How does LandViewer differ from Google Earth?
Unlike Google Earth, which displays pre-selected, mostly optical images updated infrequently, LandViewer provides access to current satellite images with flexible filtering by time, sensor, and resolution (down to 30 cm). LandViewer also supports multispectral and radar imagery, and includes built-in tools for advanced analysis, change detection, clustering, and 3D modeling. Compared to the simple viewing experience in Google Earth, LandViewer provides a far more powerful and flexible toolset "
Do live and real-time satellite images show current ground conditions instantly?
Not exactly: "live" or "real-time" means minimal delay, but not instant visibility. Live and real-time imagery are the most recent still images captured during a satellite’s latest pass over a location. After capture, the data is transmitted, processed, and published with a short delay, usually from a few minutes to a few hours, depending on the satellite and conditions. This allows users to monitor changes and current conditions with high accuracy, even though the imagery is not live video.
Which satellites and data sources does LandViewer provide?
LandViewer provides access to data from multiple sources, including public missions like Sentinel, Landsat, and MODIS, and commercial providers such as SuperView-1/2, Beijing-3A/3N, and BlackSky Gen2/3. Available data types cover optical (multispectral and stereo), SAR, and terrain maps.
Does LandViewer offer a free plan?
Yes, LandViewer offers a free plan with access to up to 15 images per month. It also includes limited functionality for basic and advanced analytics.
What's included in LandViewer subscription plans?
Monthly and yearly subscription plans unlock full access to the platform's features, including unlimited access to live satellite images and historical satellite data at up to 2 m resolution, index monitoring, advanced analytics, time series tools, clustering, and more.
Are high-resolution images included in my LandViewer subscription?
No, high-resolution commercial imagery is not included in standard subscriptions. These images must be ordered separately, and pricing depends on the provider, resolution, area of interest, and delivery time. Find more details on the high-resolution satellite imagery page.
What spatial resolutions are available in LandViewer?
LandViewer offers different spatial resolutions for different purposes: low (250m–1km), like MODIS, for regional, large-scale analysis; medium (5–20m), like Sentinel and Landsat, for general site overview; and high-resolution (up to 0.3m) from commercial space missions for detailed AOI analysis. Low and medium-resolution data are included in subscription plans, while high-resolution data should be ordered seperately.