Sentinel-2 images: Seamless access to satellite data and analytics
Get Sentinel-2 wide-swath, medium-resolution, and high-frequency multispectral satellite imagery on the EOSDA LandViewer platform:
-
Spatial resolution
10 to 60 m
-
Scene size
110 × 110 km
-
Revisit time
Every 2–3 days at mid-latitudes, 5 days at the Equator
-
Data archives
Global (since 2018), Europe (since 2017)
-
Spectral bands
13 bands covering visible, near-infrared, and shortwave infrared
-
Analytical tools
Change detection, clusterization, time series analysis
How to get Sentinel-2 satellite images on EOSDA LandViewer
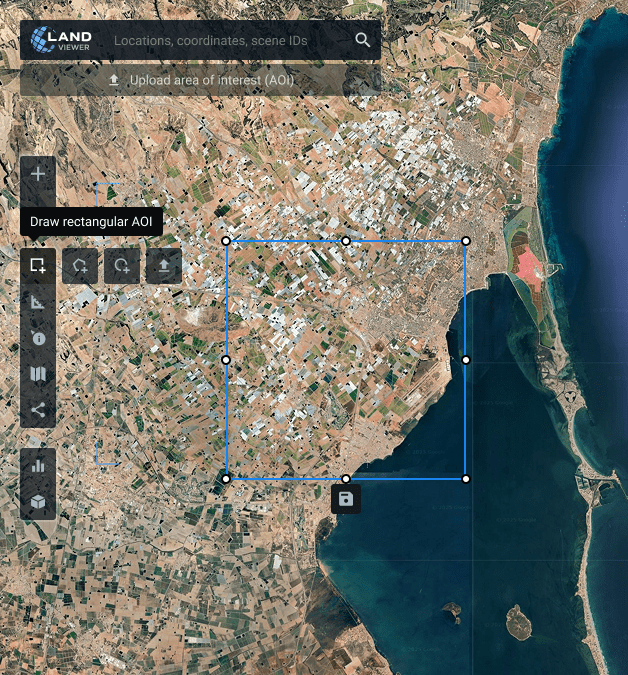
Set your AOI (area of interest)
Define the area you want to monitor by searching for location, drawing AOI on the map or uploading it from your device
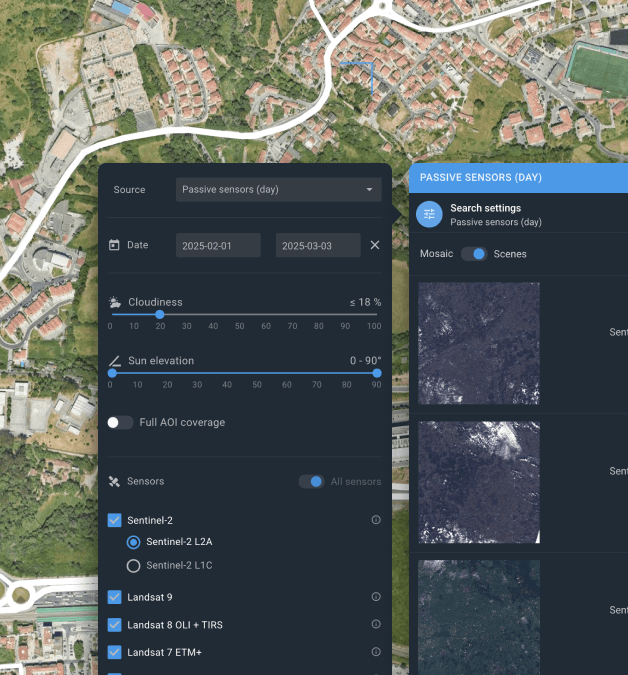
Search for a scene using filters
Filter available Sentinel-2 scenes by acquisition date, cloud cover, sensor type, and AOI coverage to find relevant data faster.
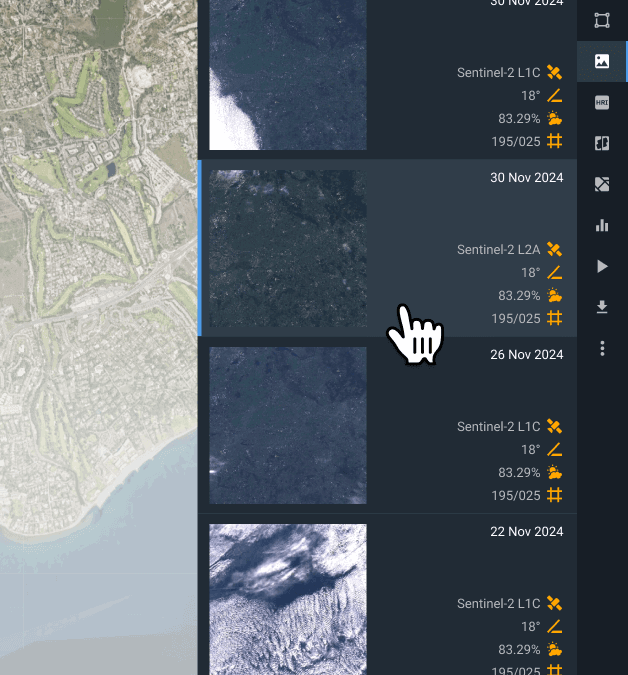
Select the scene that meets your needs
Review the filtered results and choose the scene that best matches your project requirements.
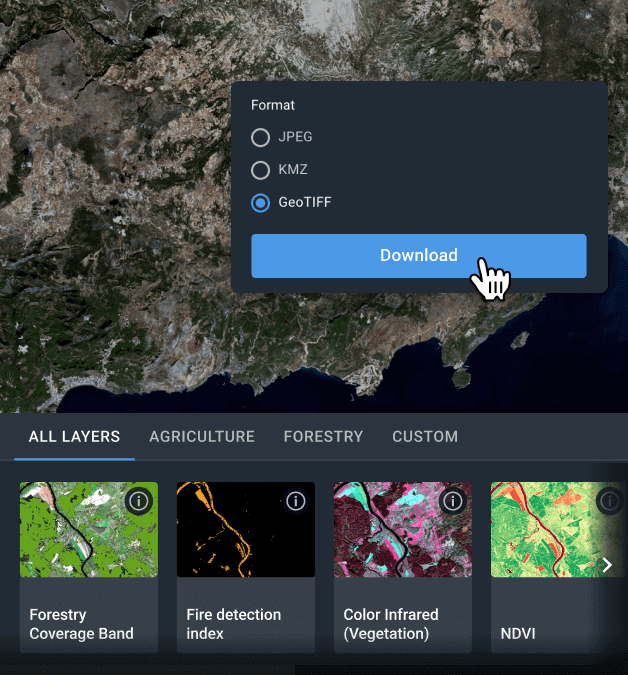
Download or analyze the scene on the platform
One option is to download the chosen Sentinel-2 imagery for further processing in third-party tools like QGIS or ArcGIS. Available formats include GeoTIF, KMZ, and JPEG. Another option is to apply indices & band combinations as well as use advanced analytics (e.g., change detection, time series analysis, clustering) within EOSDA LandViewer.
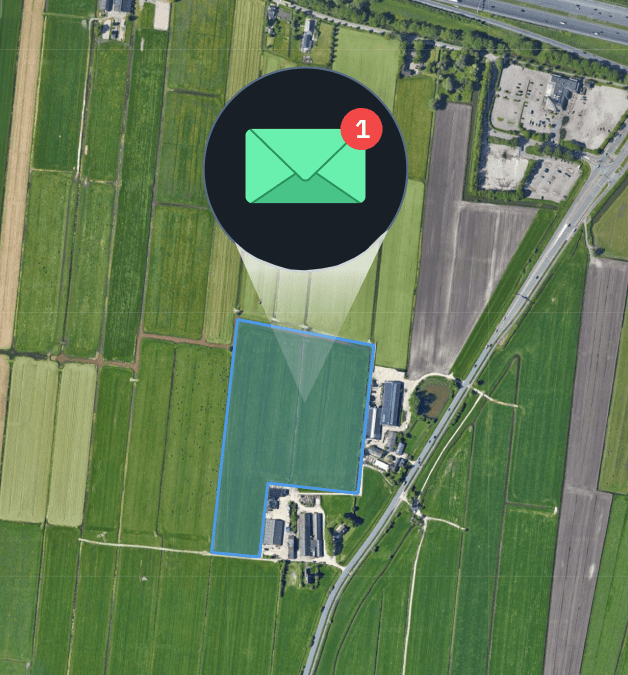
Set notifications for new Sentinel-2 images
If you don’t find a perfect satellite image in real-time, set up notifications to receive alerts when new images become available for your AOI.
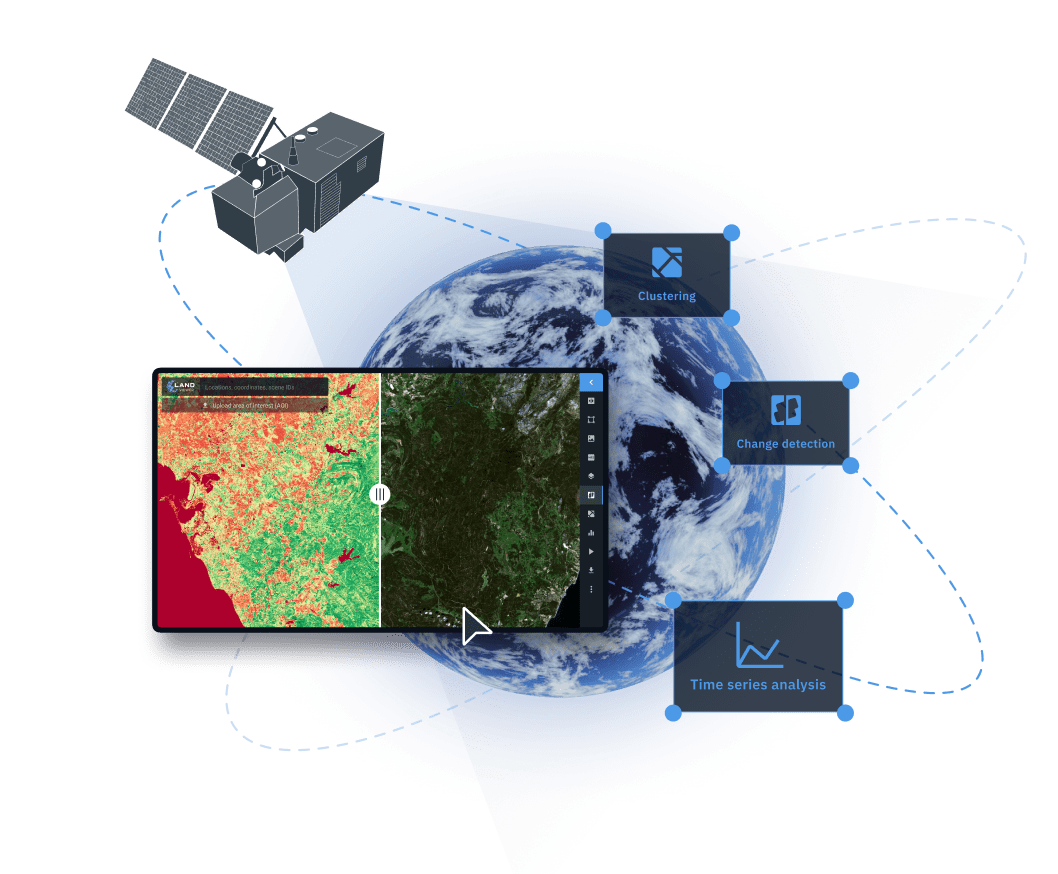
Get analytics on top of Sentinel-2 satellite imagery with EOSDA LandViewer
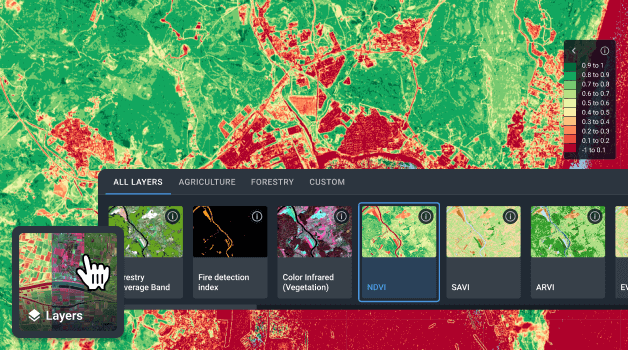
Indices and Band Combinations
Select specific bands for a multispectral Sentinel-2 image to ensure accurate feature identification. EOSDA LandViewer offers over 20 indices and band presets for precise AOI analysis, enabling targeted insights into vegetation health, land composition, and environmental changes. You can also create custom indices in case none of the default options fits your needs best.
Change Detection
Detect changes in real-time by comparing multiple Sentinel-2 satellite images of the same area, captured at different dates and times. This capability enables continuous monitoring of urban expansion, environmental shifts, and disaster impacts, helping involved parties to make informed decisions, assess risks, and support sustainable development.
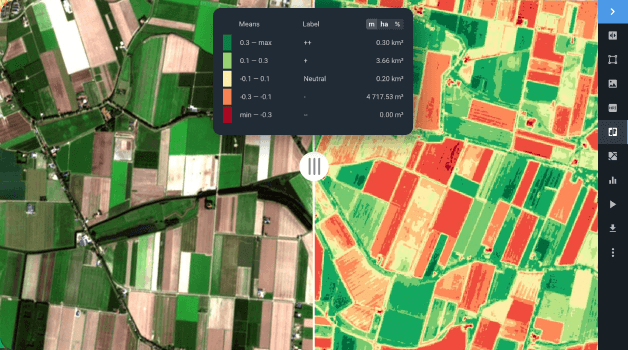
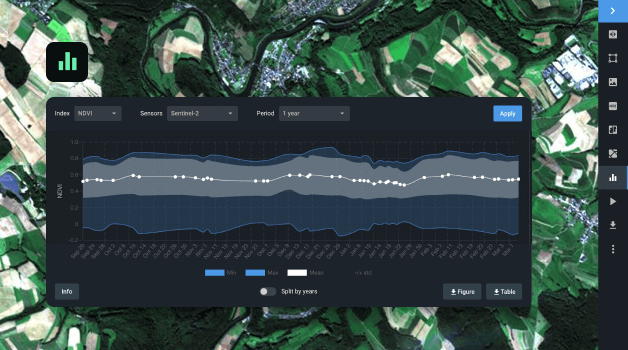
Time Series Analysis
Visualize data dynamics by constructing a spatiotemporal time series indices graph within a selected AOI. Choose from various indices to detect changes like land use or vegetation growth. By analyzing Sentinel-2 imagery over time, this feature reveals historical trends, seasonal variations, and urbanization impacts, enabling data-driven decisions and optimized resource allocation for conservation and development efforts.
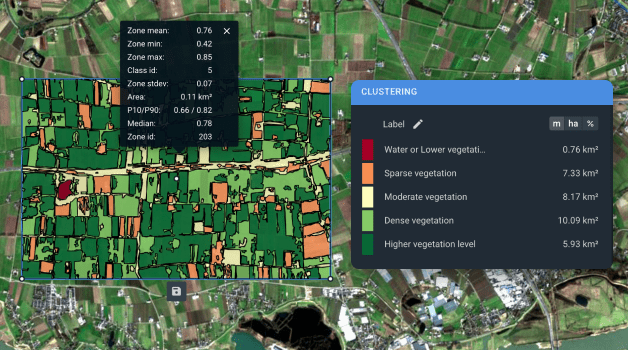
Clusterization
Convert raster Sentinel-2 maps into zones with common index values through clustering and vectorization, generating two new layers within a selected AOI. By grouping data based on spectral characteristics, this feature reveals hidden trends in vegetation, water quality, and land cover, enabling precise analysis for agriculture, forestry, coastal monitoring, and sustainable resource management.
Showcasing Sentinel-2 imagery analytics for real-world insights
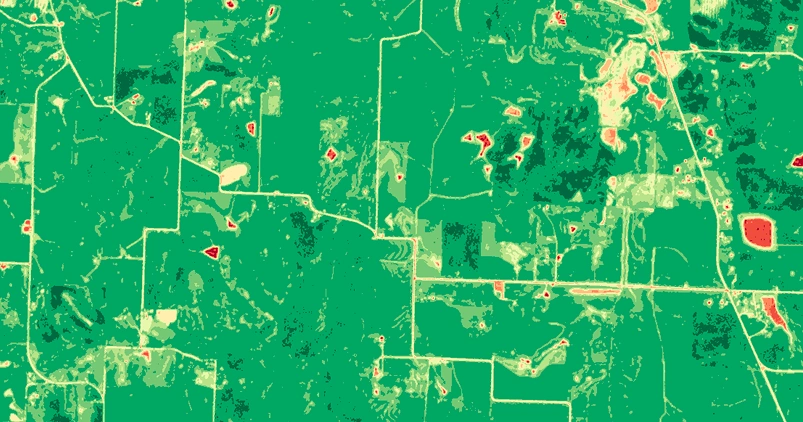
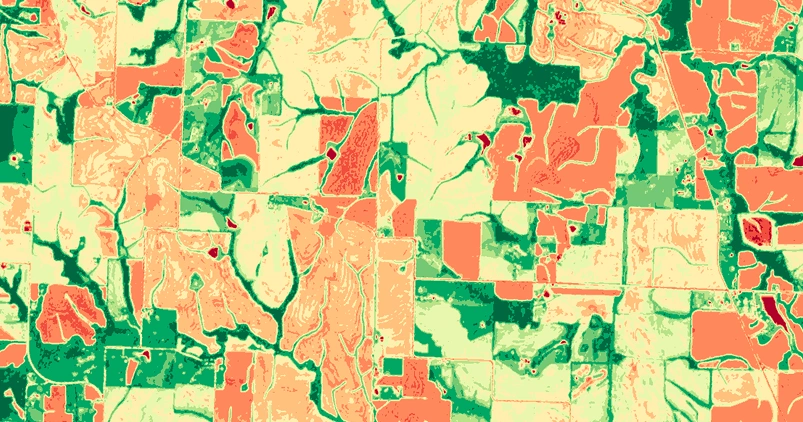
Vegetation Monitoring
- Lafayette County, Missouri, USA
- NDVI index
- May 24, 2024 - Jul 24, 2024
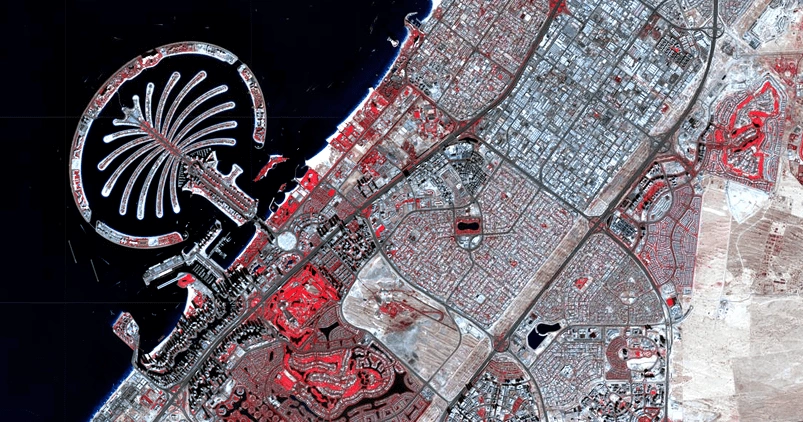
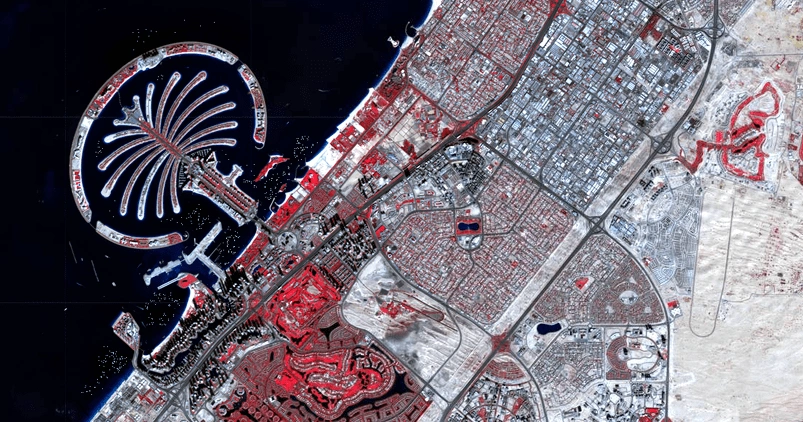
Urban Development Monitoring
- Dubai, UAE
- Color Infrared band combintation (False color)
- Dec 15, 2018 - Feb 1, 2025
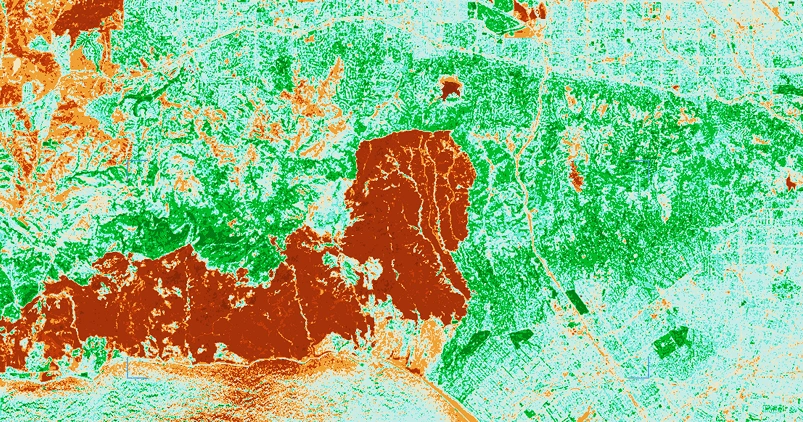
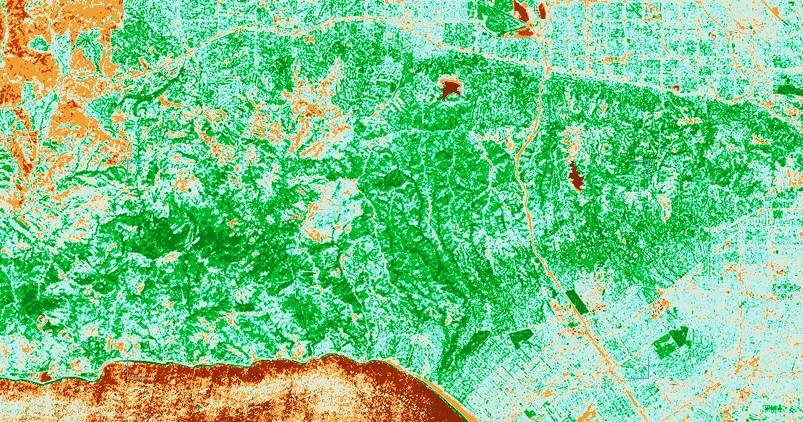
Wildfire Impact Assessment & Disaster Response
- Los Angeles, California, USA
- NBR index
- Nov 28, 2024 - Feb 1, 2025
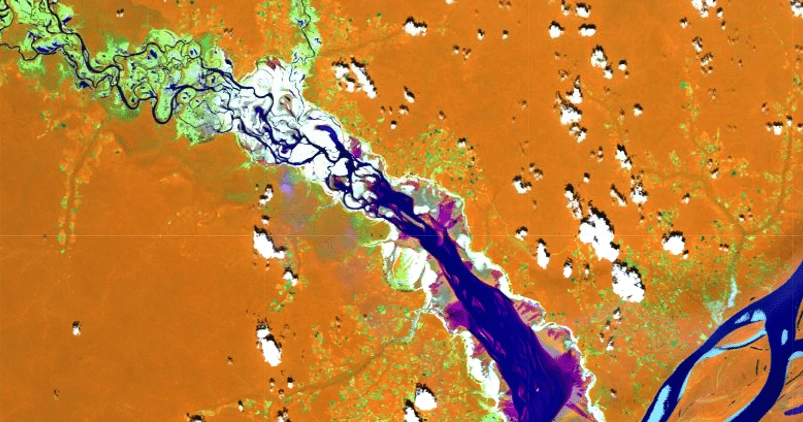
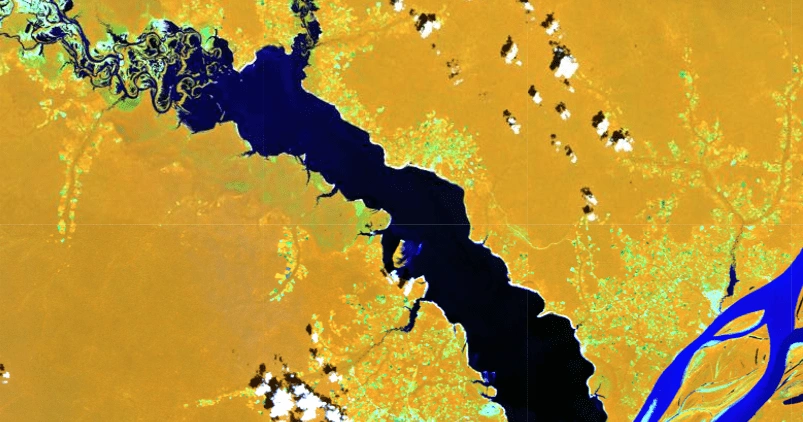
Environmental Impact of Extreme Heat Wave
- The Amazon River Ecosystems (Lake Tefé), Brazil
- Land/Water band combination
- Sep 5, 2023 - Oct 5, 2023