VRA Maps for Precision Variable Rate Applications
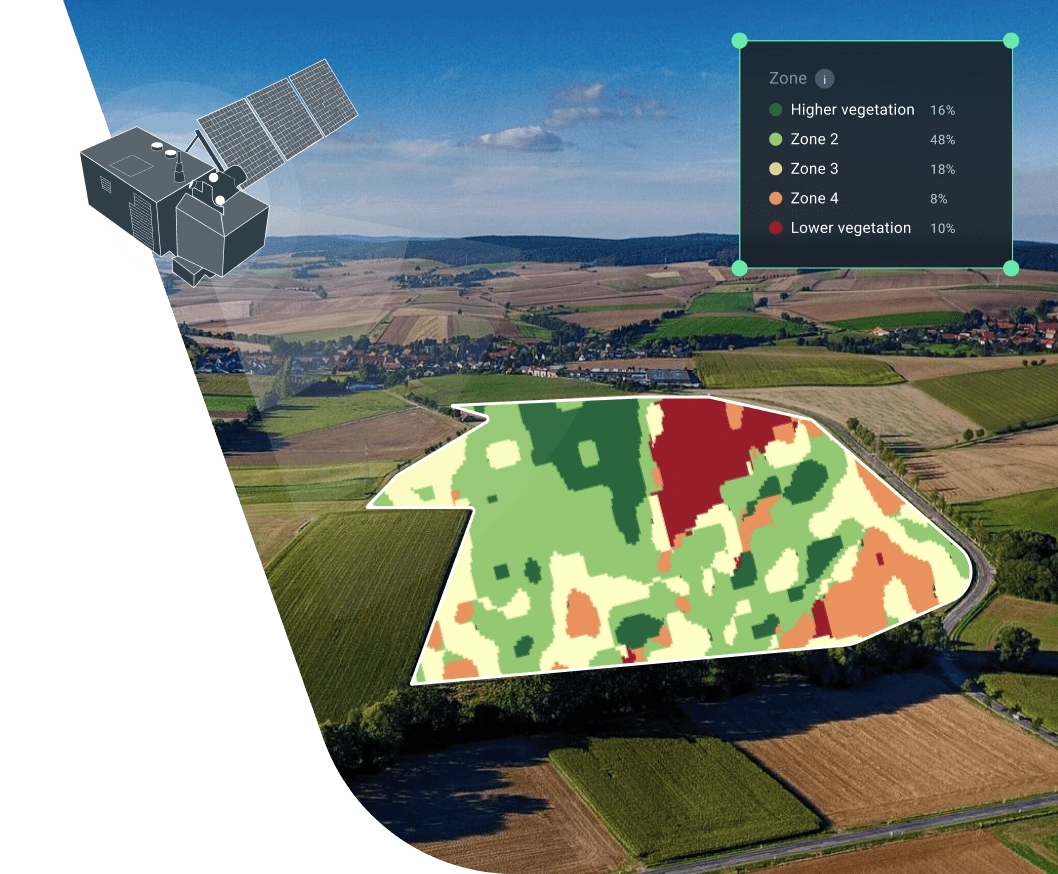
Create ready-to-use VRA maps in EOSDA Crop Monitoring and apply seeds, fertilizers, and crop protection just as much as needed. The system uses satellite data and field analytics to help you apply inputs at appropriate variable rates and save resources.
- 5+ vegetation indices and elevation data
- Extensive archive of historical satellite imagery
- High-quality images with up to 3m resolution
- No extra hardware required
- VRA files compatible with agricultural machinery
Why use variable rate application maps on EOSDA Crop Monitoring?
Boost crop productivity per hectare while saving on fertilizers, pesticides, seeds, and water through variable rate applications.
Increase application precision using different data sources for generating VRA maps: NDVI, NDMI, RECI, MSAVI, and elevations or ag machinery data.
Detect problem areas in no time for targeted variable rate applications and other interventions.
How the VRA map feature works
Follow these 4 simple steps and get your detailed variable prescription map ready in minutes.
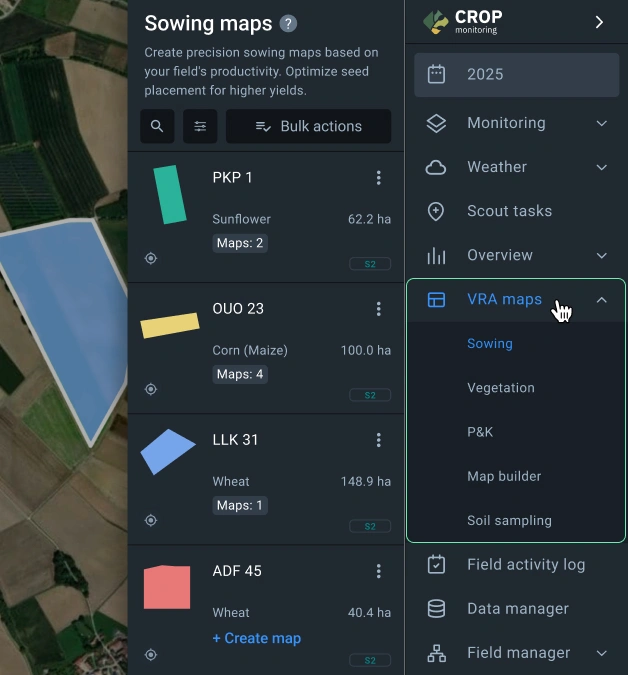
Choose the VRA map type right for your purpose
Sowing — NDVI-based VRA prescriptions perfect for variable sowing or precision soil sampling.
Vegetation — guides for variable nitrogen fertilization, desiccation, or crop protection based on the chosen vegetation index.
P&K fertilization — VRA prescriptions for potassium and phosphorus fertilizer applications based on long-term NDVI values.
Map builder — constructor of precision agriculture management zones using a set of parameters at your discretion.
Automatically divide the field into management zones via our algorithm
Generate a high-precision VRA map in a jiffy by selecting key parameters for your needs:
- number of variable rate application zones
- detail level
- preferred image date/period
- data layers like vegetation indices, elevation, or machine-uploaded files.
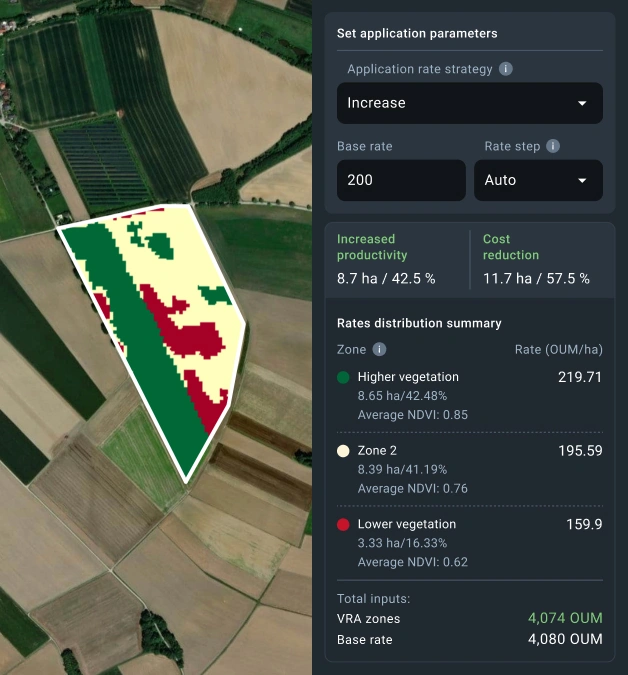
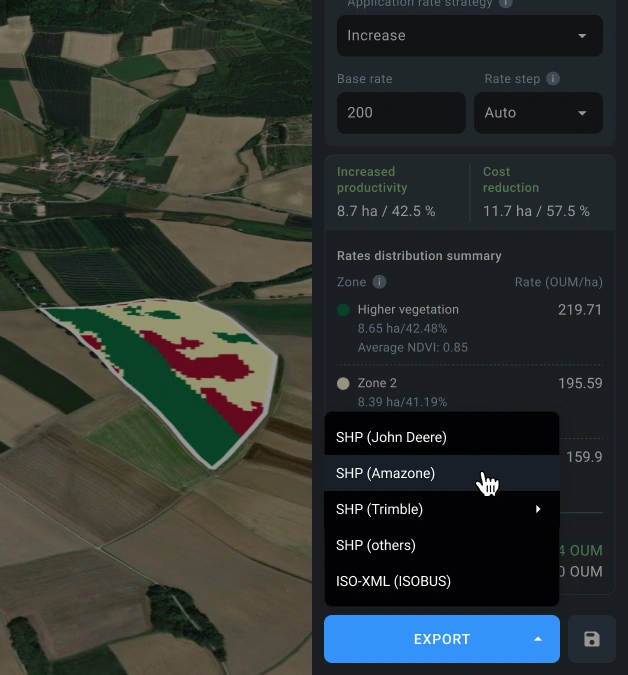
Set appropriate variable application rates for each management zone
Set the rate for your agricultural input and instantly calculate the total cost of variable rate application. Choose how you want to apply it: stick with industry standards or create a fully custom VRA strategy.
Export the variable prescription map for use in agricultural machinery
Export prescription maps with variable rates in SHP or ISOXML (ISOBUS) formats. These VRA files are compatible with most agricultural machinery, including John Deere, Trimble, and AGCO.
How farmers apply VRA maps from EOSDA Crop Monitoring
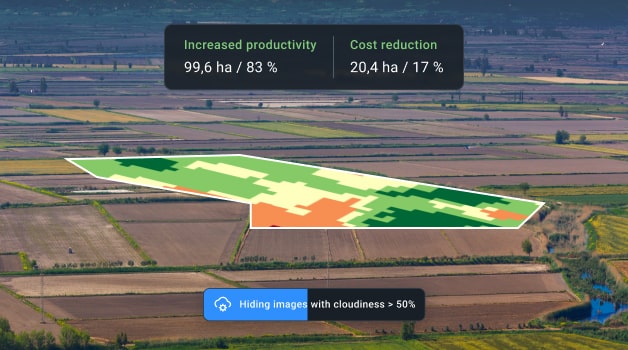
Optimize variable seed placement based on satellite imagery analytics
Osman grows wheat in Turkey and used to struggle with uneven field productivity. Without clear data, he couldn’t adjust seeding rates properly and often wasted resources. Using VRA technology based on historical NDVI in EOSDA Crop Monitoring, he created management zones for spring sowing. The platform automatically removed cloudy images, ensuring accurate NDVI averages.Osman exported a variable rate application prescription fully compatible with his tractor, which let him apply more seeds in high-potential zones and save on lower-potential ones. That simple step cut seed costs by 17% with no loss in yield.
Identify stress factors in specific soybean field zones
In parts of his soybean field, Diego, a farmer from Argentina, noticed low crop vigor but didn’t know why. Using Map builder, he compared NDVI with elevation and soil organic matter test results. The pattern became clear: poor-NDVI zones matched areas with steep slopes and shallow topsoil.Based on the variable rate prescriptions, Diego skipped P&K application on these low-potential zones — saving $28 per hectare — and focused his fertilizer budget on more promising zones.
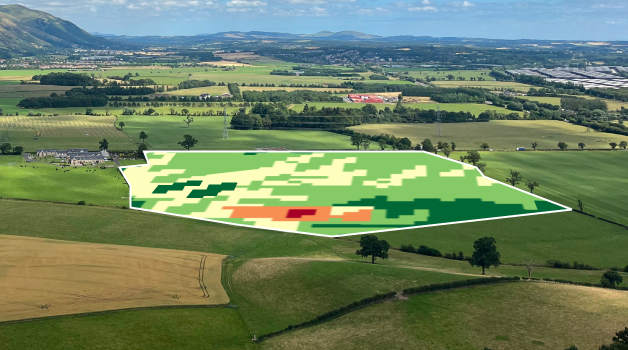
Evaluate new field potential ahead of the growing season
Carlos, a large-scale farmer in Brazil, had just added a new rented field. To avoid wasting time scouting blindly, he reviewed two years of NDVI imagery to assess productivity trends and limiting factors. A consistent low-performing zone in the southern area stood out on the variable rate application maps.Rather than scout the entire field, he sent his agronomist to check just that 15%, thus cutting scouting time and costs by half. This targeted field check uncovered a soil compaction problem that had been limiting yields for years but had never been diagnosed until using VRA technology.
Features of VRA maps on EOSDA Crop Monitoring explained
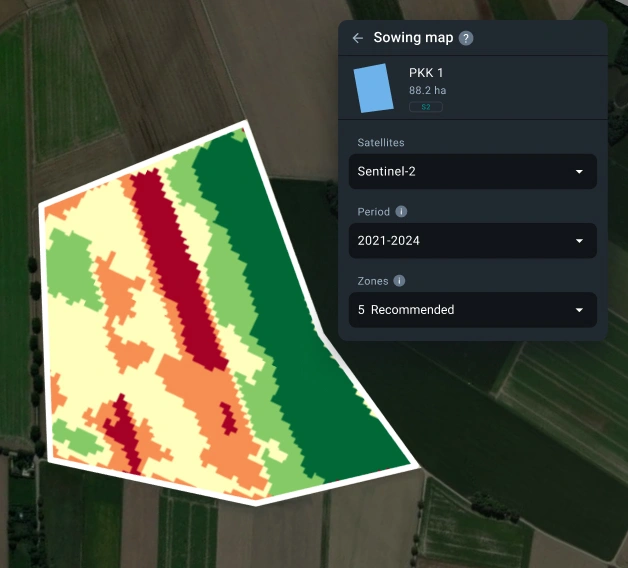
Sowing maps
- What it does: Automatically splits your field into 2 to 7 zones for variable rate applications based on how productive each of them has been in past years, using historical NDVI data.
- Why it matters: Makes it easy to apply seeds and starter fertilizers at variable rates based on field productivity (e.g., using more where yields tend to be higher and less where not). As a result, you use inputs more efficiently and increase overall germination rates.
- How to use it: Select a period (from 2016 till now), set the number of zones for variable rate application, click Calculate, assign seeding rates for each zone, and export the file to your tractor.
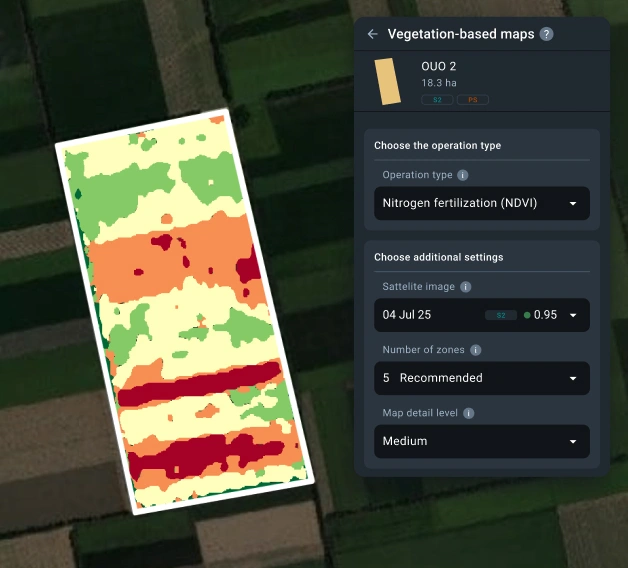
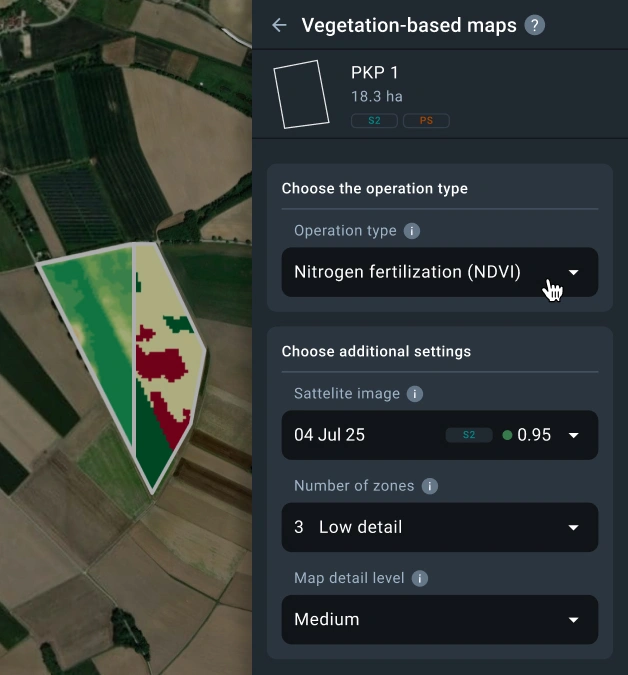
Vegetation maps
- What it does: Analyzes recent satellite images with 4 vegetation indices (NDVI, NDRE, ReCl, MSAVI) to visualize crop health and guide decisions for variable rate fertilizer/treatment applications.
- Why it matters: You can make variable rate applications only where crops need them based on the index-based guidance for each type of treatment:
- nitrogen fertilization
- crop desiccation
- growth regulator application
- micronutrient application.
- How to use it: Select the field activity you want to perform at variable rates, and the system will automatically suggest the optimal settings and vegetation indices. Choose the latest cloud-free satellite image, select the number of application zones and detail level, click Calculate, assign variable application rates for each zone, and export the VRA file to your agricultural equipment.
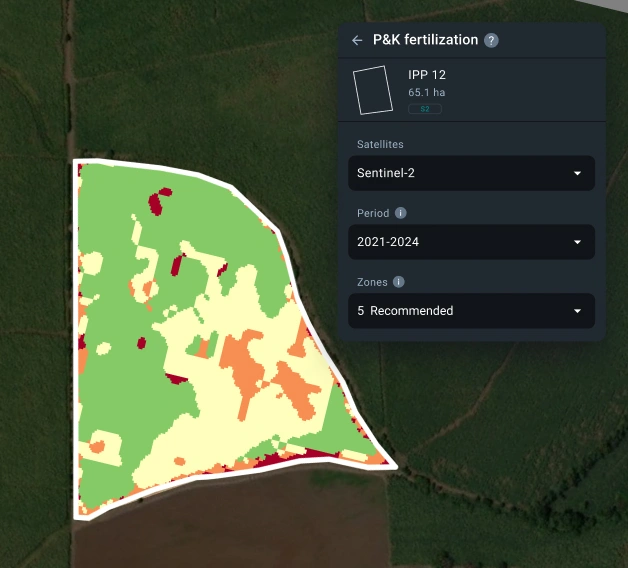
P&K fertilization maps
- What it does: Uses NDVI data from a specified time period to automatically divide your field into 2–7 zones for variable rate applications, depending on the past productivity of each zone.
- Why it matters: Ensures you’re not spreading phosphorus and potassium fertilizer evenly “just in case”. With the variable rate P&K application, you can focus on zones that can really pay off and reduce waste in low-demand zones.
- How to use it: Select a period at your discretion, set the number of zones, click Calculate, assign variable application rates for each zone, and export the file to your agricultural equipment.
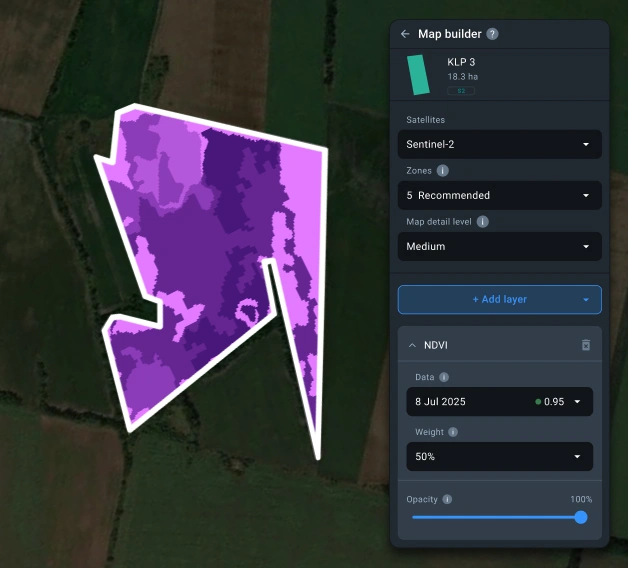
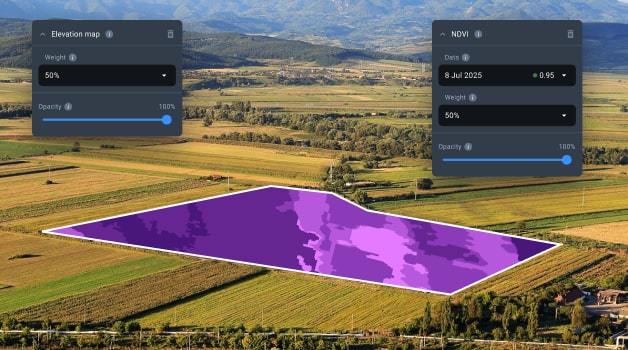
Map builder
- What it does: Lets you combine different data layers that you see fit, such as one of 5 vegetation indices, elevation, or your own yield records, to create a custom agriculture VRA plan.
- Why it matters: Layering elevations, which affect nutrient requirements and moisture retention, with vegetation index data ensures smarter variable rate input applications, especially on uneven terrain. Yield data from agricultural machinery allows for validation and adding even more precision to satellite-derived insights.
- How to use it: Upload your yield data via Data manager or select from built-in satellite and elevation layers. Adjust weights, detail level, number of variable rate application zones, and export a powerful, multi-layered VRA prescription for use in your agricultural equipment.
Trusted by


FAQ about VRA maps
Quick answers to top questions
How do I know if my field is suitable for variable rate application?
Your field is suitable for variable rate application if parts of it grow at different rates, have varying soil types, or produce inconsistent yields. VRA can help you adjust input applications based on what each area actually needs.
What kind of data is needed to create a VRA map?
To create a variable rate application map, satellite imagery, soil tests, yield records, and topographic information are the common types of data. You can use just one data type or combine them.
Can I create a VRA map without hiring an agronomist?
Yes, many digital platforms, including EOSDA Crop Monitoring, let you build VRA maps yourself using a user-friendly interface, readily available data, and an automated algorithm for creating application zones.
What’s the difference between VRA maps and regular prescription maps?
A VRA map varies input application rates across different zones, while a regular prescription one usually implies the application of the same rate across the whole field.
Can I combine different data sources (e.g., soil tests, yield records, satellite imagery) in one VRA map?
Yes, you can combine soil, yield, and satellite data in one variable rate application map in the Map builder. Combining several layers of data allows for creating more precise zones and variable rate application plans.