NDRE: Normalized Difference Red Edge Index
Normalized difference red edge index (NDRE for short) is a method of measuring the amount of chlorophyll in the plants. The best timing to apply NDRE is mid-to-late growing season when the plants are mature and ready to be harvested. At this point, other indices would be less effective to use.
Let’s dive into details and see how to use normalized difference red edge vegetation index for monitoring crops on our Platform. You will find out why this index is more effective at later stages of plant development.
NDRE Vegetation Index: How It Monitors The Health Of Crops
NDRE is a vegetation index used in remote sensing for measuring the chlorophyll content in plants (read more about precision agriculture). It is represented by a certain value calculated using a combination of a Near-InfraRed (NIR) band and the RedEdge range between visible Red and NIR. The NDRE formula is:
Such a band combination makes NDRE extremely sensitive to those wavelengths of light that are reflected by the chlorophyll contained within the plants.
The normalized difference red edge index can, therefore, be applied to confirm whether a growing plant is healthy or not. Low amounts of chlorophyll may indicate the problem crops:
- sick plants,
- plants infested with pests,
- plants with nutrient deficiencies,
- damaged plants.
How To Read NDRE Imagery On EOSDA Crop Monitoring
Since chlorophyll is crucial to the process of photosynthesis, its quantity is an important indicator of the plant’s health. On our agriculture platform, we’re using a standard scale of -1 to 1 for the NDRE index. It’s important to know how to correctly interpret the values:
- -1 to 0.2 indicate bare soil or a developing crop;
- 0.2 to 0.6 can be interpreted as either an unhealthy plant or a crop that is not mature yet;
- 0.6 to 1 are good values indicating healthy, mature, ripening crops.
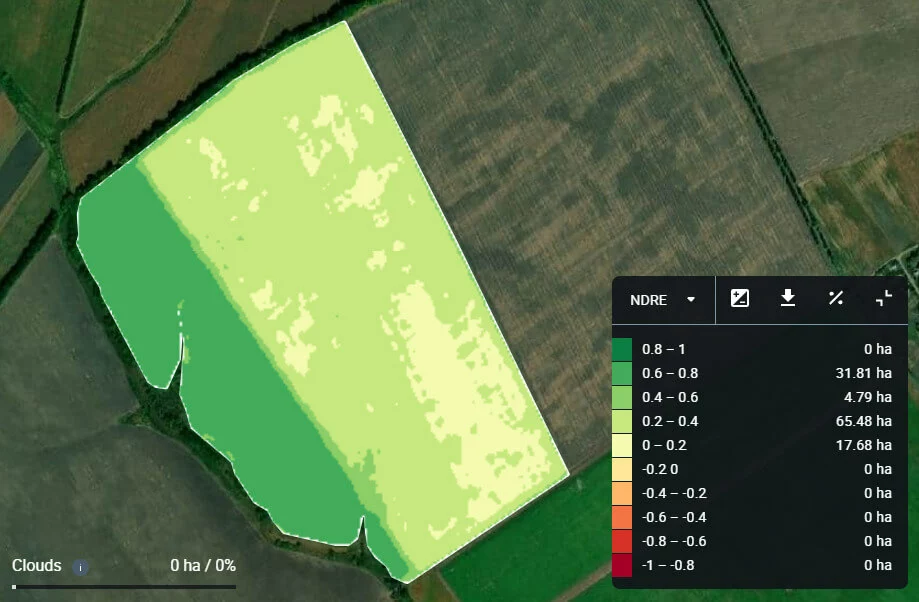
To make things a little easier for the user, we’ve tied colors to each possible value. The scale ranges from saturated red for -1 to saturated green at +1. In between there are different hues of red, orange, yellow, and green, according to the standard “rainbow” palette.
So, as we can see, on EOSDA Crop Monitoring, values of NDRE lower than 0.3 may be a tell-tale sign of an unhealthy or stressed plant. On the flip side, low values could also stand for bare soil and young plants. Which is why, at early growth stages, we recommend using MSAVI.
NDRE In Action: Practical Applications On EOSDA Crop Monitoring
When To Use NDRE Index
The best time to apply the normalized difference red edge index is when the crop is mature and ripening. That usually occurs towards the end of the growing season. During the mid-to-late season, values below 0.6 will almost definitely suggest some form of damage to the crop.
At this point, NDRE is a much better indicator of crop health or lack thereof than NDVI. The latter will focus on the density of the plant canopy and the greenness of its upper layer. That is why using a NDRE map for variable-rate fertilization, spraying, precision irrigation, fertigation, and other field activities will be more effective at later growth stages.
Precision Fertilizer Mapping
When it comes to nitrogen fertilizer application, NDRE imagery on EOSDA Crop Monitoring provides the most accurate picture. This is due to the correlation between nitrogen and chlorophyll content in plants.
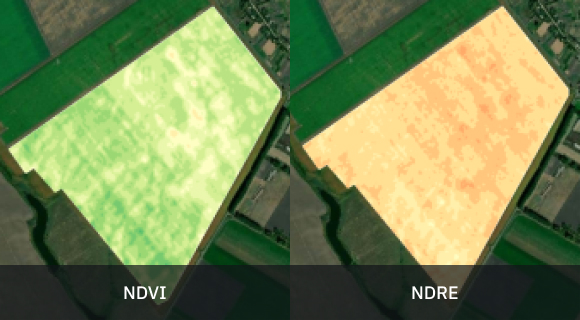
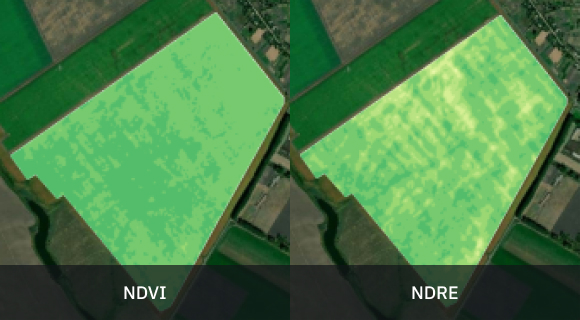
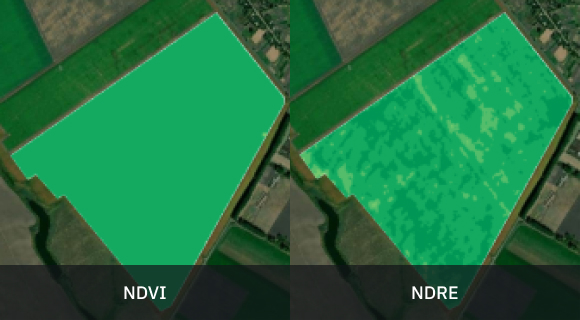
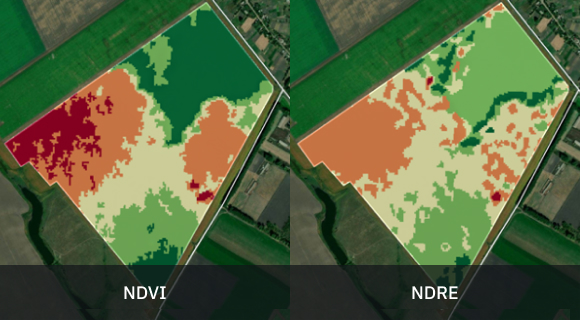
In fact, NDRE maps can be successfully used for the differential application of other fertilizers as well. Especially at later growth stages, when NDVI vegetation maps are not as accurate. For example, these two images below show the same field with its vegetation measured by NDVI (on the left) and NDRE (on the right), respectively. Notice how the top corner of the field looks healthy (dark green) according to NDRE, while NDVI measures lower density and/or greenness.
The crop in the image was in its latest stages of development. Its upper layer of canopy started to turn yellow and/or shrink, which is a normal indicator of readiness for harvesting. NDVI naturally dropped detecting lower density and less greenness.
Nevertheless, NDRE easily identified the presence of large quantities of chlorophyll within multiple canopy layers. It meant that beneath the upper layer of canopy, the plant was healthy and ripe for harvest.
If the owner’s decisions had been based solely on NDVI measurements, they might have opted for fertilizing a large portion of the field that appeared stressed. Yet this would have been a very expensive mistake. Luckily, the farmer applied NDRE available on EOSDA Crop Monitoring and avoided wasting as much as 500 units of fertilizer.
NDRE For Deep Canopy Penetration
Normalized difference red-edge index is designed to “see” deep through the dense vegetation canopy. This makes it an ideal tool for monitoring densely planted fruit crops, like:
- apple,
- banana,
- citrus,
- mango,
- pineapple.
As well as some other crops, like: coffee, corn, cotton, pepper vine, sunflower, among others.
NDRE – A Powerful Remote Sensing Tool
The choice of a vegetation index largely depends on the needs of a farmer, type of crop, and growth stage. NDRE can be used as a stand-alone index for monitoring the health of crops like coffee, corn, and banana, among others, throughout most of the growing season. Yet it can also be used in combination with NDVI or any other indices, to determine the state of any crop at mid-to-late stages of development. On EOSDA Crop Monitoring, these and other indices are easy to use and will provide you with crucial data needed to grow healthy crops and improve yields.