Satellite images of Canadian wildfires
- Location
- Canada
- Coordinates
- 54.03298°N, 104.83544°W
- Satellite
- Landsat 9
- Tags
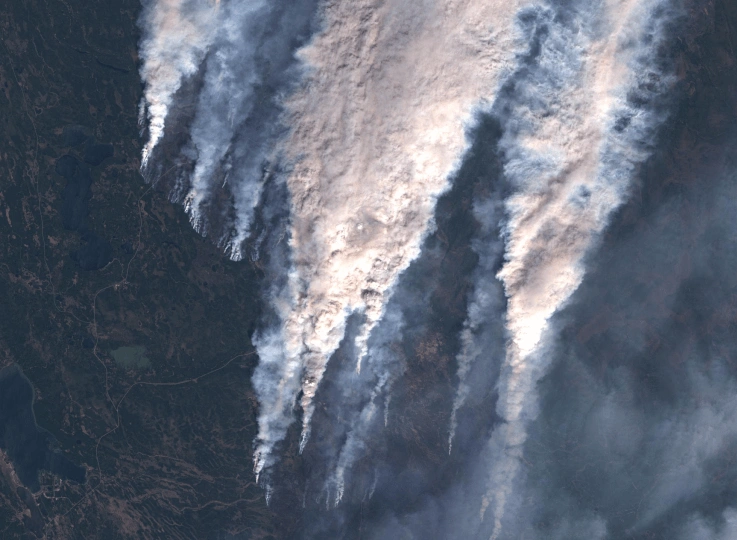
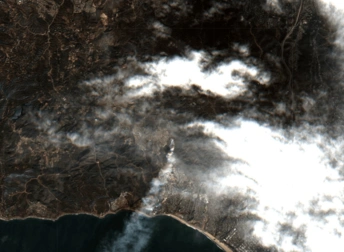
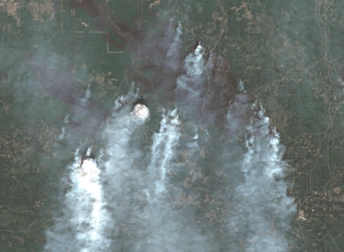
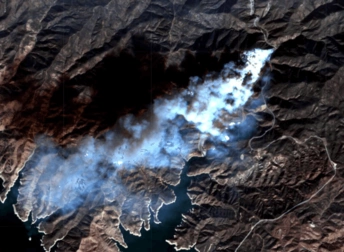
Recently, wildfires in Canada have grown more intense. In late May 2025, devastating fires were burning across western regions, forcing evacuations and closing highways. The Landsat 9 satellite image from May 26 gives a snapshot of this reality: smoke rising in thick columns and drifting over nearby towns and the forest below, appearing patchy and blackened.
Key Facts About Canadian Wildfires
In May 2025, unusually hot and dry weather triggered over 160 fires across Manitoba, Ontario, and Saskatchewan. They spread quickly to Alberta, British Columbia, and the Northwest Territories, destroying homes, displacing over 33,000 residents, and covering North America in thick smoke. By August, more than 7 million hectares (17 million acres) had burned, which means it was one of the most destructive burning seasons in the country’s history. Emergency crews relied heavily on live satellite fire maps of Canada to track hotspots, guide evacuations, and manage resources during a crisis. The disaster revealed how fragile Canada’s ecosystems are under climate stress.
Interpretation Of Canada Wildfires Satellite Imagery
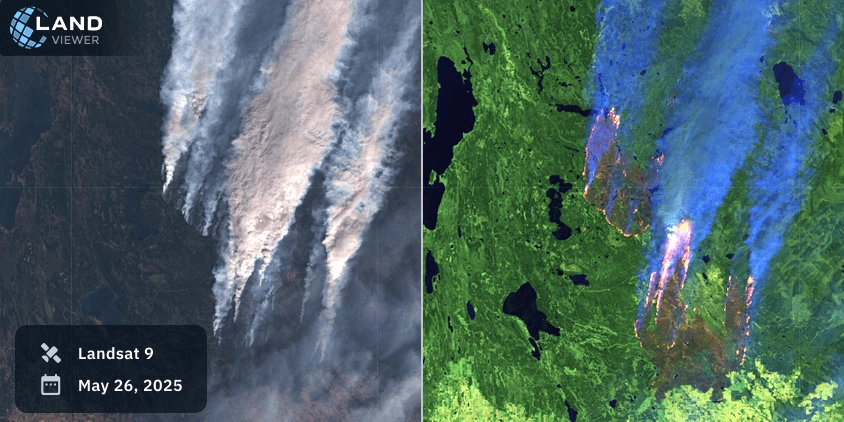
We can look at satellite images of the Canadian fires to understand their scale. Landsat 9 satellites captured the view of the Shoe fire on May 26, 2025, showing both the visible impact and the hidden details of the burn.
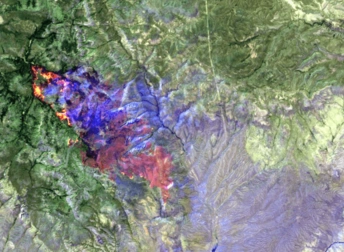
On the left, the natural color satellite image captures the scene much as it would appear to the eye. Massive smoke columns rise from active burning fronts, drifting northeast with the wind. On the right, the same satellite image, processed with false color, highlights fire activity in a different way. Bright red and pink mark active burning zones, smoke appears blue, and green marks healthy vegetation. False-color imagery allows for following the thermal activity even where smoke covers the ground.
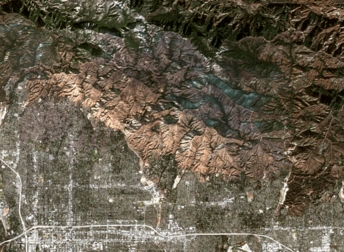
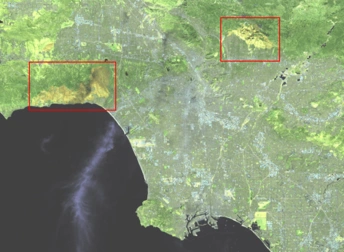
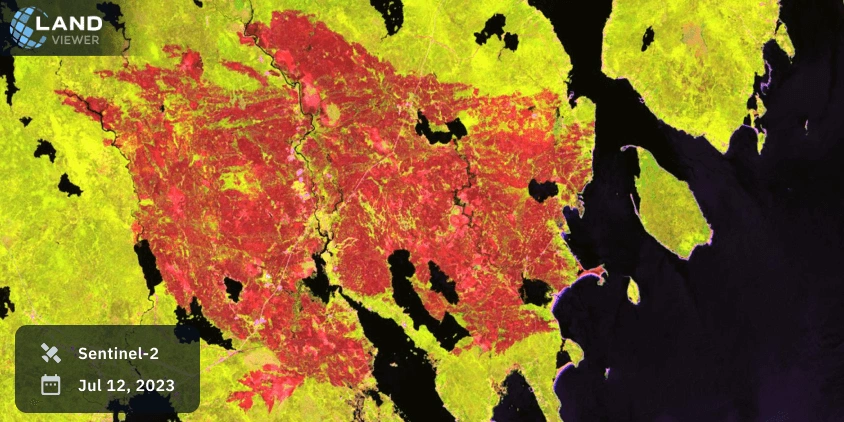
Because of its size and the lasting impact it left on Nova Scotia, the Barrington Lake fire remains a reference point for understanding combustion risk in the region. To assess its footprint, specialists use the Vegetation Analysis band combination. In this processed wildfire satellite map of Canada, recently burned ground appears in vivid red and severe burn scars in dark red and brown. The processed map highlights where the fire was most destructive and where recovery may already be possible.
Historical Background Of Wildfires In Canada
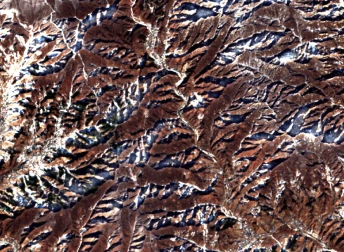
While Canadian forests, particularly the boreal region, are naturally adapted to fire and depend on it for renewal, climate change has lengthened the burning season and increased the risk of uncontrollable, high-severity fires. Since official record-keeping began in the 1950s, the country has averaged 8,000 fires and roughly 2 million hectares burned annually, but recent years have seen this average rise sharply due to hotter, drier conditions. The most destructive season occurred in 2023: over 16.5 million hectares (40.8 million acres) burned, which is seven times the historical average and surpasses all previous records.
As fires became more frequent and intense over the years, live satellite wildfire and smoke maps for Canada started playing a bigger role. Since the 1990s, satellite maps have helped track burned areas and how forests recover, paving the way for newer tools that deliver regular thermal anomaly updates for Canada.
Explore Canadian wildfires further in EOSDA LandViewer to analyze real-time and historical satellite maps.