Stay ahead of wildfires with satellite-powered detection and monitoring

EOSDA LandViewer provides powerful tools to monitor forest and wildfire risks, visualize changes over time, and support decision-making for prevention and recovery — your all-in-one solution for wildfire management:

  • early fire detection to spot active fires before they spread, using satellite imagery and thermal data
  • burned area mapping to assess affected zones through vegetation and burn indices like NBR
  • recovery monitoring to track vegetation regrowth and evaluate post-fire impact over time.
forest fire detection using satellite images

Toolkit for wildfire detection, mapping, and recovery on EOSDA LandViewer

Forest fire detection

The sooner wildfires are detected, the easier it is to keep them under control, particularly in hard-to-reach areas. Satellites with thermal sensors can identify hotspots (seen as heat anomalies) even through smoke and clouds. With this wildfire detection technology, authorities can respond quickly, minimize damage, and improve existing early warning systems.

detecting forest fires in Otay Mountain

Burned area mapping

After a wildfire, it's important to map the burned areas to understand how far the fire spread, how severe it was, and what damage it caused. Satellite indices detect burned vegetation and soil by comparing conditions before and after the blaze: burned areas show lower NIR and higher SWIR reflectance. Index-based maps support recovery efforts, insurance claims, and ecological studies.

California wildfire satellite view with NBR

Monitoring of vegetation conditions (fuel load assessment)

Monitoring vegetation health and moisture with NDVI and NDMI helps see where vegetation is dry enough to feed wildfires. Dry or drought-hit areas are easy to spot: healthy plants reflect strongly in NIR, while stressed ones lose greenness and moisture. Regular monitoring highlights fire-prone regions, allowing for prevention steps and resources to be put in place beforehand.

satellite wildfire monitoring in California with false-color imagery

Disaster response and management

Forest fire satellite imagery supports every stage of wildfire management: spots active blazes to support firefighting, assesses the damage, and tracks vegetation recovery. Over time, vegetation indices measure tree regrowth, reforestation, and ecosystem health to minimize the risk of forest blazes. Owing to short-term and long-term insights combined, satellite indices are invaluable for both emergency response and sustainable forestry.

forest fire from space, Los Angeles County

How to use satellite images for forest fire monitoring

Set your AOI (area of interest)

Choose the area you want to monitor for wildfires: search for it, draw it on the map, or upload a file, so detection results match the exact area at risk.

Search and select the relevant scene

Use filters like date, cloud cover, sensor, and AOI coverage to narrow your search. This helps you find the right imagery for the detection of active wildfires, mapping burned areas, or analyzing post-fire impact.

Apply indices or band combinations

Enhance your wildfire detection and analysis with vegetation indices and custom band combinations. Use NDMI, NBR, and other relevant indices to spot early warning signs, assess damage, and keep an eye on vegetation condition in your area.

Run advanced analytics for early forest fire detection

Use tools like Time series analysis, Change detection, and Clustering to monitor wildfire activity, measure burn severity, and follow forest recovery trends. They provide actionable insights for decision-making, such as prioritizing monitoring, allocating firefighting teams, and evaluating long-term forest safety.

setting the AOI on a map for early wildfire detection searching for the most relevant wildfire satellite images selecting an index to apply to AOI analyzing satellite images of wildfires with different tools

Key features for forest fire detection and analysis

Indices and band combinations

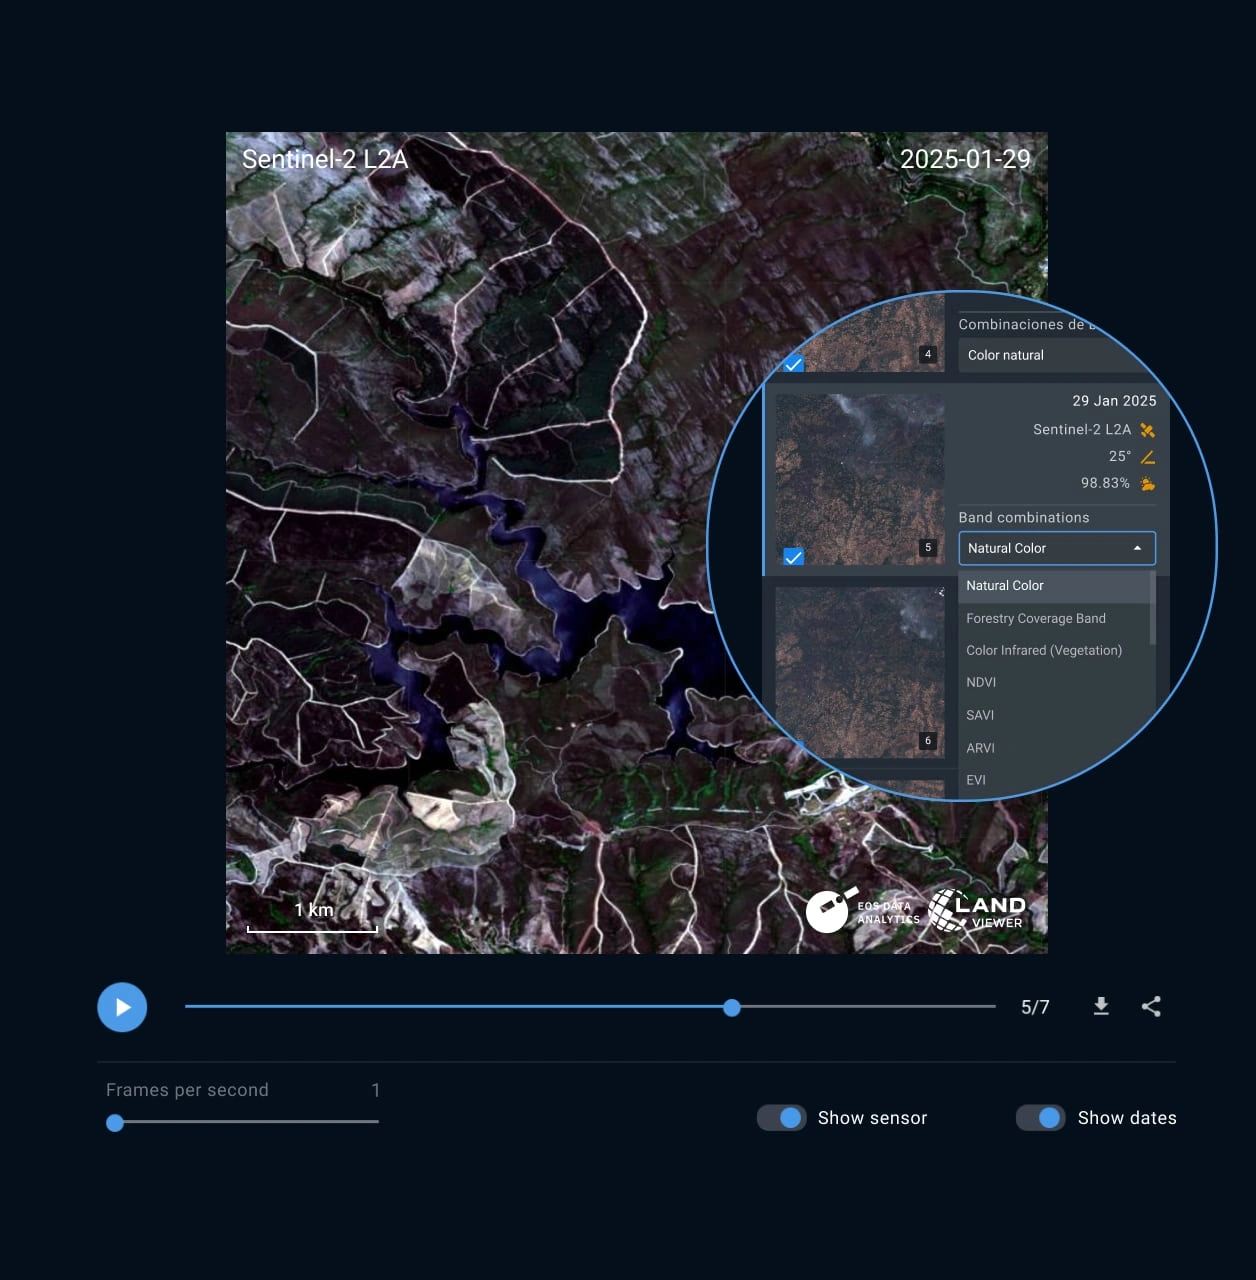
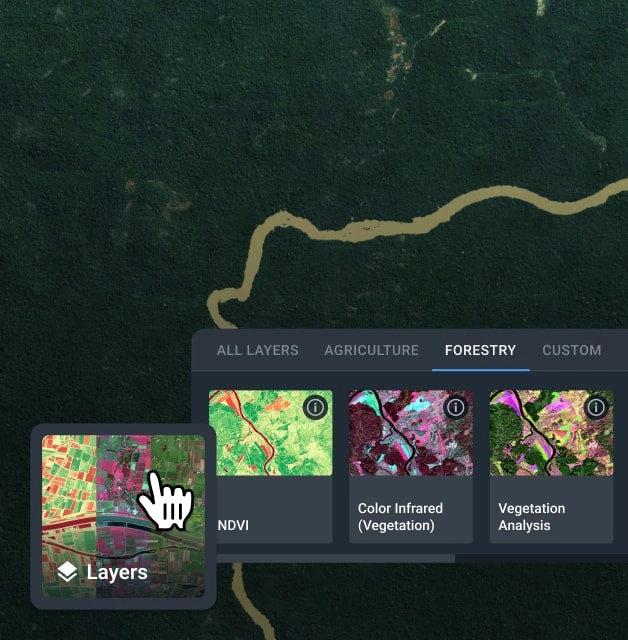
Use over 20 pre-set indices, including NBR and NDMI, or create custom band combinations on EOSDA LandViewer to analyze forest health and wildfire conditions:

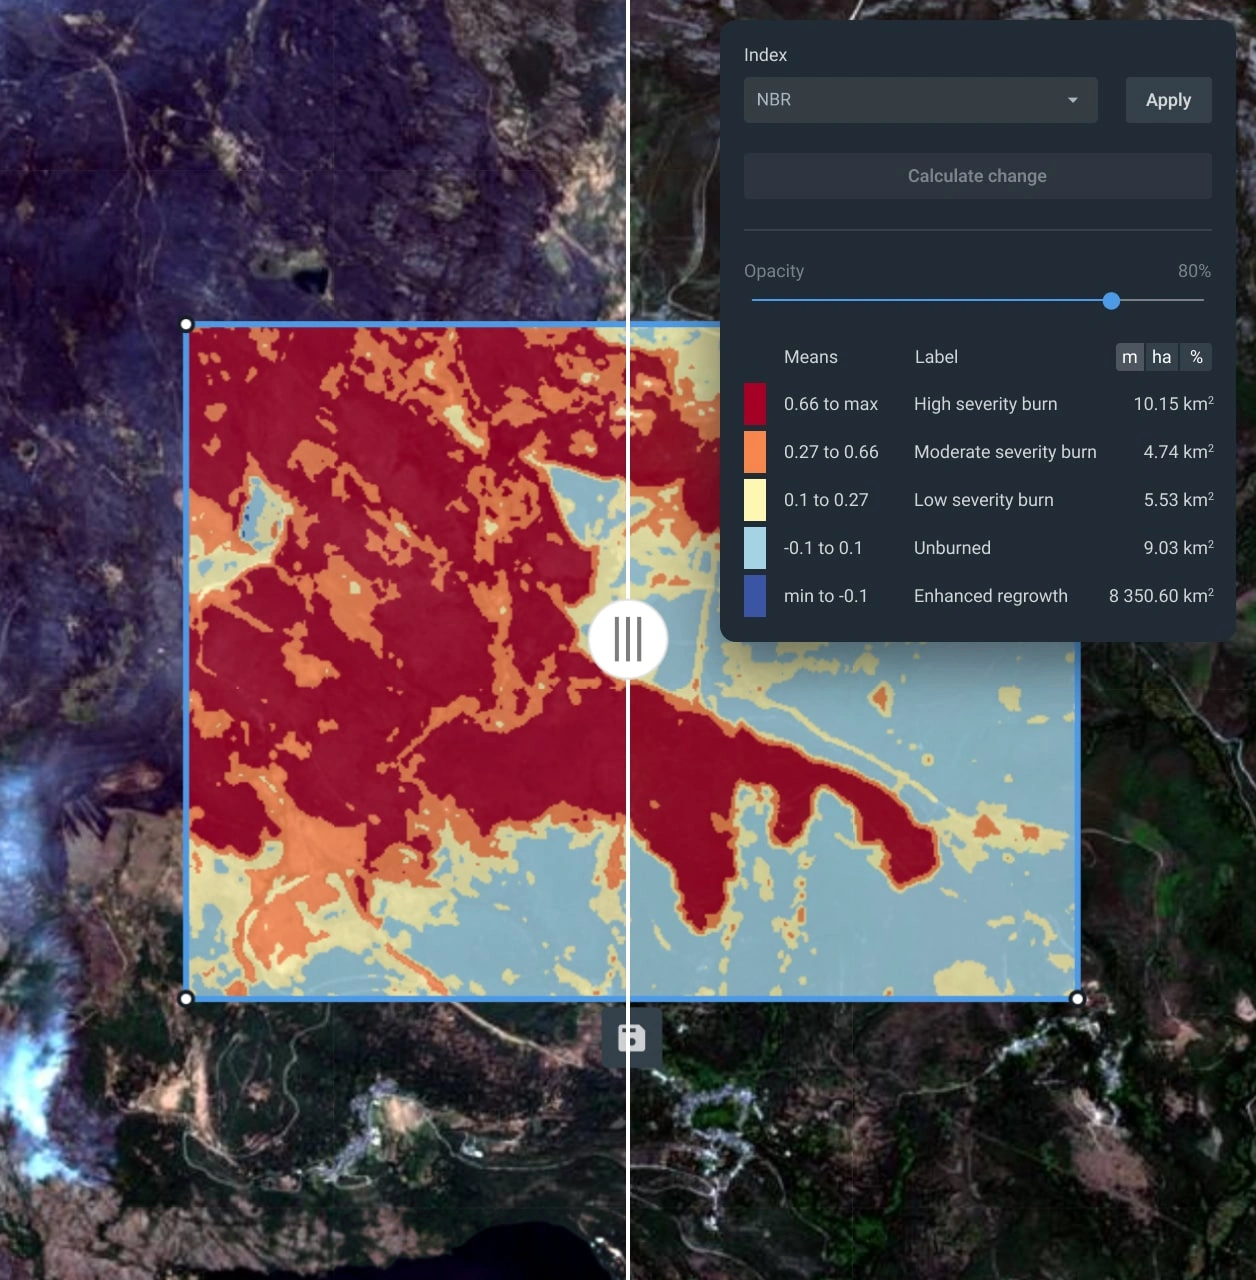
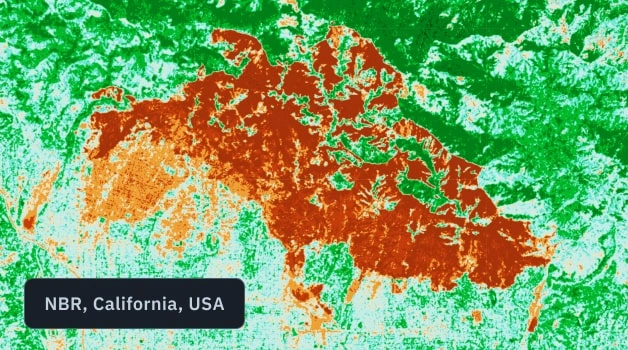
  • NBR – maps burned areas and fire scars for post-fire assessment;
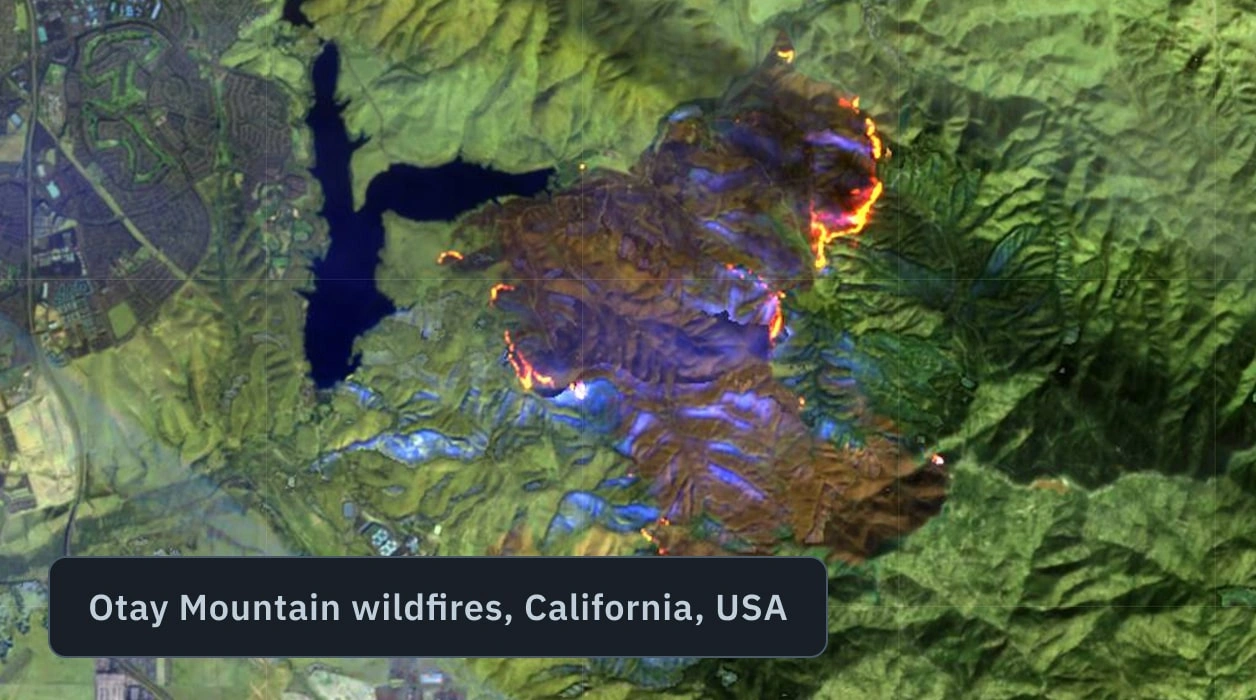
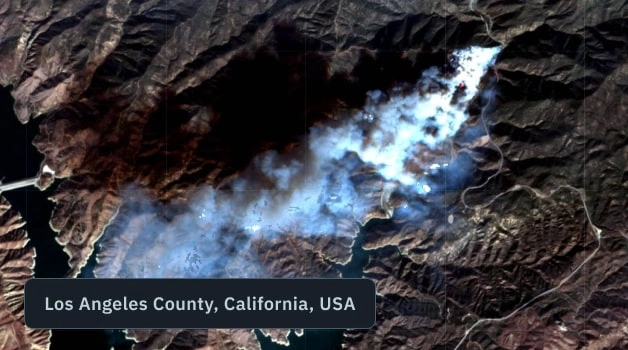
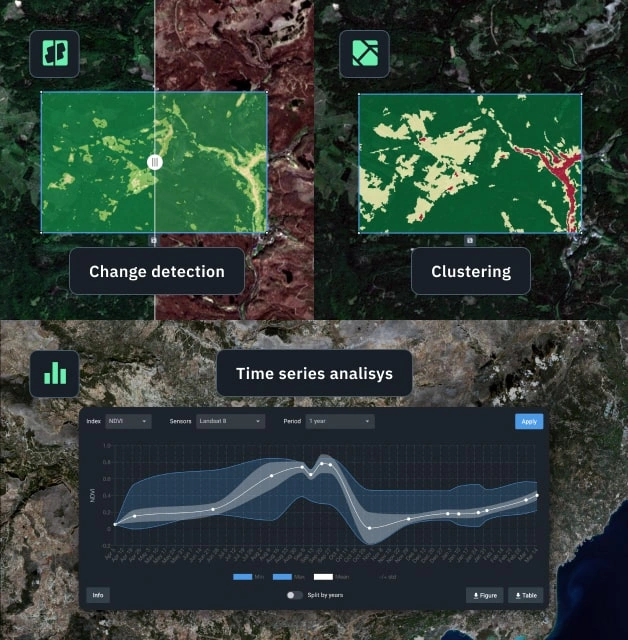
  • Fire detection index – spots active wildfires or fire-prone areas when used with Change detection;
  • NDMI – tracks vegetation moisture to detect stress and ignition risk;
  • NDWI – highlights low water content, guiding forest fire prevention;
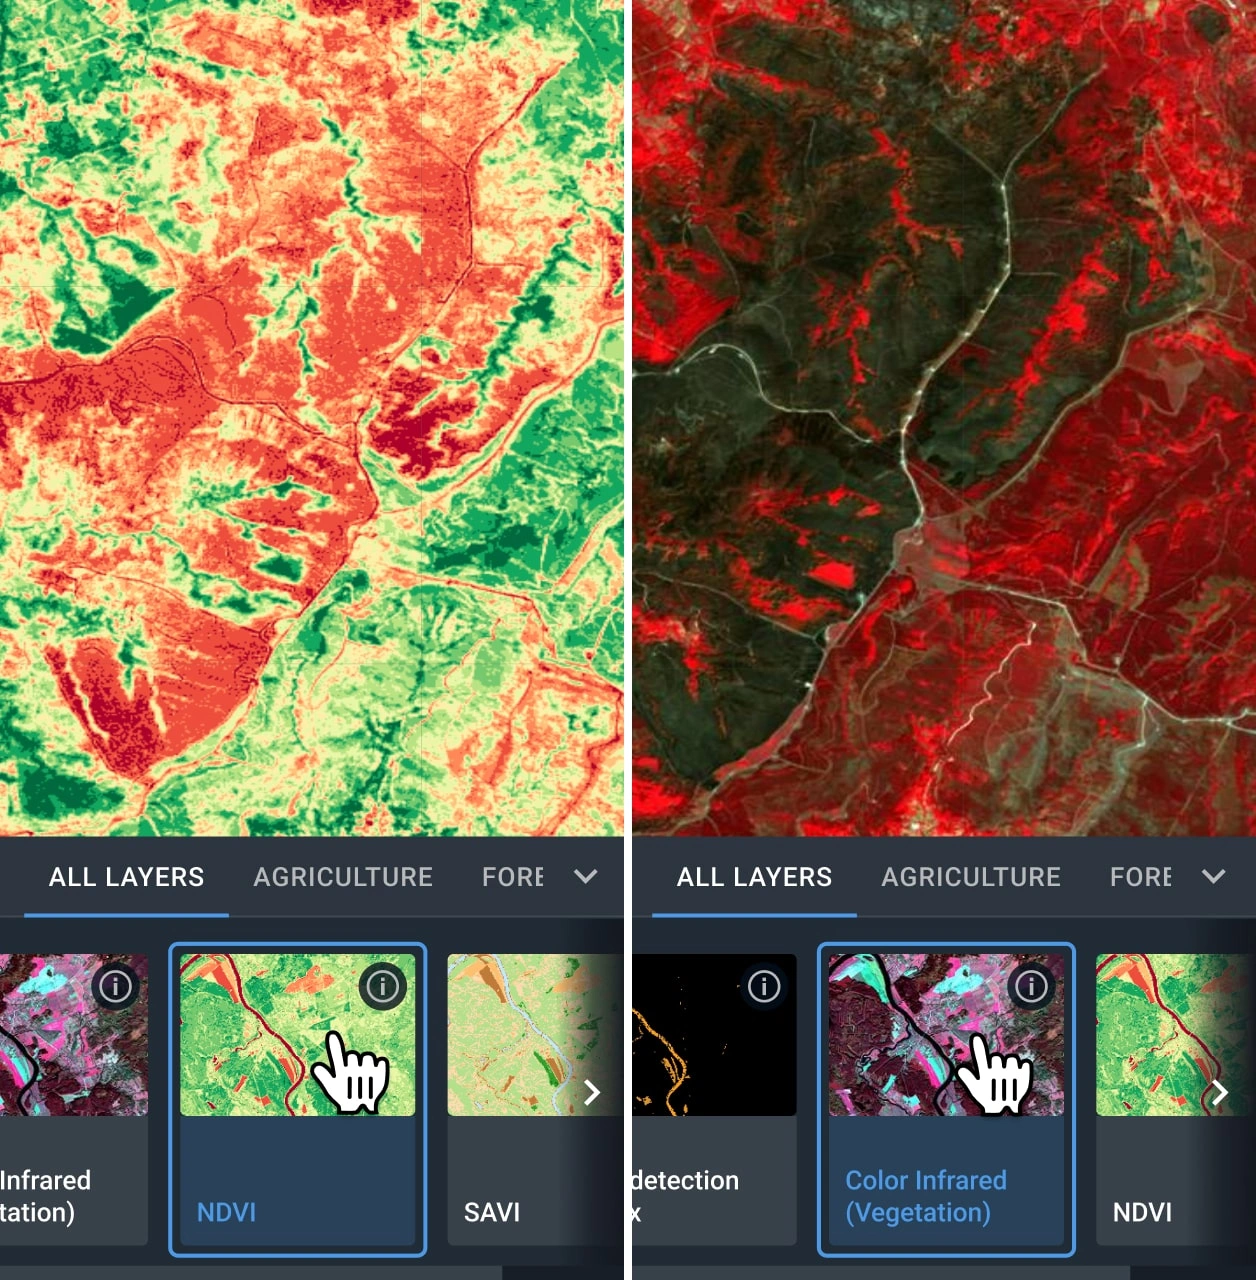
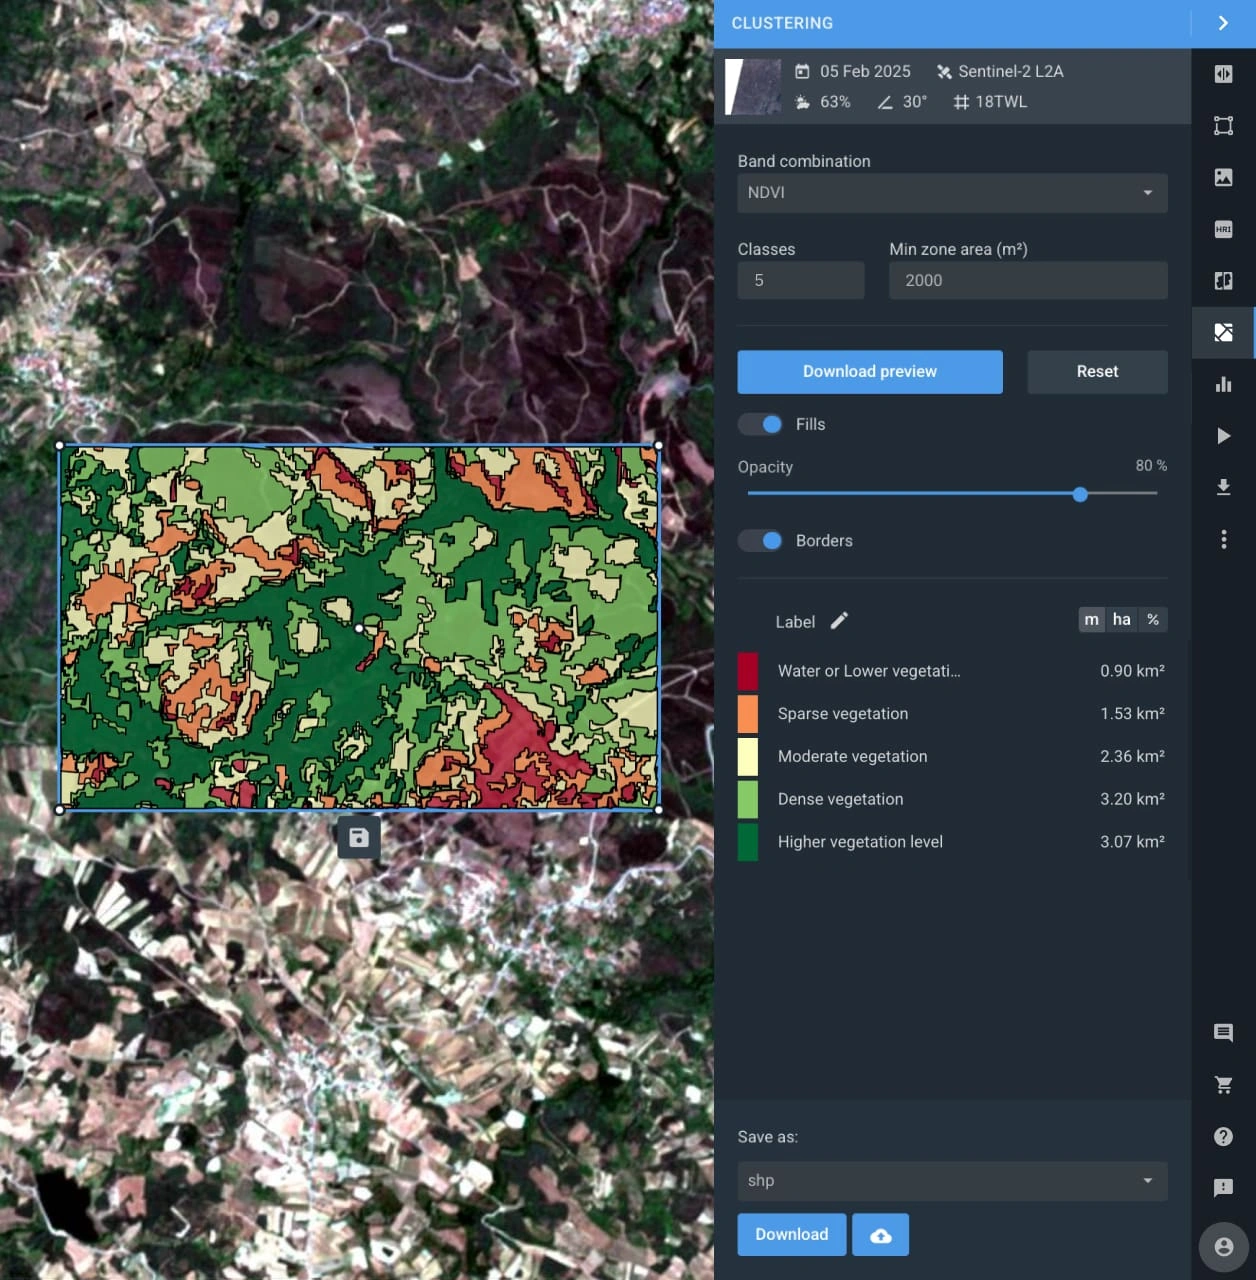
  • NDVI – monitors sparse or stressed vegetation for wildfire preparedness;
  • False-color band combination – visualizes burned vs. healthy areas for recovery planning.
application of indices and band combinations

Change detection

The Change detection feature on EOSDA LandViewer makes it easy to compare satellite images from before and after a wildfire. With vegetation indices like NDVI and NBR integrated into this feature, users can immediately spot burned areas, assess how badly vegetation was affected there, and effectively plan recovery efforts.

applying change detection to satellite images of forest fires

Time series analysis

Time series analysis of satellite images lets you follow how vegetation and moisture change over time, thus helping in the detection of rising ignition risk. By applying indices like NDVI, NBR, and NDMI, the tool helps you see early signs of stress, highlight fire-prone zones, and measure how land recovers after a burn.

time series analysis for ignition risk detection

Clustering

Clustering on EOSDA LandViewer groups satellite data by vegetation, moisture, and burn levels to show clear patterns on the map. It helps separate burned from healthy areas, highlight high-risk zones, and focus resources on prevention or recovery. The feature gives a clear view of fire impact and vegetation stress directly on the platform.

clestering applied for forest fire detection