NDVI vs. NDRE: Comparing Uses And Pros For Farmers
NDVI vs. NDRE is often framed as a choice, but in practice, they work best together. NDVI usually comes up first. It’s the classic vegetation index, built on how plants reflect red and near-infrared light. But it has a blind spot: once canopies get dense, its values flatten, masking problems beneath the surface.
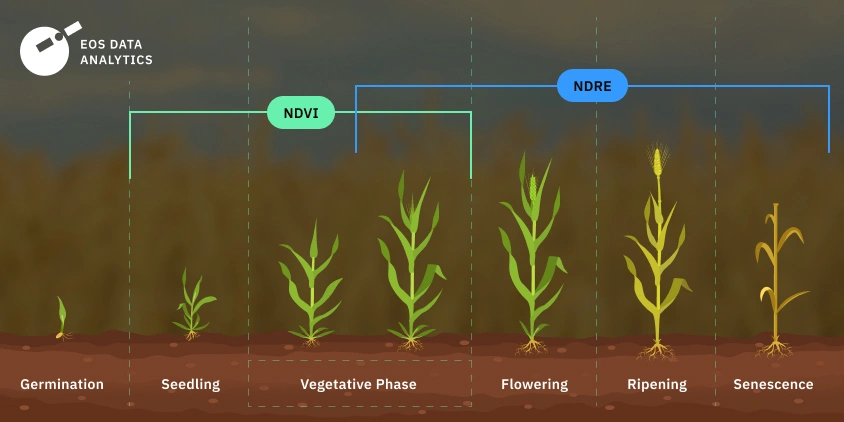
NDRE was designed to catch what NDVI misses. By using red-edge instead of red, it reveals chlorophyll variation hidden under layers of leaves. Savvy farmers use both indices in sequence: NDVI early in the season, NDRE later on. Understanding how NDVI and NDRE differ means you can match the right tool to the right growth stage.
What is the difference between NDVI and NDRE?
NDVI (normalized difference vegetation index) and NDRE (normalized difference red edge index) are both index products that analyze vegetation using two wavelengths of light. In both cases, one of these wavelengths is near-infrared (NIR), which plants reflect strongly when healthy. The second wavelength differs: NDVI uses the red band, whereas NDRE replaces it with red-edge.
NDVI imagery highlights the presence and density of green vegetation to identify bare soil, sparse cover, or vigorous growth at a glance. However, the red band saturates in dense crops, which reduces index accuracy later in the season.
NDRE avoids this saturation by using red-edge light that penetrates deeper into leaves. It provides clearer information on chlorophyll and nitrogen status during later crop growth stages. To better understand how NDVI and NDRE differ, let’s look at their main characteristics side by side.
| Characteristic | NDVI | NDRE |
|---|---|---|
| Spectral bands | Red and near-infrared (NIR) | Red edge and near-infrared (NIR) |
| Formula | (NIR – Red) / (NIR + Red) | (NIR – Red Edge) / (NIR + Red Edge) |
| Purpose |
|
|
| Sensitivity | Sensitive to early growth stages | Sensitive to dense crops and later growth stages |
Why monitoring only NDVI is not enough
Farmers often trust NDVI as a standard, quick health check for their crops because it clearly reflects leaf greenness. And it works — but only up to a point. Extra layers of foliage cause the index to saturate . So, when plants mature and fields grow dense, the normalized difference vegetation index readings “flatten out,” showing uniform green even if crops are struggling with stress or nutrient loss.
How NDRE supports crop management later in the season
The normalized difference red edge index is particularly valuable once crops build dense foliage, as it captures chlorophyll variations beyond the upper leaves. Sugarcane and cereals, as well as avocado and other tree crops, where early stress signs start inside the canopy, benefit from this index. Farmers can use NDRE maps to identify hidden stress zones, adjust nutrient management, and keep plants in optimal condition until harvest.
The difference between NDVI and NDRE is less about which is better and more about timing. Each index gives the most value at specific times during the growing season.
NDVI or NDRE: When to use which?
If your goal is to track overall plant growth or detect field differences early in the season, the normalized difference vegetation index is the right choice. If you need to manage nitrogen, watch chlorophyll levels, or monitor crops later in the season when canopies are dense, the normalized difference red edge index will give you better results. Here’s a closer look at how NDVI and NDRE perform across various crop monitoring tasks throughout the growing season:
- Monitoring crop health. The normalized difference red edge index is best for monitoring crops when canopy cover is still developing. For mid-to-late growth stages, when NDVI tends to saturate, NDRE is more effective.
- Monitoring densely planted crops and perennials. In dense crops like corn at peak growth or perennials such as fruit trees, the normalized difference red edge index is effective thanks to its ability to penetrate the canopy, where the normalized difference vegetation index often saturates and loses detail.
- Mapping field variability. For understanding variability within a field, NDRE is more precise, since it detects subtle nutrient and chlorophyll differences. NDVI mainly reflects overall health and may overlook small-scale variations.
- Early disease and stress detection. Early chlorosis shows up in the normalized difference red edge index before there is a clear loss of greenness or biomass. The normalized difference vegetation index will show the problem only once vigor declines enough to reduce overall canopy reflectance. Scan NDRE first for the weak zones, then use NDVI to confirm spread and severity as stress progresses.
- Nitrogen management. Early in the season, the normalized difference vegetation index can indicate nitrogen status through plant vigor. As crops develop, the normalized difference red edge index detects chlorophyll and leaf nitrogen more accurately and explains up to 88% of the variation, according to studies .
- Optimization of fertilizing and watering. NDRE vs. NDVI helps identify early nutrient deficiencies or water stress. The normalized difference vegetation index, though, reflects overall plant vigor, making it useful for confirming broader trends in crop health and adjusting fertilizing or watering accordingly.
- Biomass monitoring. The normalized difference vegetation index is applied to monitor biomass early in the season, when it correlates closely with overall greenness and leaf coverage (coefficient of determination exceeds 0,7) . The normalized difference red edge index, however, is better suited for mature, high-biomass crops.
- Yield prediction. NDVI is useful for early biomass-based yield forecasts, whereas NDRE captures nutrient status later to estimate the plants’ potential for grain fill and refine final yield estimates.
Understanding the strengths and weaknesses of NDVI and NDRE will help you choose the right index for each stage of your crop’s growth.
How to use NDRE and NDVI on EOSDA Crop Monitoring for decision-making
Raw satellite data is not enough on its own: the values must be processed into indices, mapped, and then interpreted in the context of crop growth. EOSDA Crop Monitoring brings NDVI and NDRE into a ready-to-use format, where you can quickly see how vegetation changes across time and space. With both indices in one place, farmers can connect the signals with field activities and use them as a practical guide for decisions.
Start continuous field monitoring
You can start monitoring NDVI, NDRE, and other indices for fields anywhere in the world right after creating an account in EOSDA Crop Monitoring. Define your field boundaries once, and the precision farming software will display the most recent processed images along with an archive that covers several years back. Updates are delivered as soon as new satellite data becomes available. You will also be notified if the algorithm detects major variations in NDVI, so you don’t miss early signs of crop stress.
Check the typical index for the growth stage
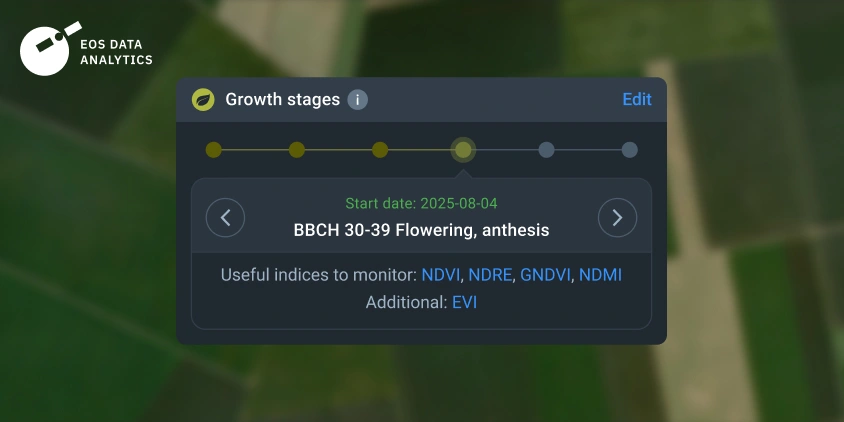
After you add a field, pick the crop, and enter the sowing date, the system estimates growth stages and updates them through the season. For each stage, it lists the indices worth using now, including NDRE or NDVI, so you don’t have to guess. The timeline is driven by growth stage models tied to your sowing date and local conditions.
Compare NDVI and NDRE
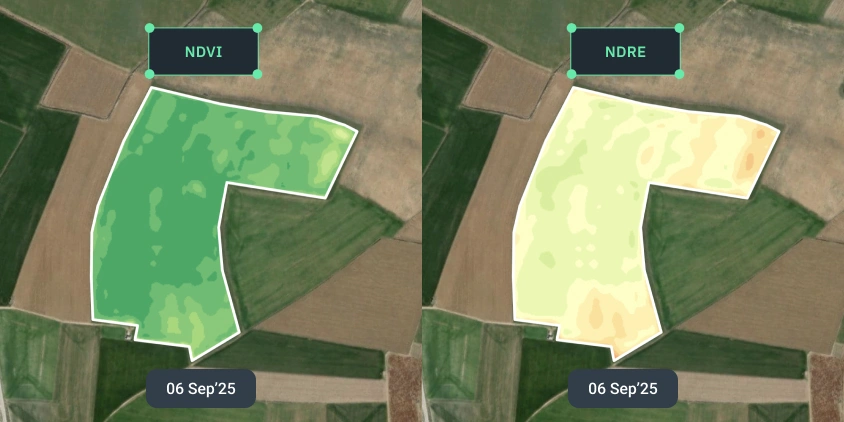
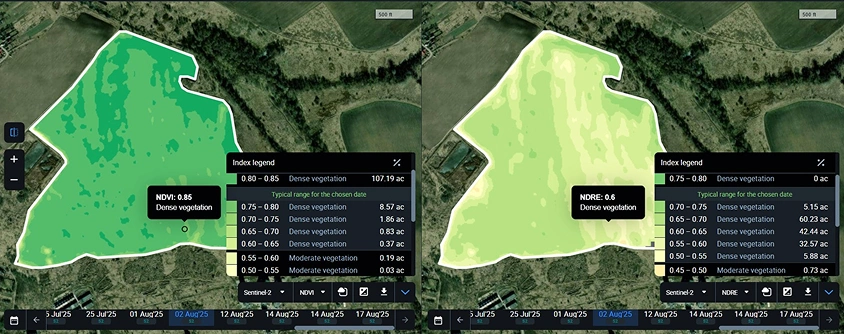
The Split view feature in EOSDA Crop Monitoring makes it possible to compare NDVI and NDRE maps of the same field directly. For example, the NDVI map of the cornfield during the flowering stage (BBCH 60–70) shows vegetation levels that appear almost uniform. At this stage, chlorophyll content is already high, so NDVI can reach a saturation point and mask small differences across the field.
When adding NDRE in the Split view, you can see more variation. NDRE, more sensitive to subtle changes in chlorophyll, highlights areas where vegetation is weaker. These zones may require extra nitrogen application to support biomass growth and ensure proper ear and kernel formation. Comparison of NDVI and NDRE in the Split view gives farmers a more complete understanding of field variability and helps fine-tune input distribution.
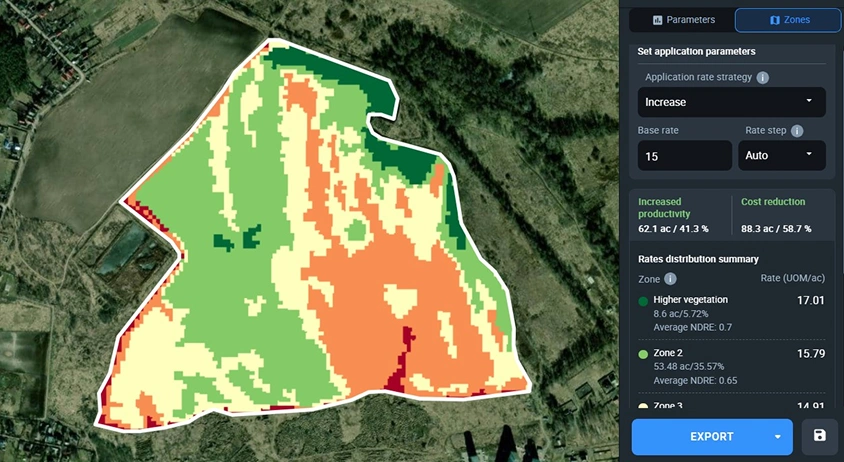
Create fertilization VRA maps
On EOSDA Crop Monitoring, an NDRE image can be turned into a VRA (variable rate application) map for fertilizer distribution. After opening the VRA map – Vegetation section, you choose NDRE as the index and select the date of the satellite image. The platform then generates a map with zones of similar crop conditions. At this step, you can assign fertilizer rates to each zone and define the application strategy. Once the map is ready, it can be downloaded in ISO-XML and shapefile formats, typically required by spreaders and sprayers.
Think of NDVI as your first scan, particularly early in the season: it quickly shows where crops are thriving or lagging. Then use NDRE to find out which zones may lack nitrogen or start losing chlorophyll. Using both NDVI and NDRE during the growing season helps avoid blind spots and puts every dollar spent on inputs to better use.
About the author:
Maksym Bohomolov leads the product strategy for EOSDA Crop Monitoring. With a Master’s degree in International Marketing and firsthand experience at global companies like Mondelez International, he combines strong market and tech expertise. At EOSDA, Maksym focuses on using satellite analytics and AI technologies to deliver real value to farmers and agri-businesses worldwide.
Recent articles
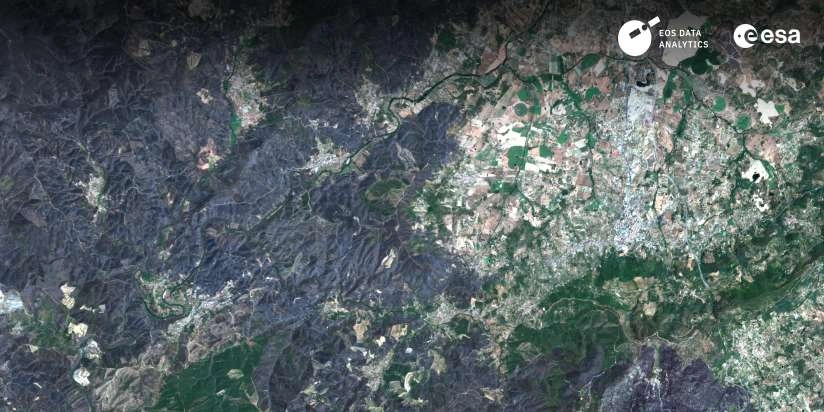
EOSDA to Monitor Wildfires in Portugal Using Satellite Data Under ESA’s InCubed Programme
The company signed a contract with ESA to create an innovative satellite-based solution for forest monitoring and wildfire prevention.
EOSDA Forecasts Yields For 2025 In Saskatchewan
EOSDA created RM-level crop yield forecasts for Saskatchewan to address limitations of official data. The project shows how satellite and weather inputs reveal local yield changes during the season.
Digital Tools Improve Soil Health And Yields In Mexico
EOSDA and ITTA supported a Guanajuato farm with contour-line planning, monitoring tools, and practical guidance to reduce soil erosion and improve yields in the long run.