Mask, Layer, And Indices: New In EOSDA Crop Monitoring
The third quarter of 2024 brought a range of exciting new features to EOSDA Crop Monitoring, all aimed at enhancing precision, usability, and decision-making for our users. These updates include the addition of the new Cloud shadows mask, the integration of PlanetScope data into analytics, and a new Latest Image Layer for better field mapping. We’ve also introduced three new indices, enhanced recommendations for field activities, and added growth stages for mustard in the Vegetation Meta Index.
These improvements are designed to provide deeper insights, more precise data, and increased flexibility for managing your fields. Whether you’re tracking crop health or planning your next tillage, these updates ensure that you have the best tools at your fingertips.
Cloud And Shadow Mask Management On The Field Analytics Page
We’ve introduced improvements in mask management, addressing a common challenge faced by users when analyzing satellite imagery: cloud interference. The previous cloud mask is now divided into two distinct layers — Clouds and Cirrus clouds — providing more granularity in managing cloud cover. Additionally, a Cloud Shadows mask has been added, which plays a crucial role in maintaining the accuracy of indices influenced by cloud shadows.
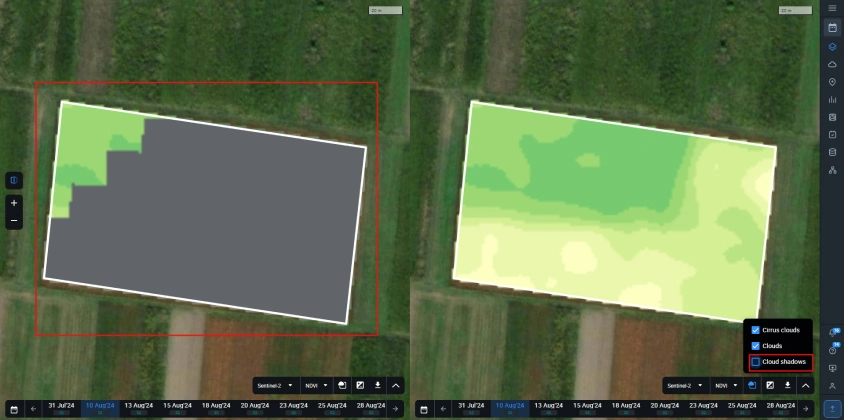
By allowing users to toggle these masks separately, it becomes easier to isolate areas where clouds or shadows may have distorted index values. This granular control is available in both the Main and Split view modes, offering enhanced flexibility when analyzing field data.
Integration Of PlanetScope Data Into Indices Trends And Weather Analytics
One of the most exciting updates is the integration of PlanetScope data into the Field Analytics and Weather | Analytics pages. This integration allows users to compare indices trends based on both Planet and Sentinel-2 data. Users can now overlay these trends with weather data, offering deeper insights into how different weather parameters impact vegetation indices.
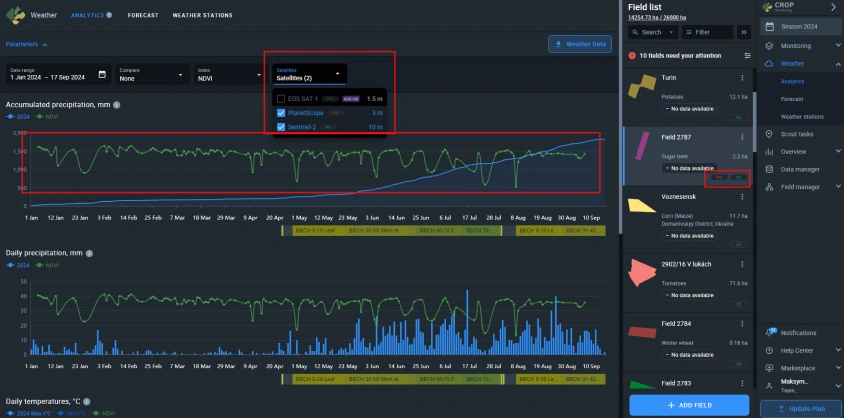
The ability to compare data from different satellite sources and weather parameters creates a more comprehensive analytical environment that empowers users to make more informed decisions about crop management. This enhancement significantly improves the platform’s usability and offers greater precision in tracking vegetation health.
Draw Fields Accurately With The New Latest Image Layer
We’ve introduced the Latest Image Layer on the Draw Fields page to help users draw field boundaries more accurately. Previously, users often faced difficulties due to cloud cover or outdated imagery that didn’t reflect recent changes, such as new land use or construction activities.
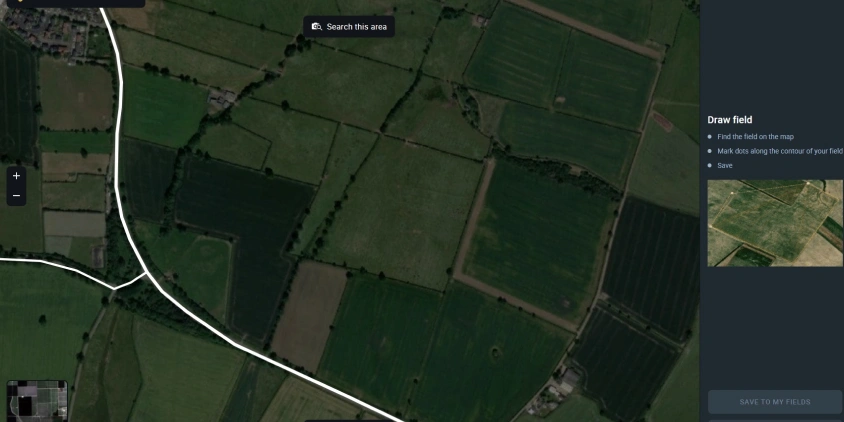
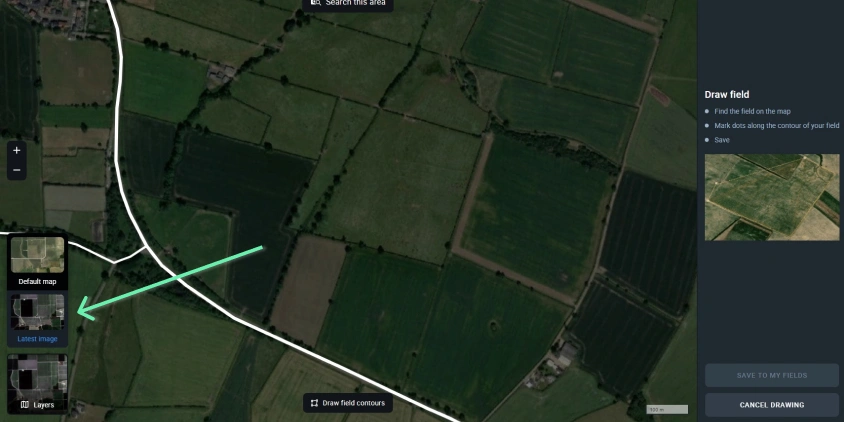
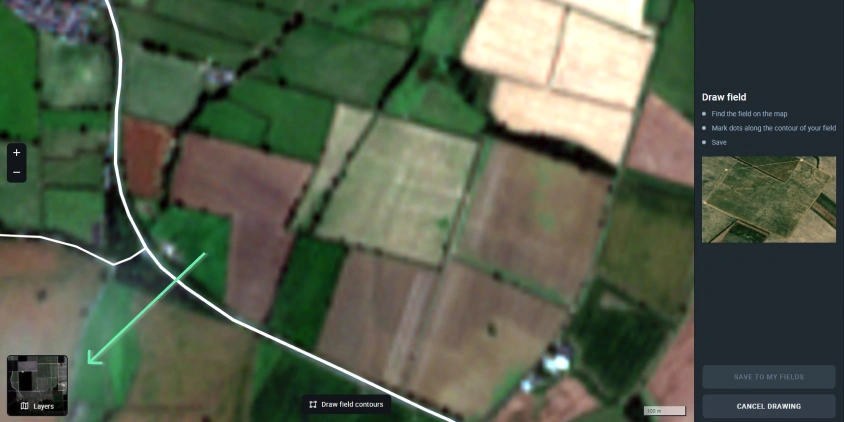
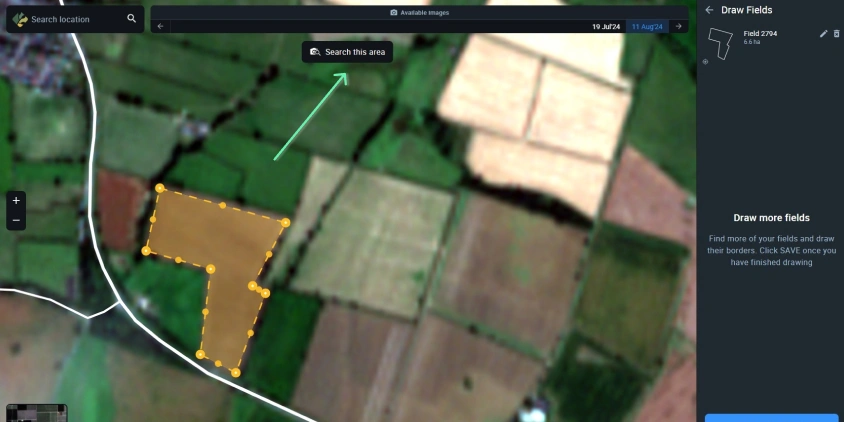
This new feature provides the most up-to-date Sentinel-2 images — with less than 5% cloud cover — allowing users to clearly see and define even small fields, down to 3–5 hectares. In many cases, these images are just days old, ensuring that field boundaries can be drawn with greater precision. Additionally, users can select other recent images in their area for multiple perspectives on field mapping.
Introducing Three New Indices: NDYI, NRFI, And NDPI
In the third quarter of 2024, we’ve added three powerful indices to our crop monitoring system, designed to provide even more precise insights into crop health and stress detection.
- NDYI (Normalized Difference Yellow Index): This index is particularly useful for detecting yellowing in vegetation, especially during the flowering stages of crops like rapeseed, sunflowers, mustard, and some varieties of sorghum and beans. It also helps spot stress-induced yellowing in crops like wheat and corn. However, the NDYI uses the blue band, making it sensitive to atmospheric conditions and prone to false readings in areas with bare sandy soil.
- NRFI (Normalized Rapeseed Flowering Index): Similar to NDYI, NRFI is designed to track the flowering periods of rapeseed, mustard, and other yellowing crops. It uses the SWIR band, which is sensitive to moisture, making it susceptible to inaccurate readings during snowmelt periods or in watered areas.
- NDPI (Normalized Difference Phenology Index): NDPI is tailored for early-stage vegetation growth, reducing the impact of snowmelt on traditional vegetation indices. This makes it especially useful for monitoring the spring growth of winter crops. The index enhances early detection of vegetation health and provides accurate insights during the critical green-up phase.
These new indices allow our users to study specific crop stages, whether it’s tracking flowering periods or monitoring early vegetation growth, helping to pinpoint stress factors with more precision.
These indices are available on request as an add-on for EOSDA Crop Monitoring users.
New Recommendations For Optimal Tillage And Spraying Times
Farm management should get easier now with the addition of activity time recommendations for tasks like tillage and spraying. These recommendations are now integrated into the weather forecast section of EOSDA Crop Monitoring, helping users choose the best times for field activities.
The recommendations are based on multiple parameters such as:
- Air temperature
- Air humidity
- Wind speed
- Rainfall forecast and recent totals
- Soil moisture and soil temperature
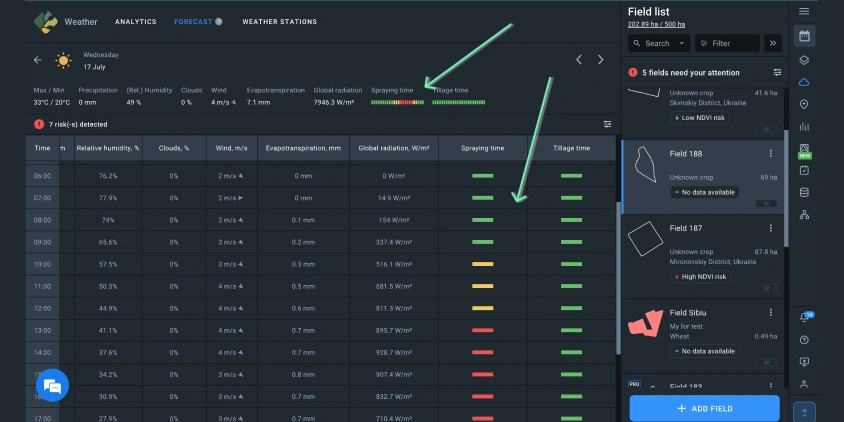
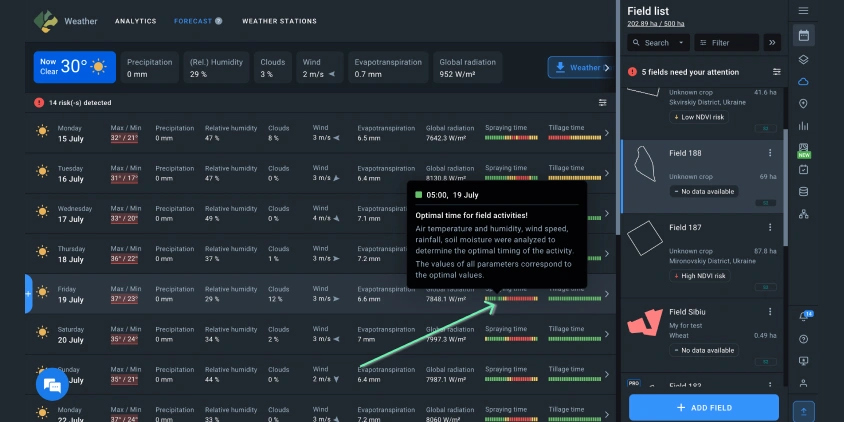
Each hour is color-coded:
- Green indicates the optimal time for the activity.
- Orange signals an acceptable time.
- Red warns against performing the activity.
These visual indicators make it easier for users to plan their day’s activities while avoiding conditions that may lead to inefficiencies or damage to crops.
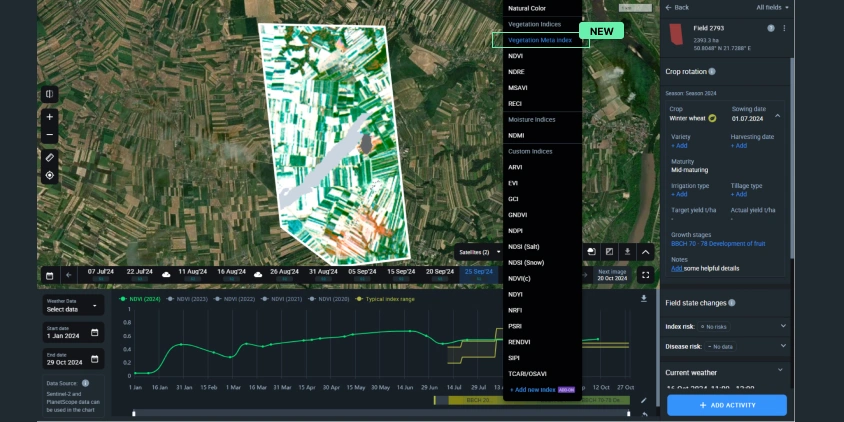
New Vegetation Meta Index In EOSDA Crop Monitoring
We are excited to announce the release of a new index in EOSDA Crop Monitoring: the Vegetation Meta Index. This composite index is based on the RGB model, where each color channel corresponds to a different vegetation index:
- Red corresponds to MSAVI (Modified Soil Adjusted Vegetation Index)
- Green corresponds to NDRE (Normalized Difference Red Edge Index)
- Blue corresponds to NDVI (Normalized Difference Vegetation Index)
Each of these indices is particularly effective at different stages of plant development. By combining them into an RGB composite, users can visually determine the state of the crop based on color variations. The advantage of this approach is that the color scheme remains consistent across different crop types, regions, and capture times, as it relies on the absolute values of the indices.
When users click on a pixel, a tooltip displays the individual values for MSAVI, NDRE, and NDVI, giving a deeper insight into crop health.
The Vegetation Meta Index offers a visually intuitive way to assess crop conditions by blending the strengths of multiple indices. We assume this feature can be a game-changer for understanding plant health across different stages of growth.
Currently, the Vegetation Meta Index is based on Sentinel-2 imagery and is available in the EOSDA Crop Monitoring tool. Future developments will include integration with PlanetScope imagery and incorporation of more areas and crop types.
We encourage you to explore these new features and share your feedback with us. Your insights help us improve the platform and continue developing solutions that support your success in the field. Please reach out through our contact form with any suggestions or questions.
About the author:
Maksym Sushchuk is at the forefront of realizing EOSDA's vision to make space tech a global driver of sustainability on Earth. He has over 15 years of experience in journalism and content creation for prominent Ukrainian startups, charitable funds and ESG businesses. As Head and Co-founder of PR Army Maxim brings attention to the human and social tolls of the aggression against Ukraine.
Recent articles
EOSDA Forecasts Yields For 2025 In Saskatchewan
EOSDA created RM-level crop yield forecasts for Saskatchewan to address limitations of official data. The project shows how satellite and weather inputs reveal local yield changes during the season.
Digital Tools Improve Soil Health And Yields In Mexico
EOSDA and ITTA supported a Guanajuato farm with contour-line planning, monitoring tools, and practical guidance to reduce soil erosion and improve yields in the long run.

Analyze 2025 & Plan Your Best Year Yet: LandViewer Christmas Offer
It’s the most wonderful time of the year! The Christmas holidays are here, and so is your chance to analyze 2025 and plan a prosperous 2026 with more affordable Pro plans in LandViewer.