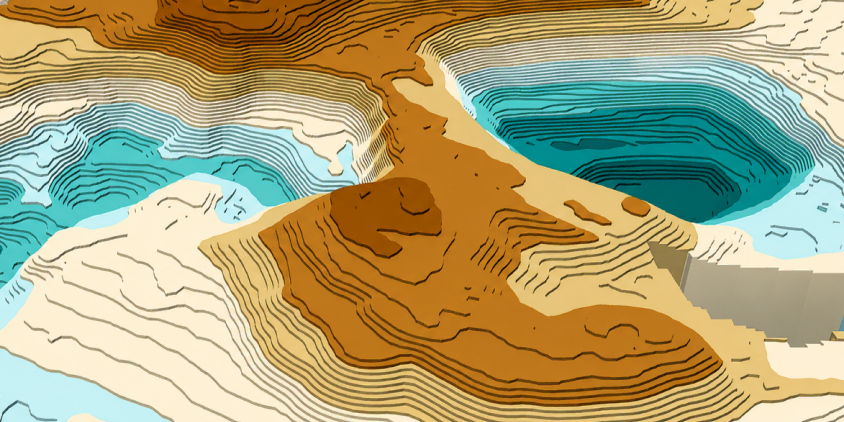
Satellite imagery answers many questions, but not this one: how high is the ground? Without elevation data, it’s difficult to model runoff, calculate slopes, estimate earthworks, or assess terrain-related risks, critical for many projects. A digital elevation model provides that missing elevation information by assigning a height value to every point across the landscape.
Our article explains what a digital elevation model is and how it is produced from stereo satellite imagery. You’ll also find out how to access and use high-resolution DEM data for your engineering, environmental, agricultural, and mining projects.
Key takeaways
- A digital elevation model (DEM) assigns a height value to every point on the ground, providing data essential for calculating slopes, runoff, and terrain-related risks.
- DEM often serves as an umbrella term, but it typically means either a digital surface model (DSM), which includes buildings and trees, or a digital terrain model (DTM), which strips them away to show bare ground.
- Building a digital elevation model from stereo satellite imagery offers broad coverage at lower cost than LiDAR or drone alternatives.
- Different industries rely on DEMs to plan around terrain and avoid costly design errors.
- LandViewer can build custom digital elevation models from high-resolution stereo imagery of up to 30 cm in detail.
What is a digital elevation model (DEM)?
A digital elevation model, or DEM, is a grid of numbers that shows the height of the ground at every point on a map. Picture a photo made of tiny squares, but instead of color, each square holds one value: how high that spot sits above sea level. Trees, houses, and other objects usually get stripped out, leaving just the bare ground.
How much detail a digital elevation model captures depends on the distance between sample points. A fine-grid DEM with dense sampling points reveals minor surface irregularities, like small bumps and ditches. Meanwhile, a coarse-grid DEM smooths those details away.
Digital elevation models help answer critical real-world questions: predicting flood lines, mapping fire risk, routing power lines, choosing solar farm sites, spotting landslide-prone slopes, and many more.
DEM vs. DSM vs. DTM
In GIS, a digital elevation model (DEM) is often used as an umbrella term for any gridded elevation dataset. However, when you actually work with this data, you will usually choose between two model types: a digital surface model (DSM) or a digital terrain model (DTM).
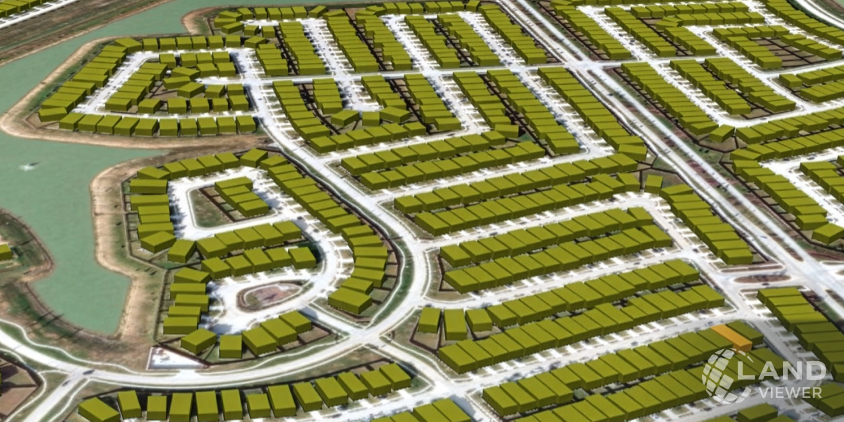
For instance, across a forested area, a DSM captures the tree canopy, while a DTM strips the trees away to expose the soil below. Because a file labeled simply as “DEM” can mean either of these options, you always need to check the dataset metadata.
Selecting a digital surface model with vegetation when you need bare-earth measurements leads to severe errors. The table below compares DEM vs. DSM vs. DTM side by side to help you pick the right dataset for your project.
| Represents | Above-ground features | Typical uses | |
|---|---|---|---|
| DEM | Elevation raster | Depends on metadata | Terrain analysis |
| DSM | Earth’s surface | Yes | Urban planning, visibility analysis |
| DTM | Bare ground and terrain features | No | Engineering and hydrology |
How DEM maps are created from stereo satellite images
To build a DEM from stereo satellite images, you need two pictures of the same area taken from different angles . Software performs dense stereo matching to find corresponding pixels across the pair, such as building edges, field boundaries, or river bends, and measures how far each one shifts between shots. That shift (disparity), combined with the satellite’s precisely known position, attitude, and viewing geometry, is used in a photogrammetric digital model to compute 3D ground coordinates, including elevation . Millions of these elevation values are interpolated onto a regular digital grid to form a raster surface, which is then filtered and edited to remove outliers, reduce noise, and fill gaps.
LiDAR, radar-based InSAR, and drone photogrammetry can also be used for producing digital elevation models, but stereo satellite imagery stands out for scale: it covers enormous areas without a single field visit, costs less than most alternatives, and draws on satellite archives stretching back decades.
Where digital elevation models are used
In any project tied to the land, terrain shape directly dictates budgets and safety. Whether you are laying a pipeline, building a wireless network, or managing farmland, knowing exact ground heights beforehand prevents bad design decisions and unexpected site costs.
The most common ways industries use DEM mapping to streamline operations include:
- Flood risk and hydrology. Water always finds the lowest path, and a digital elevation model traces that path before the rain even falls. Analysts use it to simulate flow, outline watersheds, and pin down flood risk to specific stretches of land.
- Construction and infrastructure. Roads, pipelines, and building sites all depend on slope and drainage. DEMs let engineers spot steep sections, plan around them, and calculate how much earth needs to move before the first excavator arrives.
- Telecommunications. Radio signals travel in straight lines and stop at the first hill in the way. Digital elevation models are highly effective for checking line-of-sight between towers and spotting hills or ridges that would otherwise block a signal for miles.
- Environmental monitoring. DEMs assist in erosion studies, habitat mapping, forestry management, and landslide assessment by comparing the same slope across two dates and measuring exactly how much ground has moved.
- Agriculture. Water runs downhill, carrying soil and nutrients with it. Digital elevation data, layered with satellite images of crop health, helps growers decide where irrigation is wasted and where erosion is draining a field’s topsoil.
- Mining. Mining companies use digital elevation models to monitor pit expansion, calculate stockpile volumes, evaluate slope stability, and support operational planning, calculating stockpile volumes and monitoring tailings dam stability from space.
Estimating slope steepness or drainage paths by eye is a guaranteed way to miscalculate flood lines or signal coverage. A DEM fixes that with hard elevation numbers for every single plot of land.
Getting custom high-resolution DEM data via LandViewer
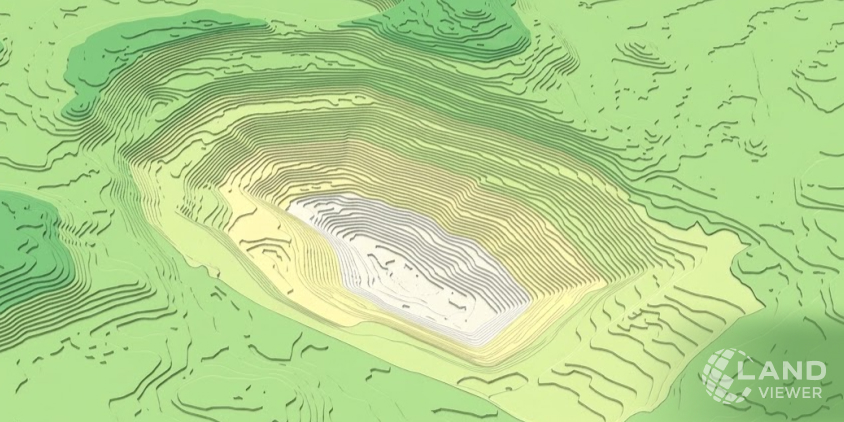
When flat 2D satellite images fall short, like when you need to calculate slope steepness, measure pit depth, or model water runoff, you need vertical elevation data. LandViewer allows you to request custom DEM processing tailored to your exact location and project specs.
Depending on terrain complexity, digital models are built using stereo and tri-stereo imagery from high-resolution satellite operators like 21AT, SpaceWill, and SIIS. With the ground captured from multiple angles at resolutions down to 30 cm, the resulting digital elevation models eliminate data gaps along sharp cliffs, ridges, and dense building clusters.
To keep your project timeline realistic, consider the two available delivery workflows:
- Archival processing. Delivers digital elevation models from pre-captured satellite imagery within a few business days.
- New satellite tasking. Requires capturing fresh imagery over your site, which takes longer depending on cloud cover, revisit schedules, and area size.
For a complete analysis, LandViewer specialists can also pair your DEM data with optical imagery or radar (SAR) imagery. Combining digital height matrices with visual or radar layers gives full context to physical terrain, so that you can evaluate surface features and physical structures together.
If you are unsure whether your DEM project needs archival data or fresh high-resolution tasking, consult with our support team to choose the right option without overspending.
Does LandViewer provide DEM data?
Can DEM data be used with satellite imagery?
What is the difference between LiDAR data and digital elevation models (DEMs)?
About the author:
Kateryna Sergieieva has a Ph.D. in information technologies and 15 years of experience in remote sensing. She is a Senior Scientist at EOSDA responsible for developing technologies for satellite monitoring and surface feature change detection. Kateryna is an author of over 60 scientific publications.
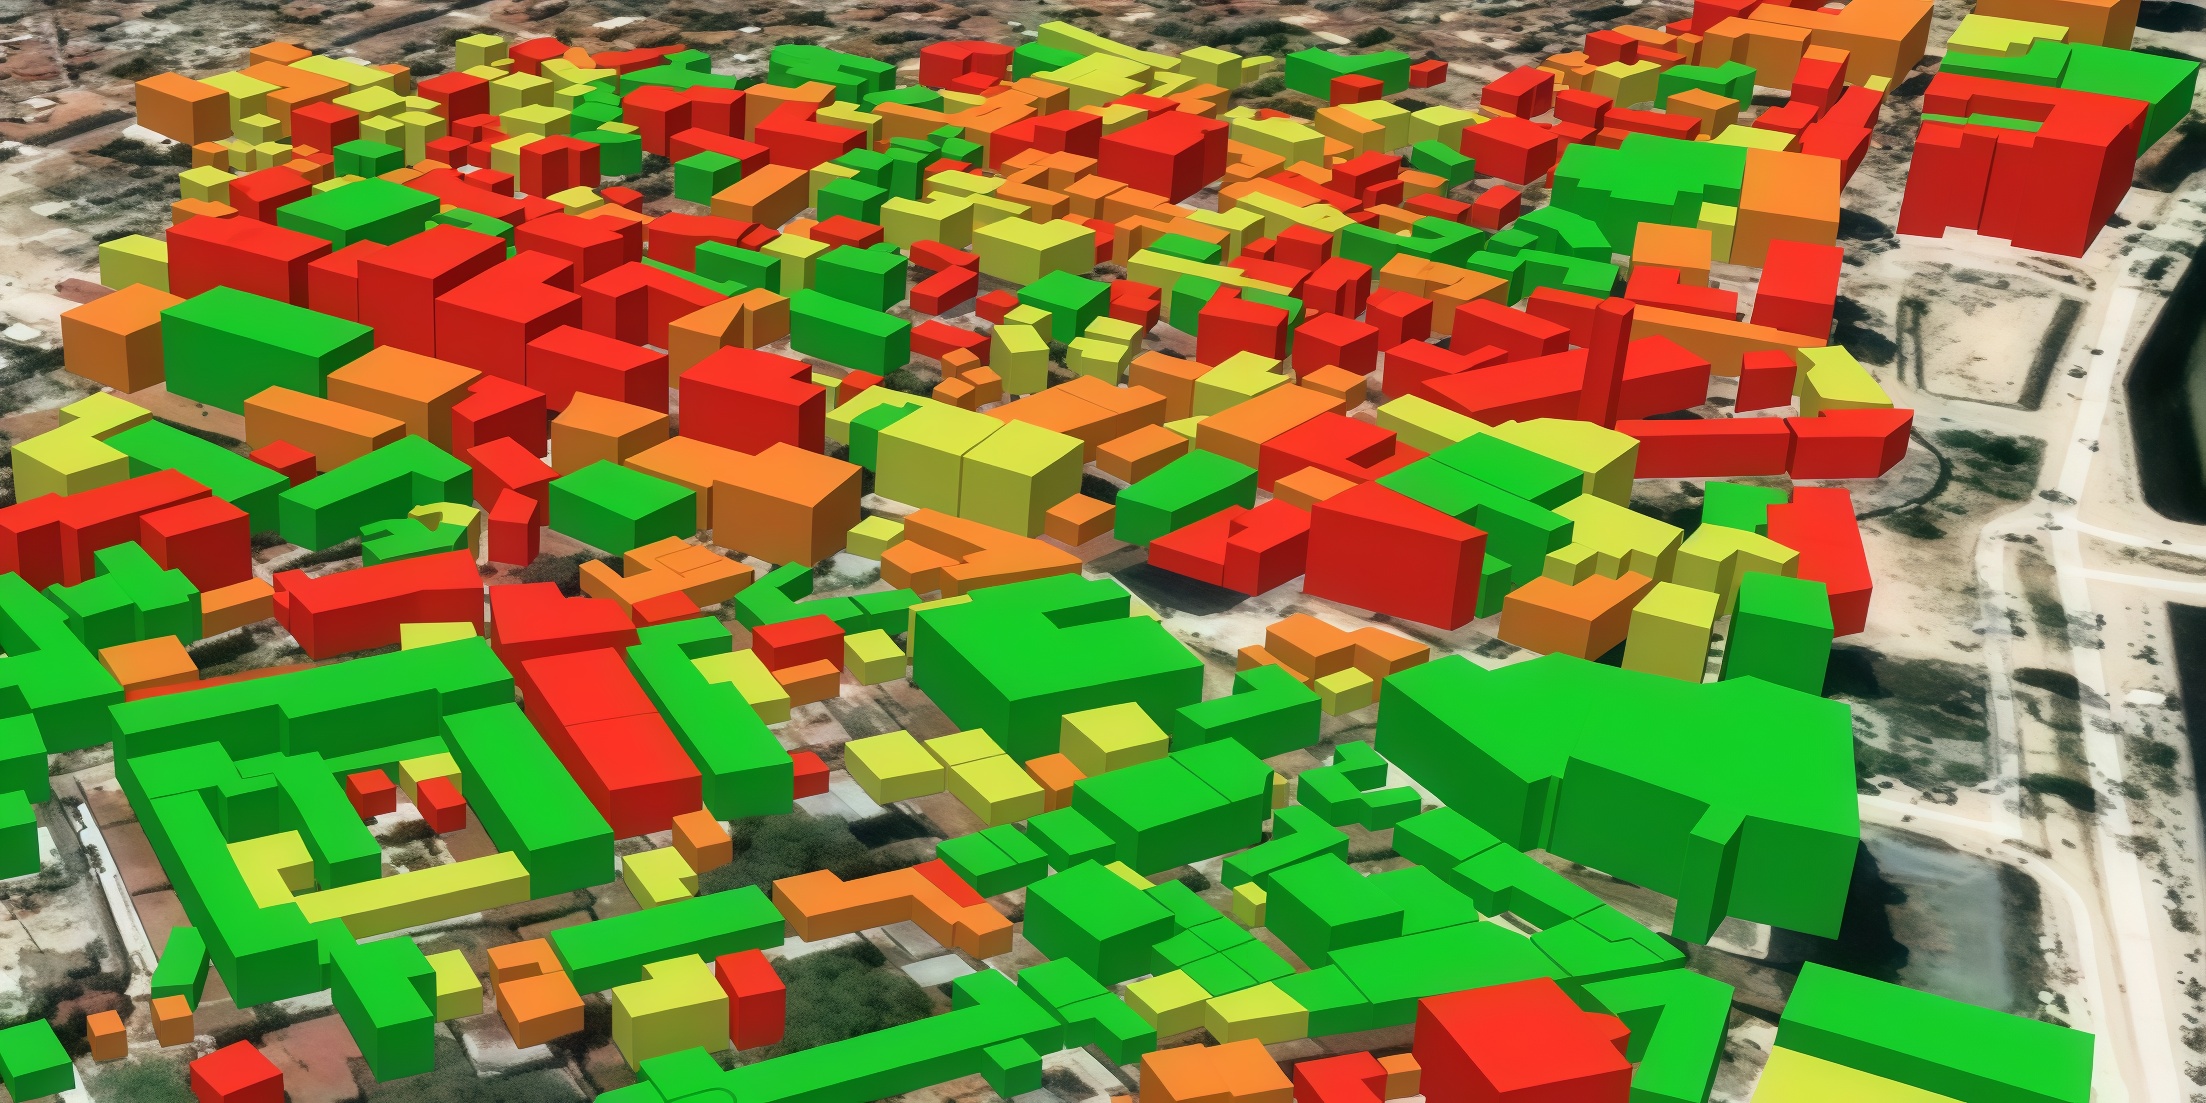
Unlock accurate terrain insights with custom DEMs for any location worldwide.
More news
Satellite imagery tasking: How to order via the LandViewer platform
What if you could just order the satellite imagery you actually need? On-demand satellite tasking makes that possible — here's how it works and how to place your first order.
SAR imagery: How synthetic aperture radar technology works
Want to monitor assets without weather delays? Learn how SAR imagery captures soil moisture, floods, and structural shifts through clouds and smoke for your monitoring projects.
Optical satellite imagery: Getting insights from space
Ground inspections can be slow and expensive. Discover how commercial optical satellite imagery simplifies remote site monitoring and supports daily operational decisions.