Weather
Simply click Forecast to be redirected to the Weather page in case Weather today data is not enough for you or comparison with other vegetation periods is required.
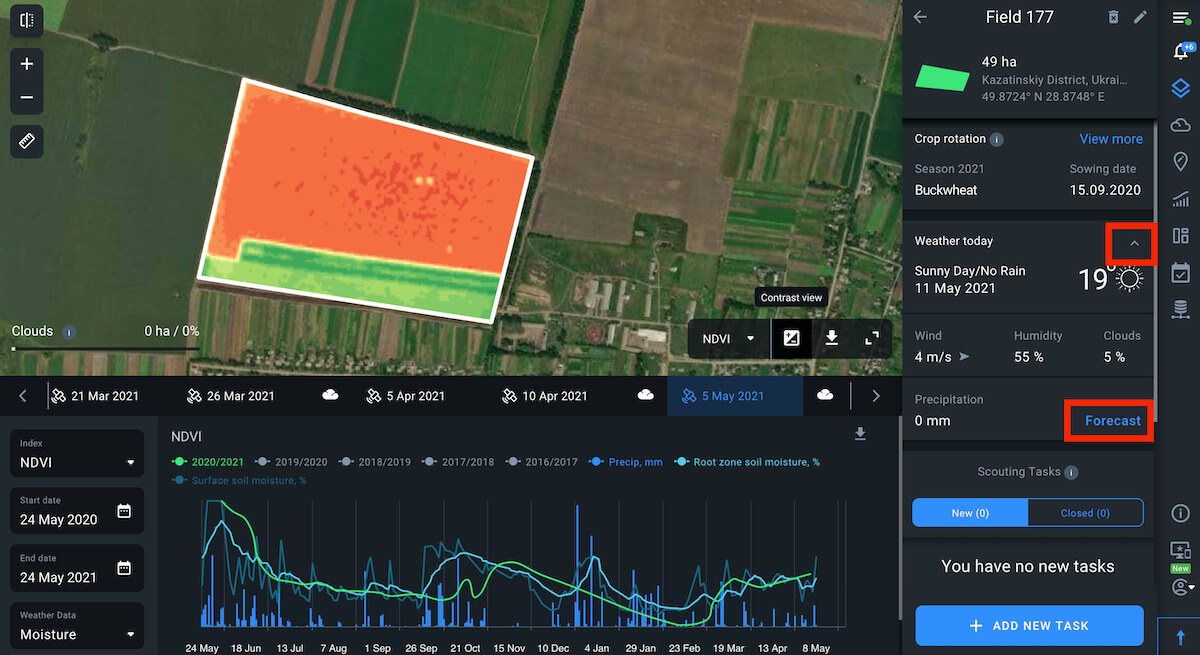
You can get all this information using the Weather analytics tab on the right sidebar as well.

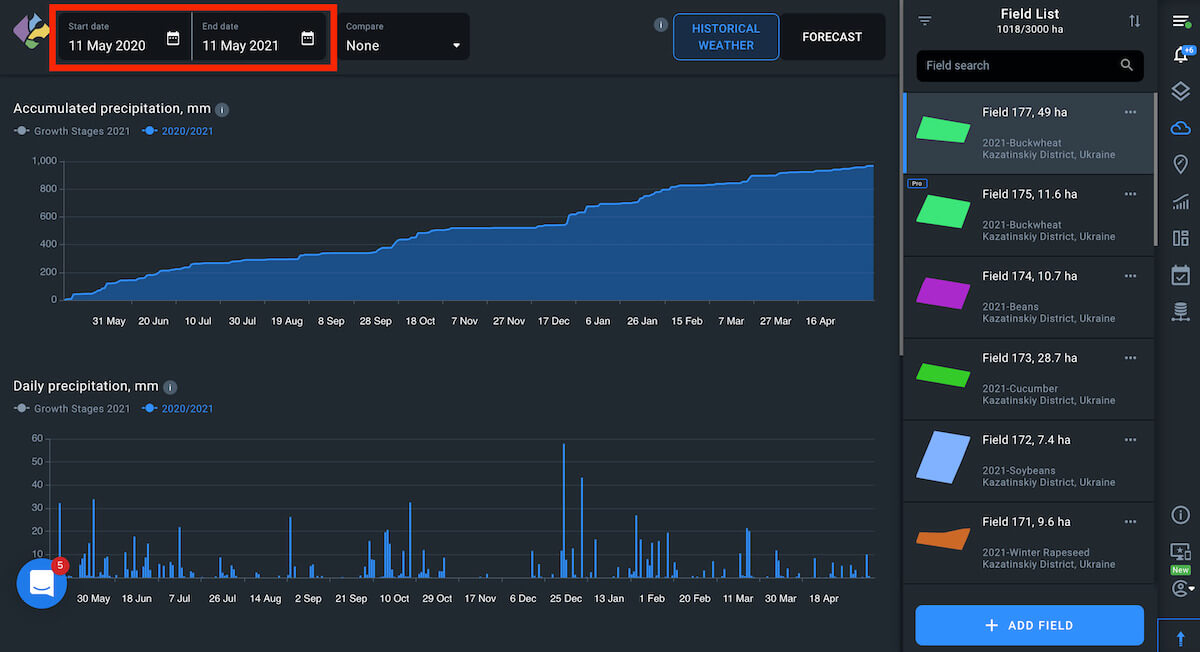
Historical Weather
Historical Weather is archived temperature and precipitation data. To set the vegetation period, choose the season you are interested in (available from 2008) and its start and end dates using the calendar. By default, the Growth Stages curve shows on all the graphs. In case there were no stages during the selected time frame, the pointer will be disabled. You can disable it manually at any time if it is not informative for you.
To add a curve displaying the data for the past five years, activate the Compare with 5 years average option.
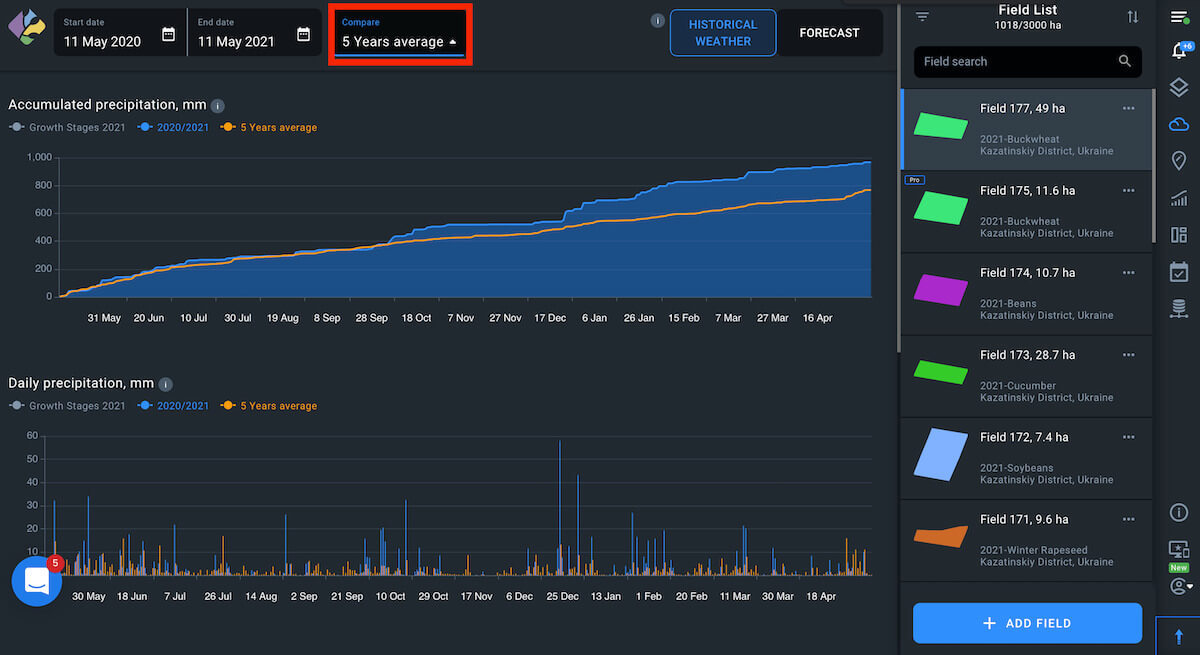
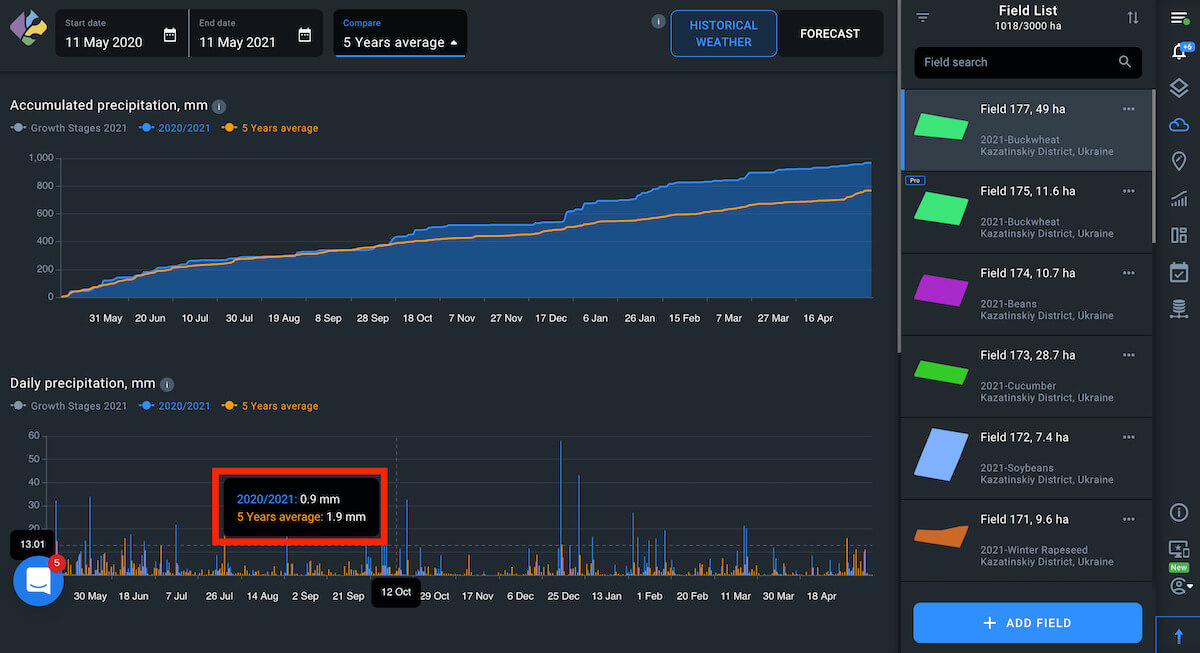
Accumulated And Daily Precipitation Graphs
Once 5 years average is enabled, you will be shown the average for the current period and the last 5 years precipitation levels on graphs to visualize collected information for further analysis.
Accumulated Precipitation graph
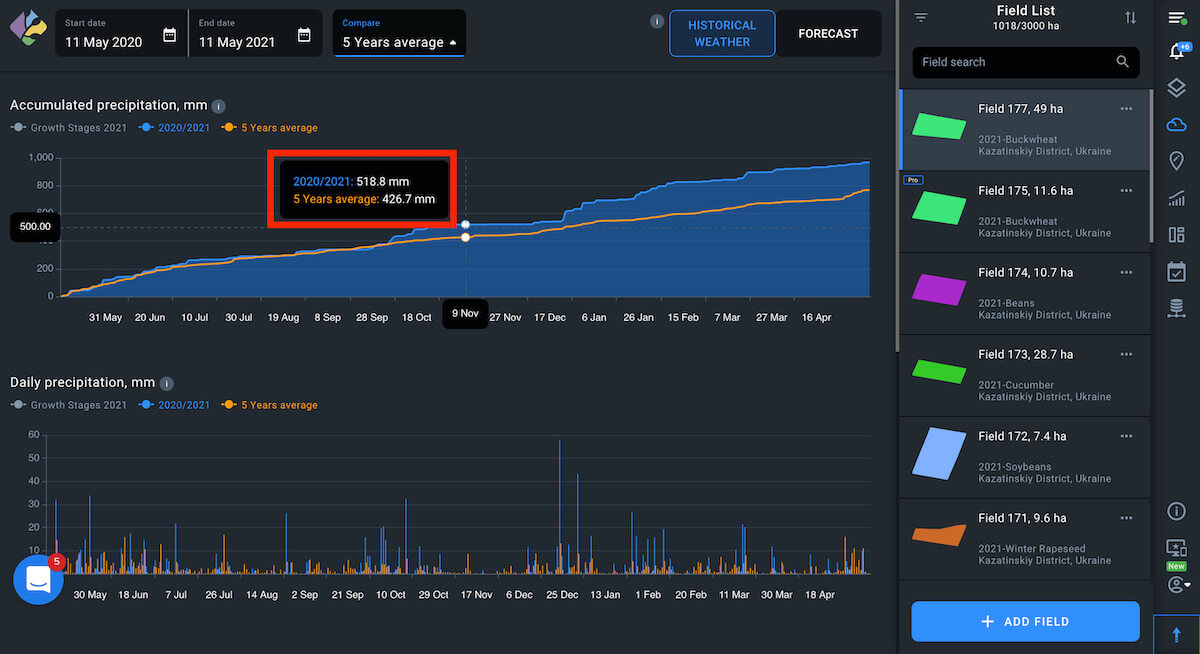
Daily Precipitation graph
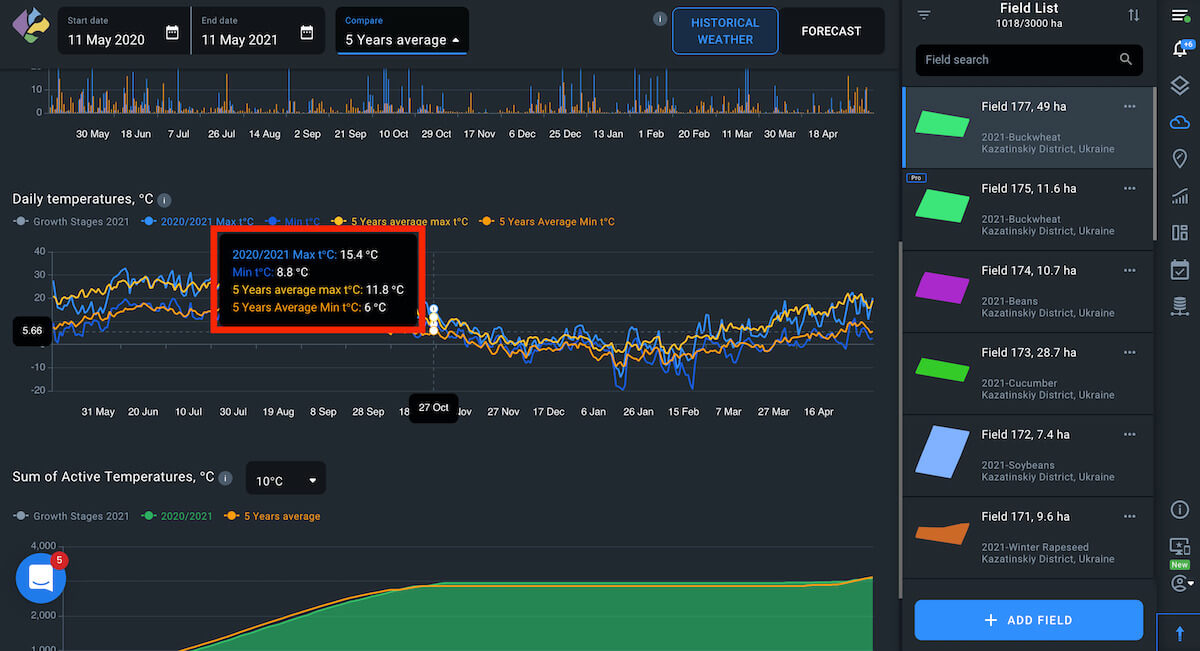
Daily Temperatures
The graph shows min°C and max°C as well as 5 Year Average min°C and max°C if the 5 Years Average option is selected.
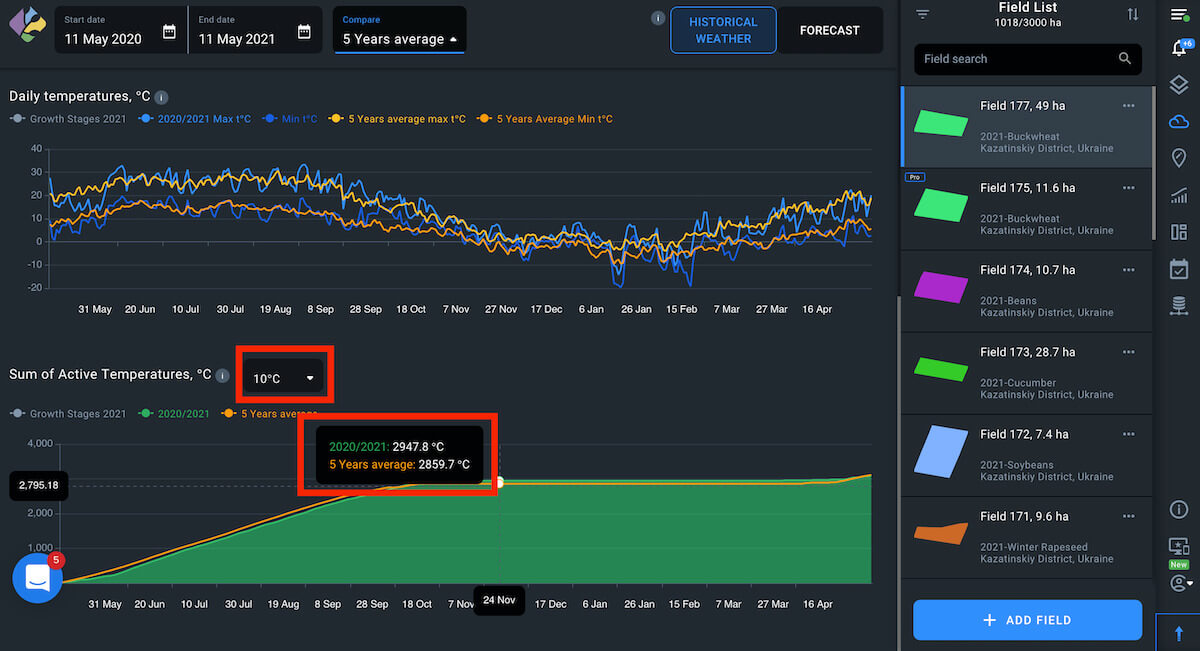
Sum Of Active Temperatures
The drop-down menu has three options that can be chosen: 0°C (1°C to 5°C), 5°C (6°C to 10°C) and 10°C (11°C to more). So if you pick the date range from 6°C to 10°C that is a 5°C filter option on the list, you will see the sum of these temperatures.
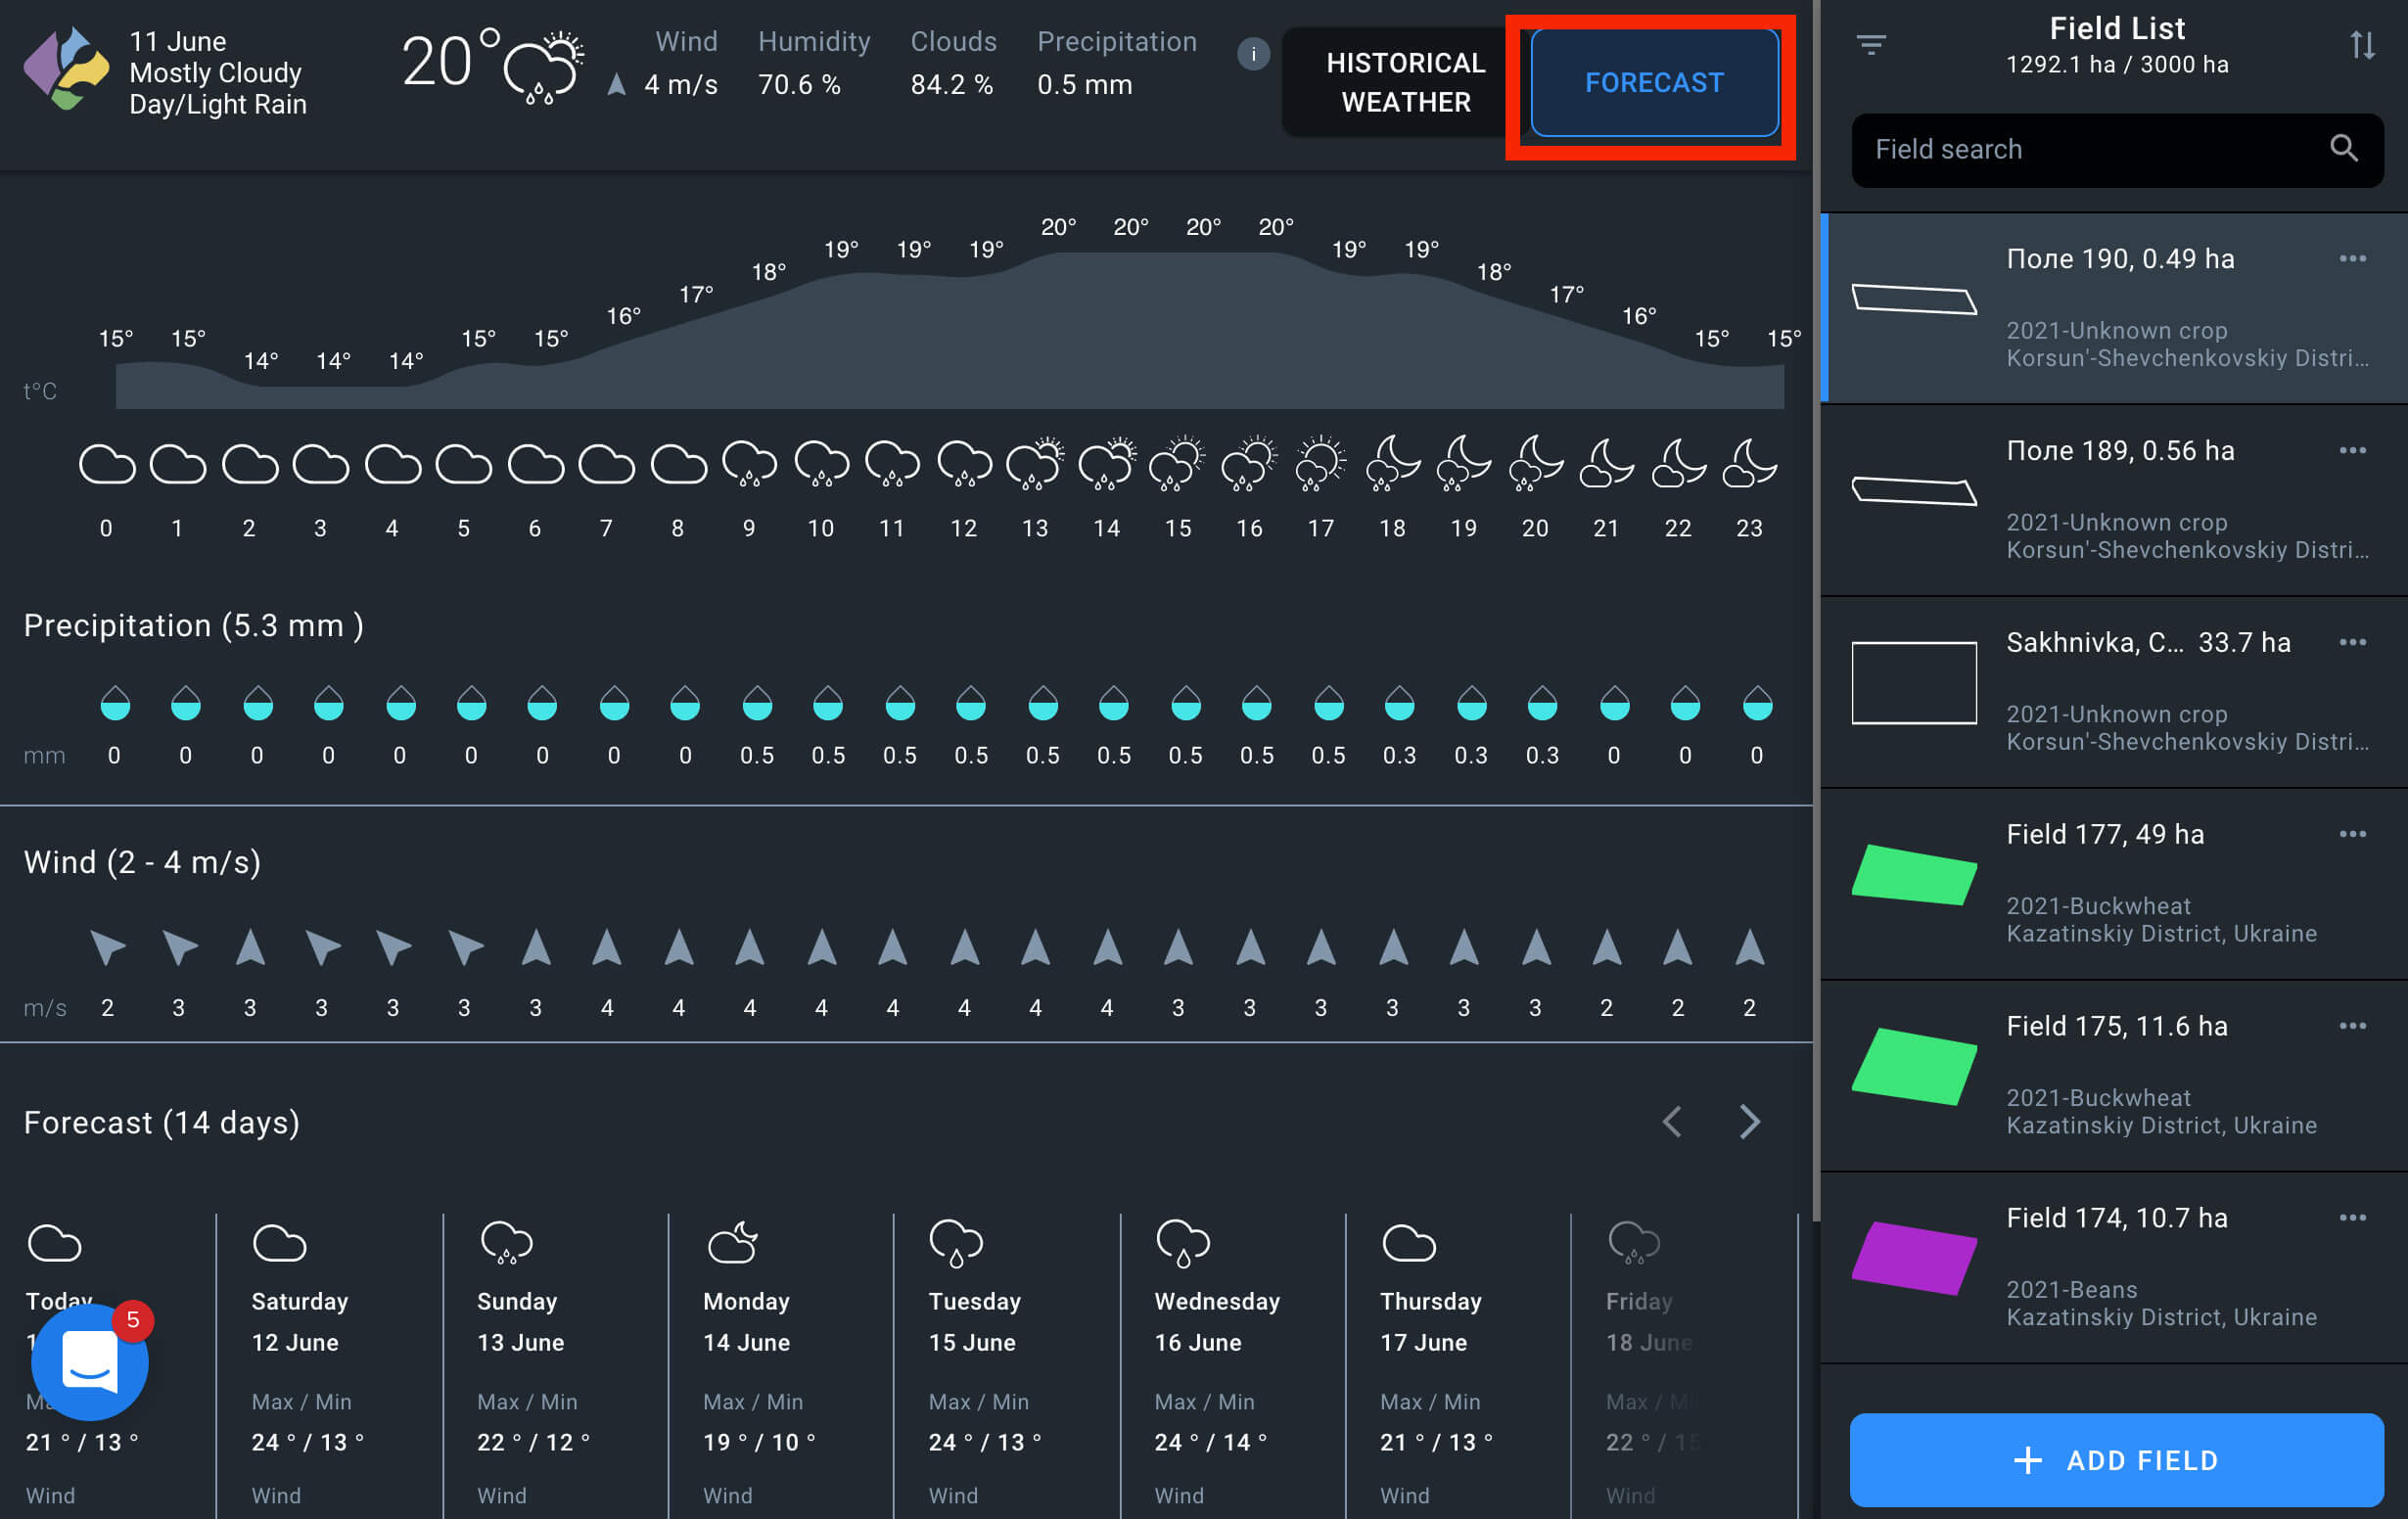
Weather Forecast
The Weather Forecast option provides you with access to the 14 days weather forecast. Wind speed, humidity, cloud coverage and expected precipitation are also shown on the screen.
Recommended time for field activities
On the weather forecast page you can also find the recommended times for field activities such as soil tillage and spraying.
To determine the optimal time for each activity, we have analyzed the following indicators for you:
– Air temperature
– Air humidity
– Wind speed
– Rainfall forecast
– Rainfall totals for the last 24, 48 and 72 hours
– Soil moisture
– Soil temperature
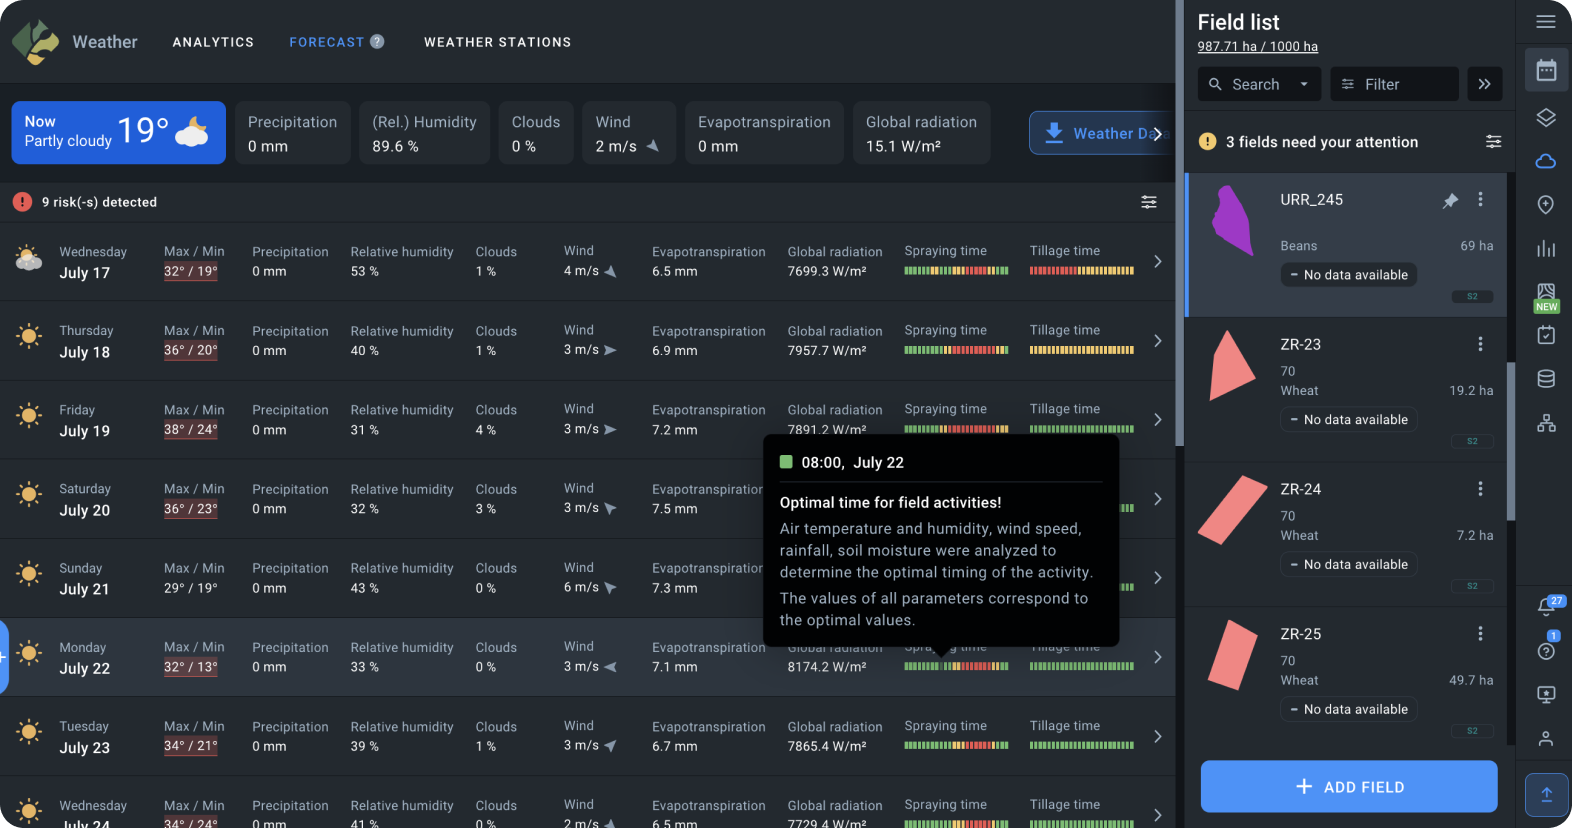
Each hour has a marker. The color of the marker corresponds to the recommendations:
Green – Optimal time for the activity
Orange – Acceptable time for the activity
Red – Not recommended time for the activity