Overview
Season Analytics
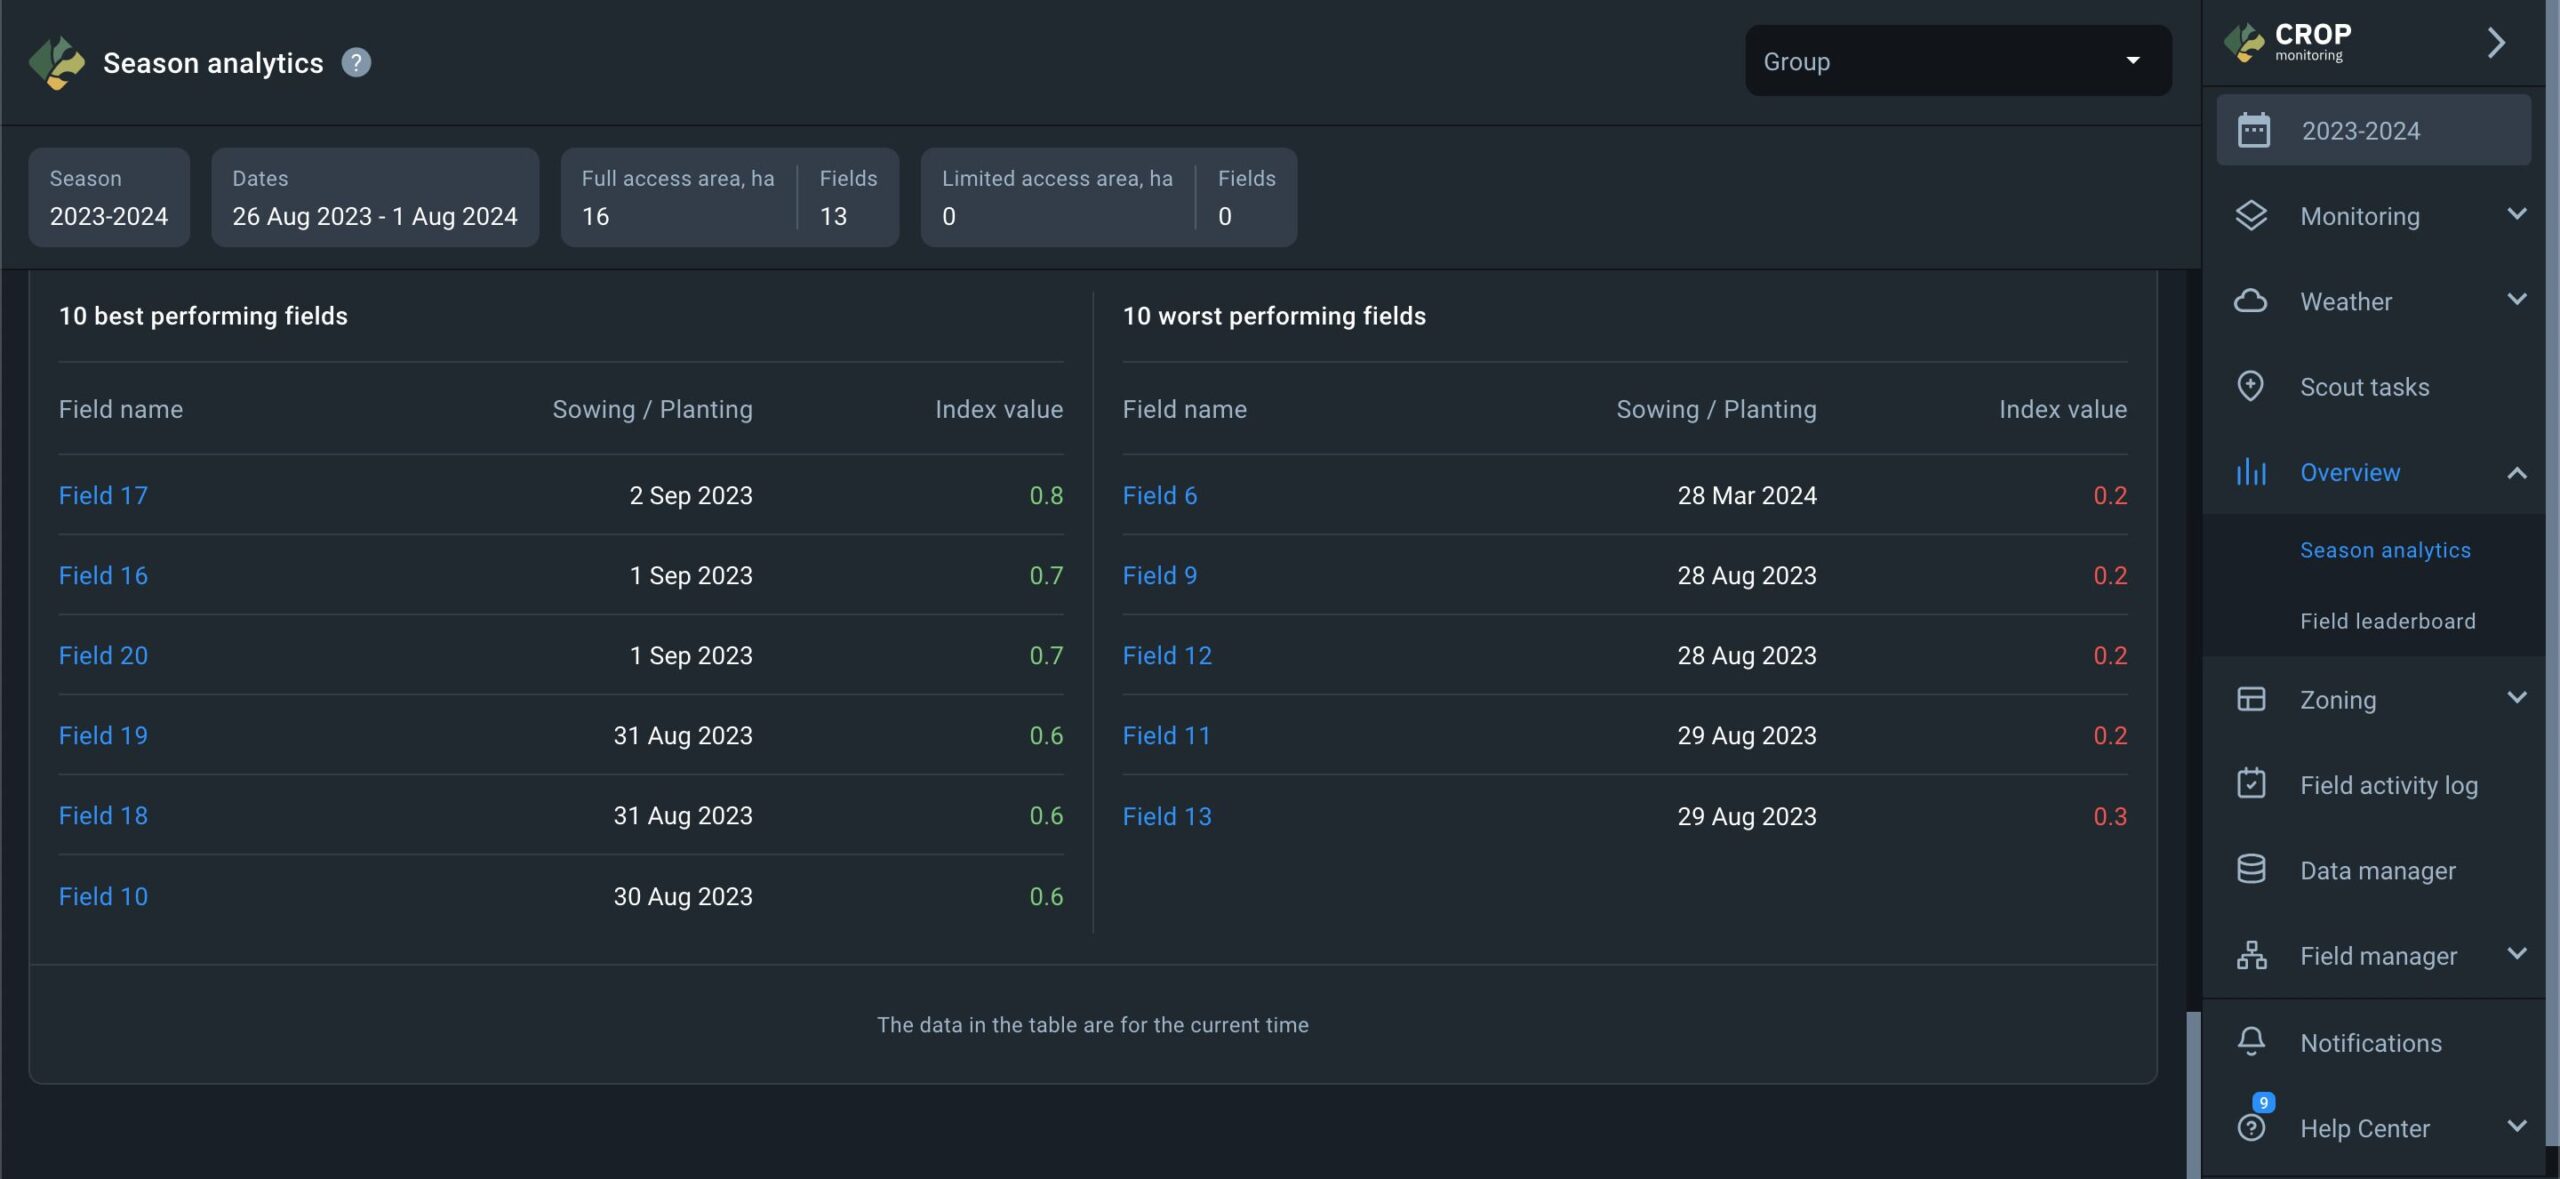
On the Season Analytics screen, you will find general information about your season. All the figures displayed on the screen are calculated based on the data from the full-access fields only.
At the top of the screen, you’ll see information about the season:
- Name
- Duration (dates)
- Number of full access fields and their total area in ha
- Number of limited access fields and their total area in ha
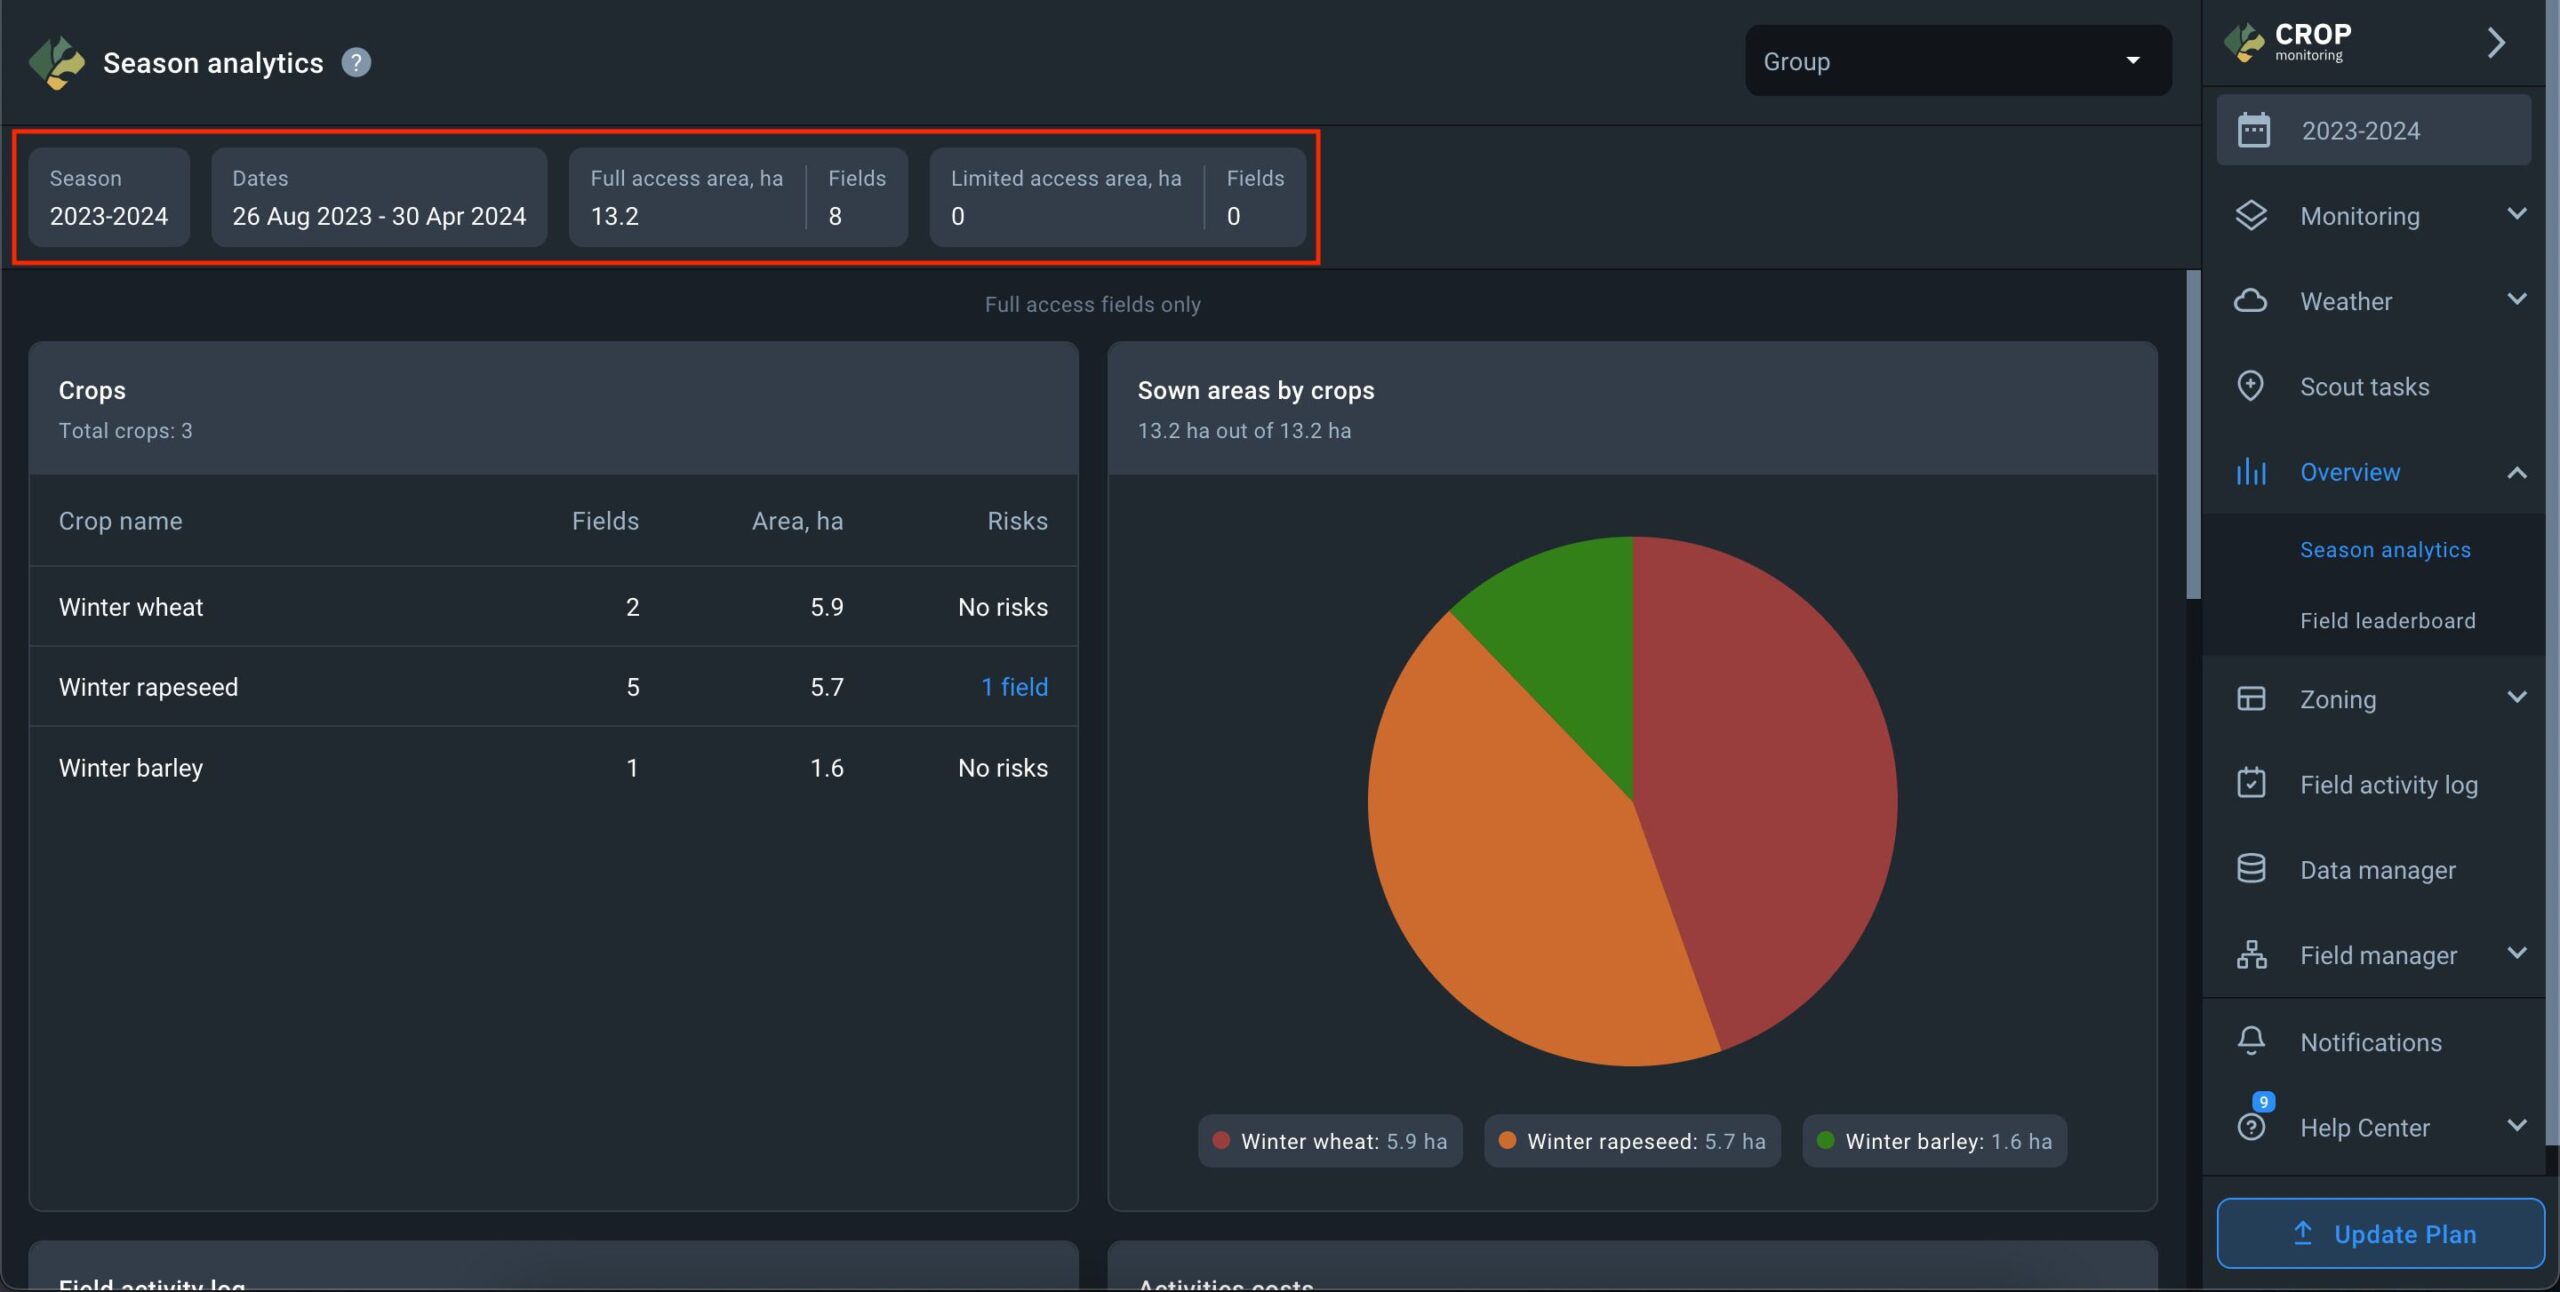
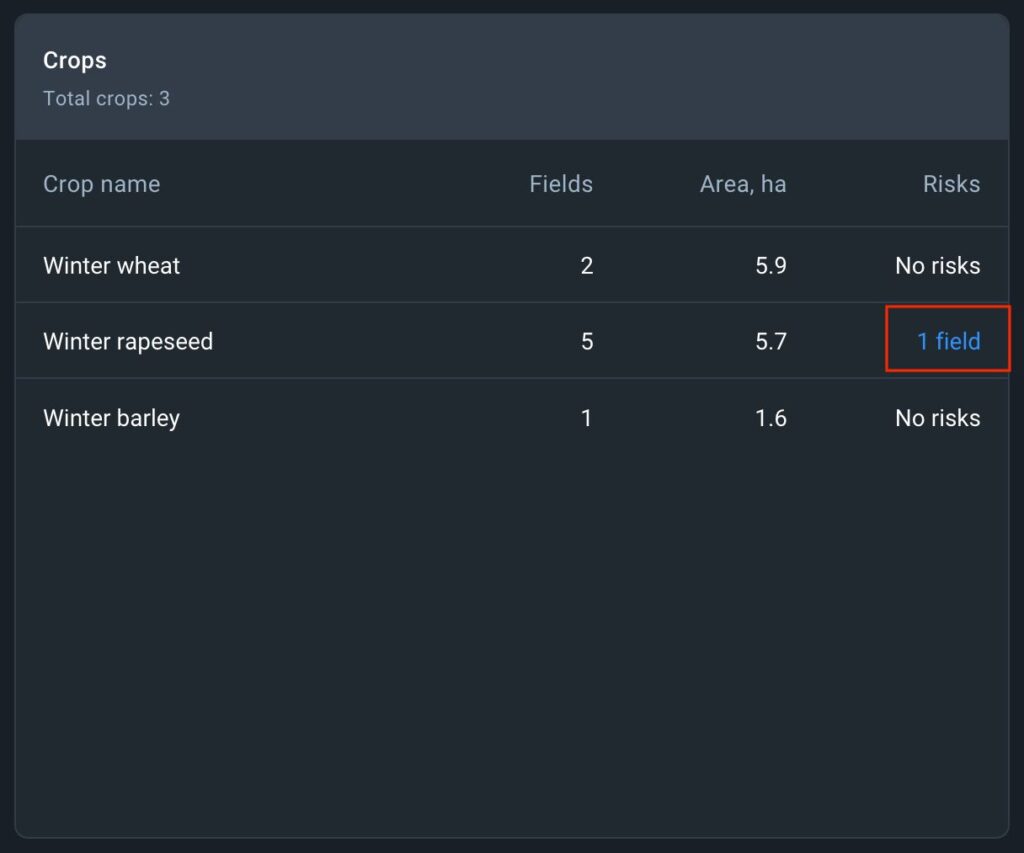
On the main screen, the Crops widget showcases a list of crops sown in the fields for the season. Alongside each crop, you’ll find the number of fields dedicated to it and the total area covered by those fields.
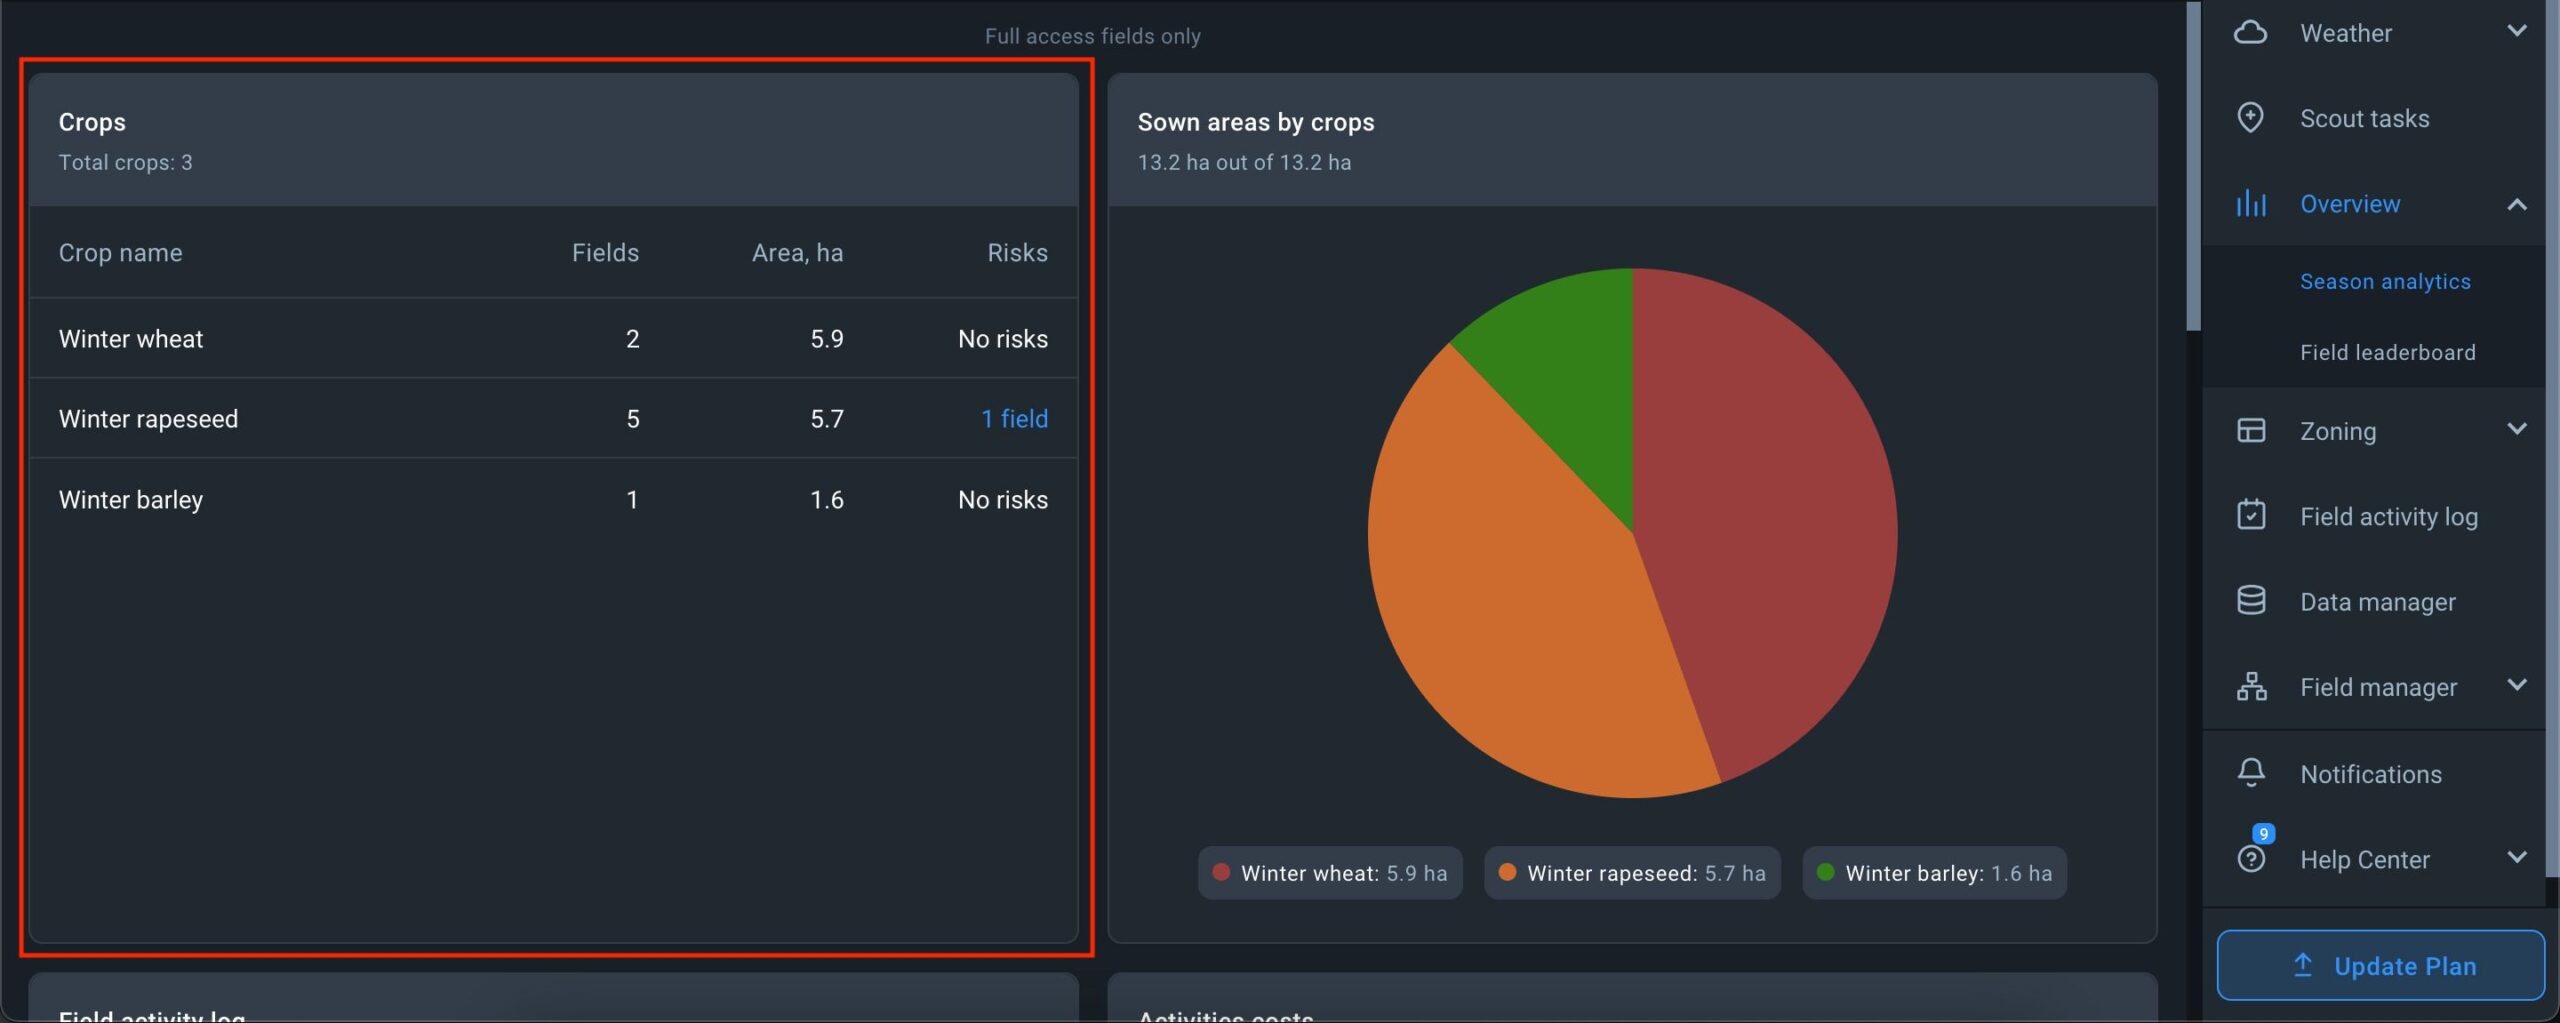
Additionally, if the season is active, the risk indicator for each crop is displayed. If the system detects risks, the number of fields affected by risks is shown next to the crop under the “Risks” parameter. Clicking on the risk indicator adjacent to a crop reveals a list of fields where risks have been detected, allowing you to scrutinize the situation in greater detail.
The Sown areas by crop widget provides a visual breakdown of the area dedicated to each crop individually for the season. You can also view the percentage of the total area allocated to each crop.

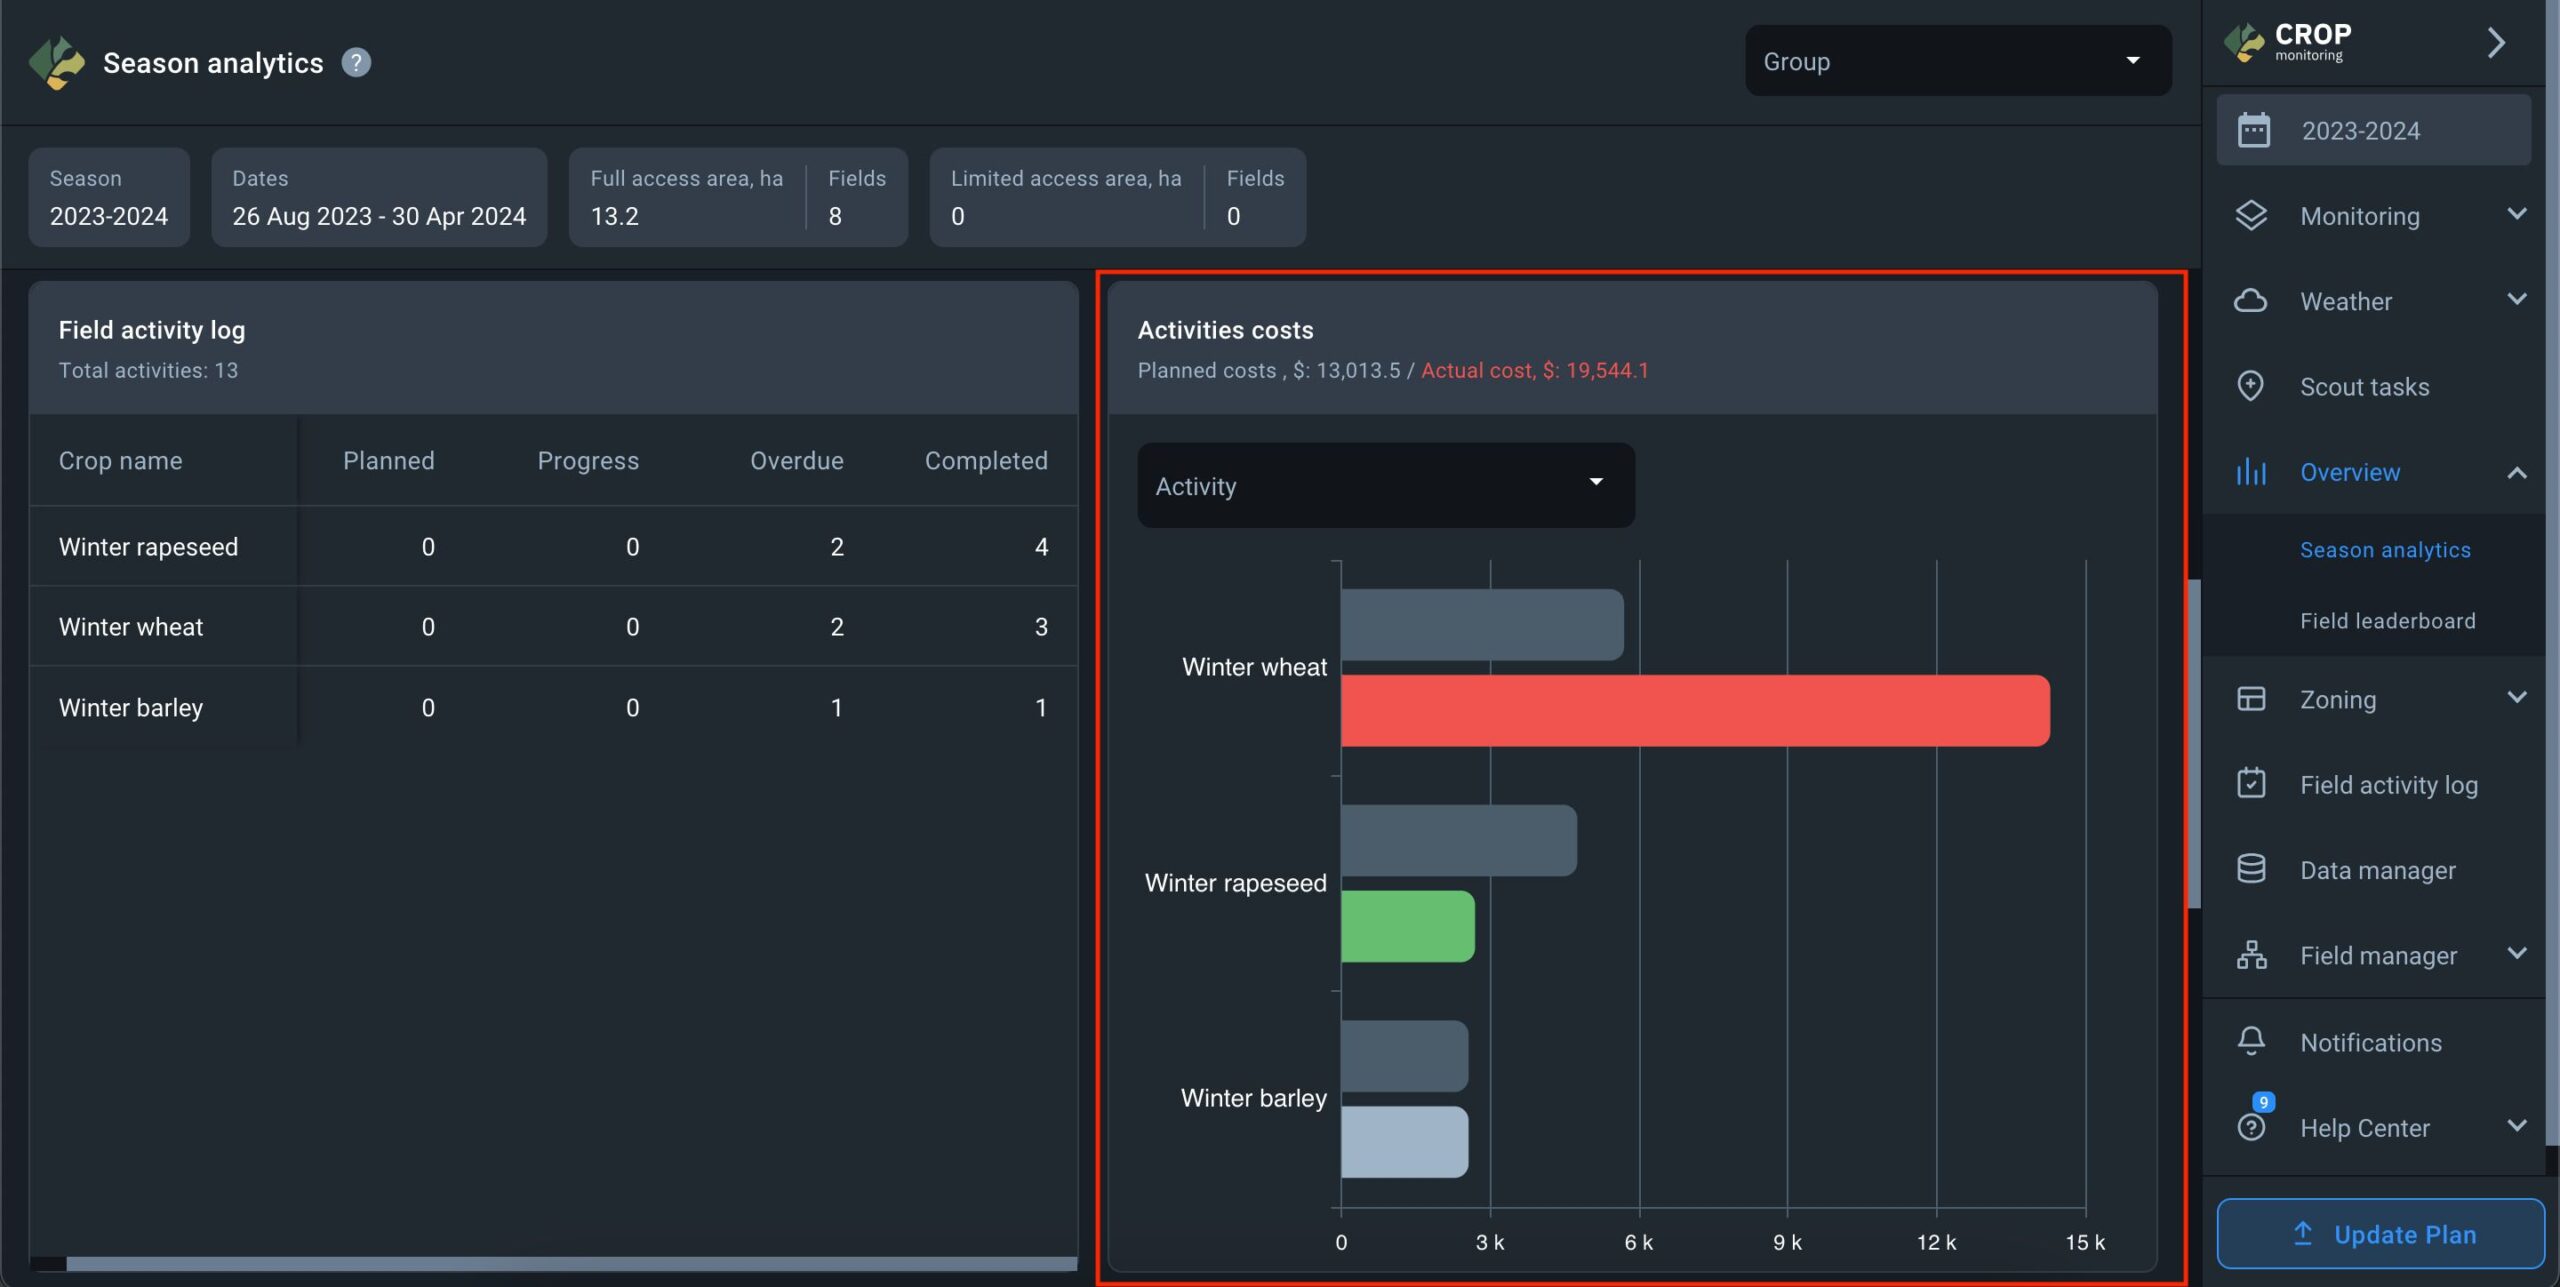
In the Field activity log widget, for each crop in the season, the total number of activities is displayed, further broken into four categories:
- number of planned activities under “Planned”,
- number of activities in progress under “Progress”,
- number of planned activities that have not been completed under “Overdue”,
- number of completed activities under “Completed.
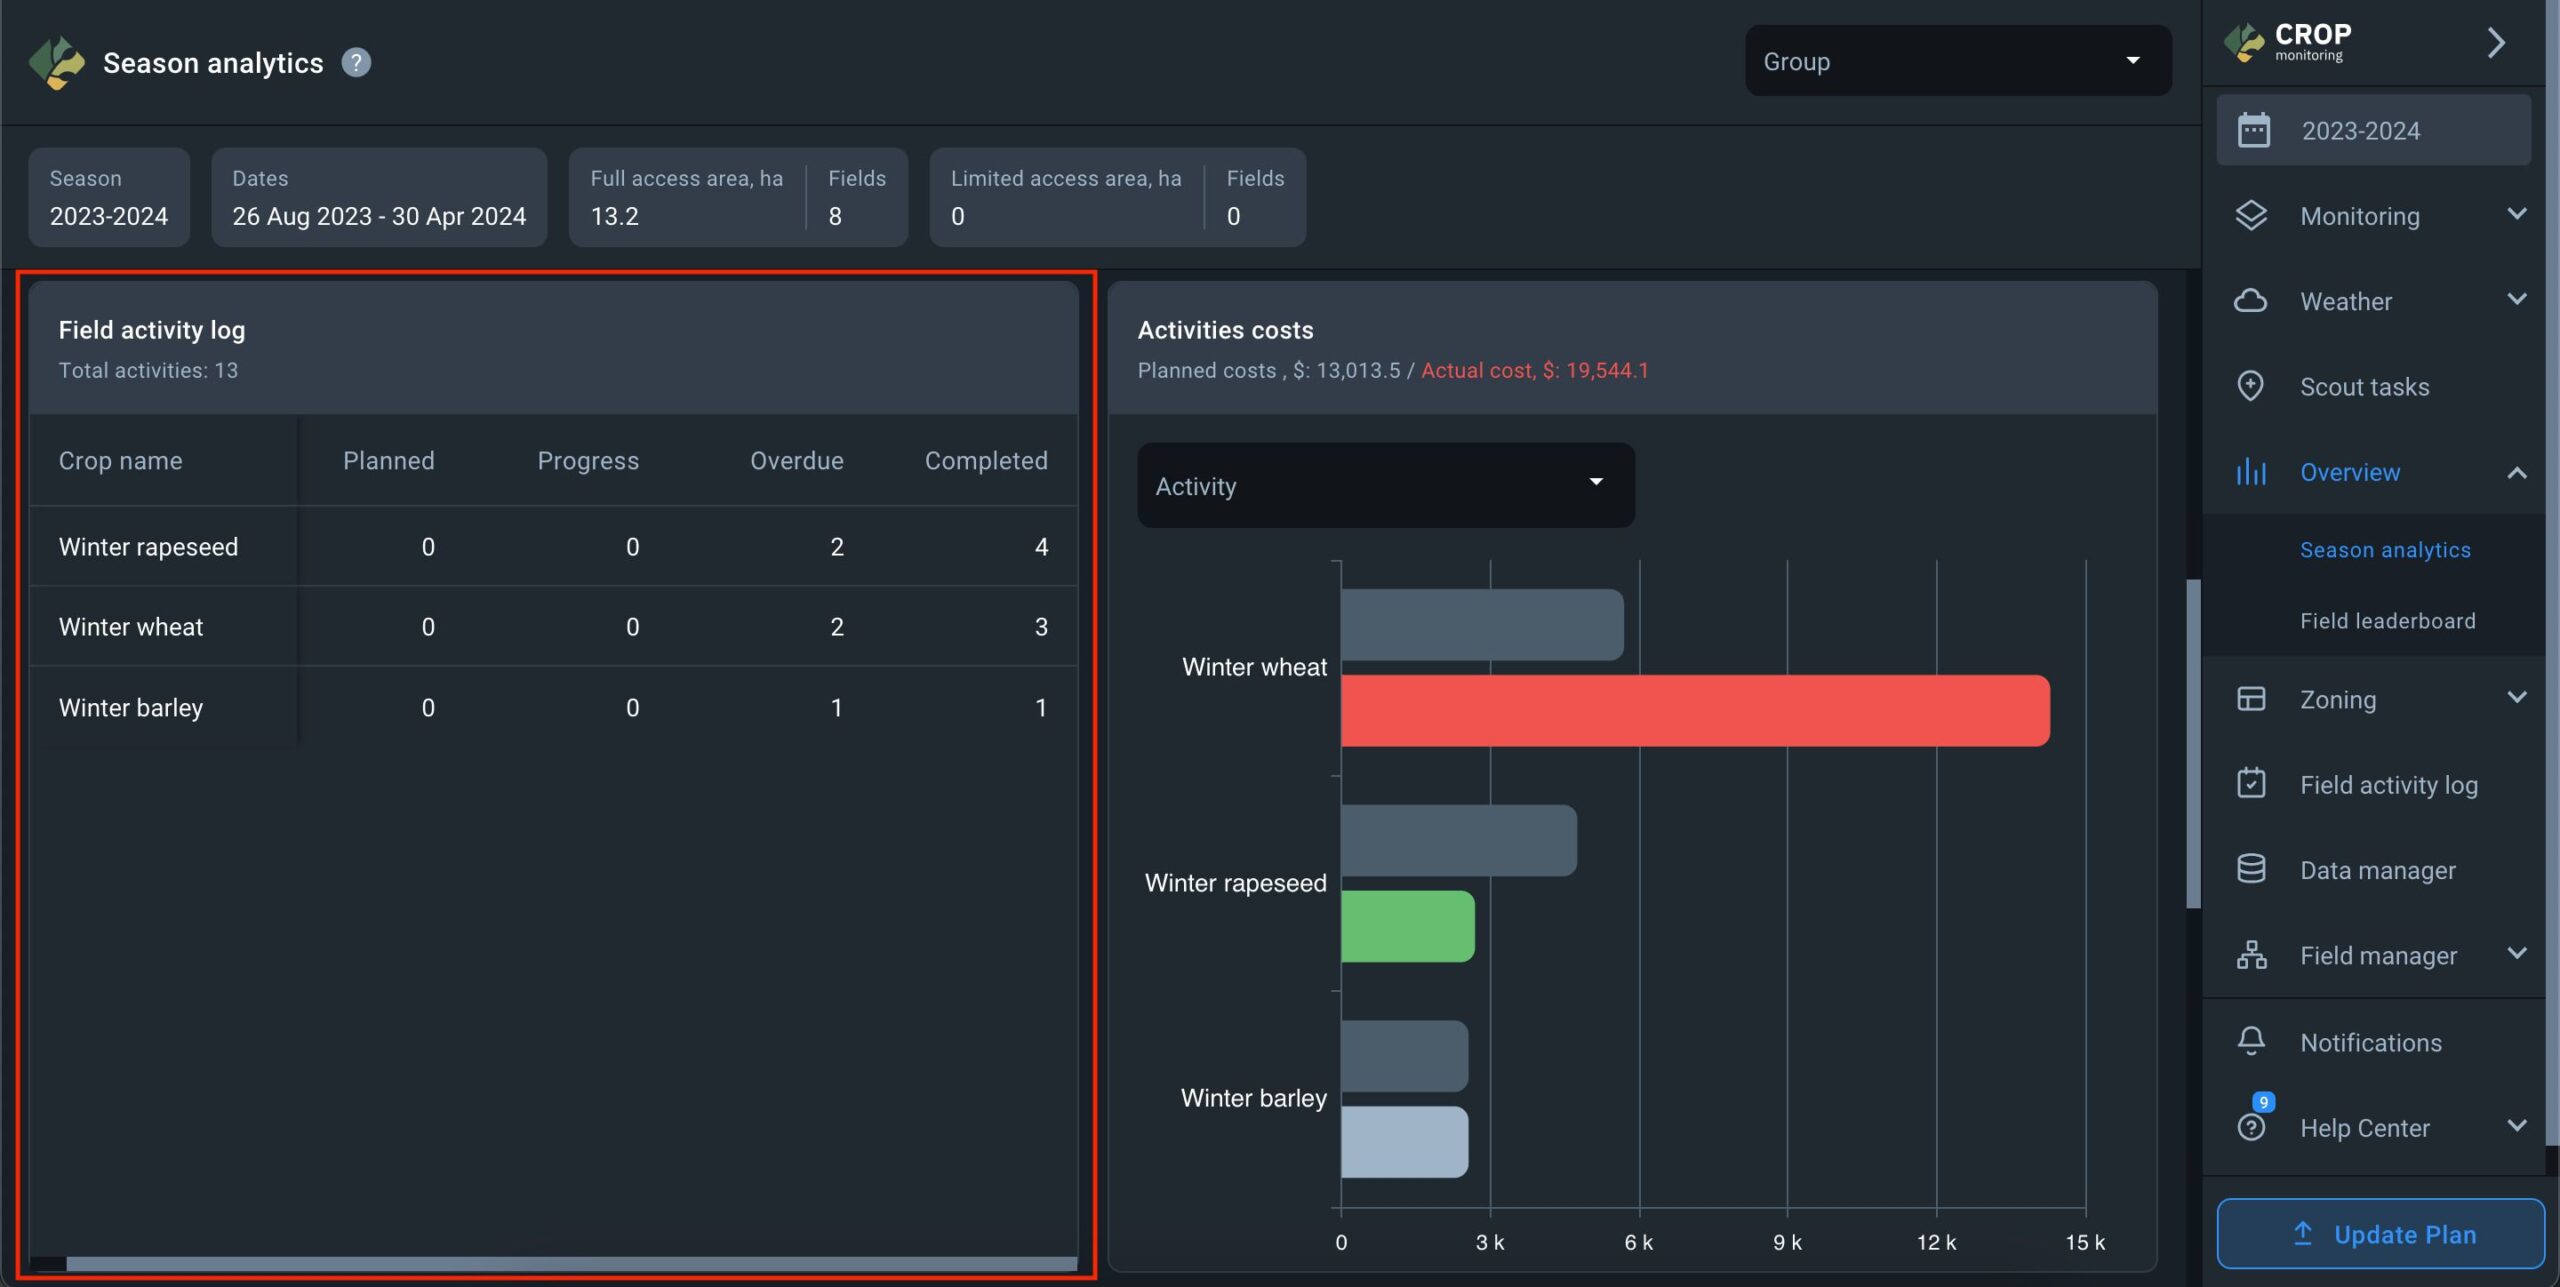
The Activities costs widget shows all costs spent on each crop in the season according to activities logged in the Field Activity Log. To ensure that costs are displayed accurately, you must enter costs for both planned and completed activities. Additionally, you can track deviations between planned and actual costs using this widget.
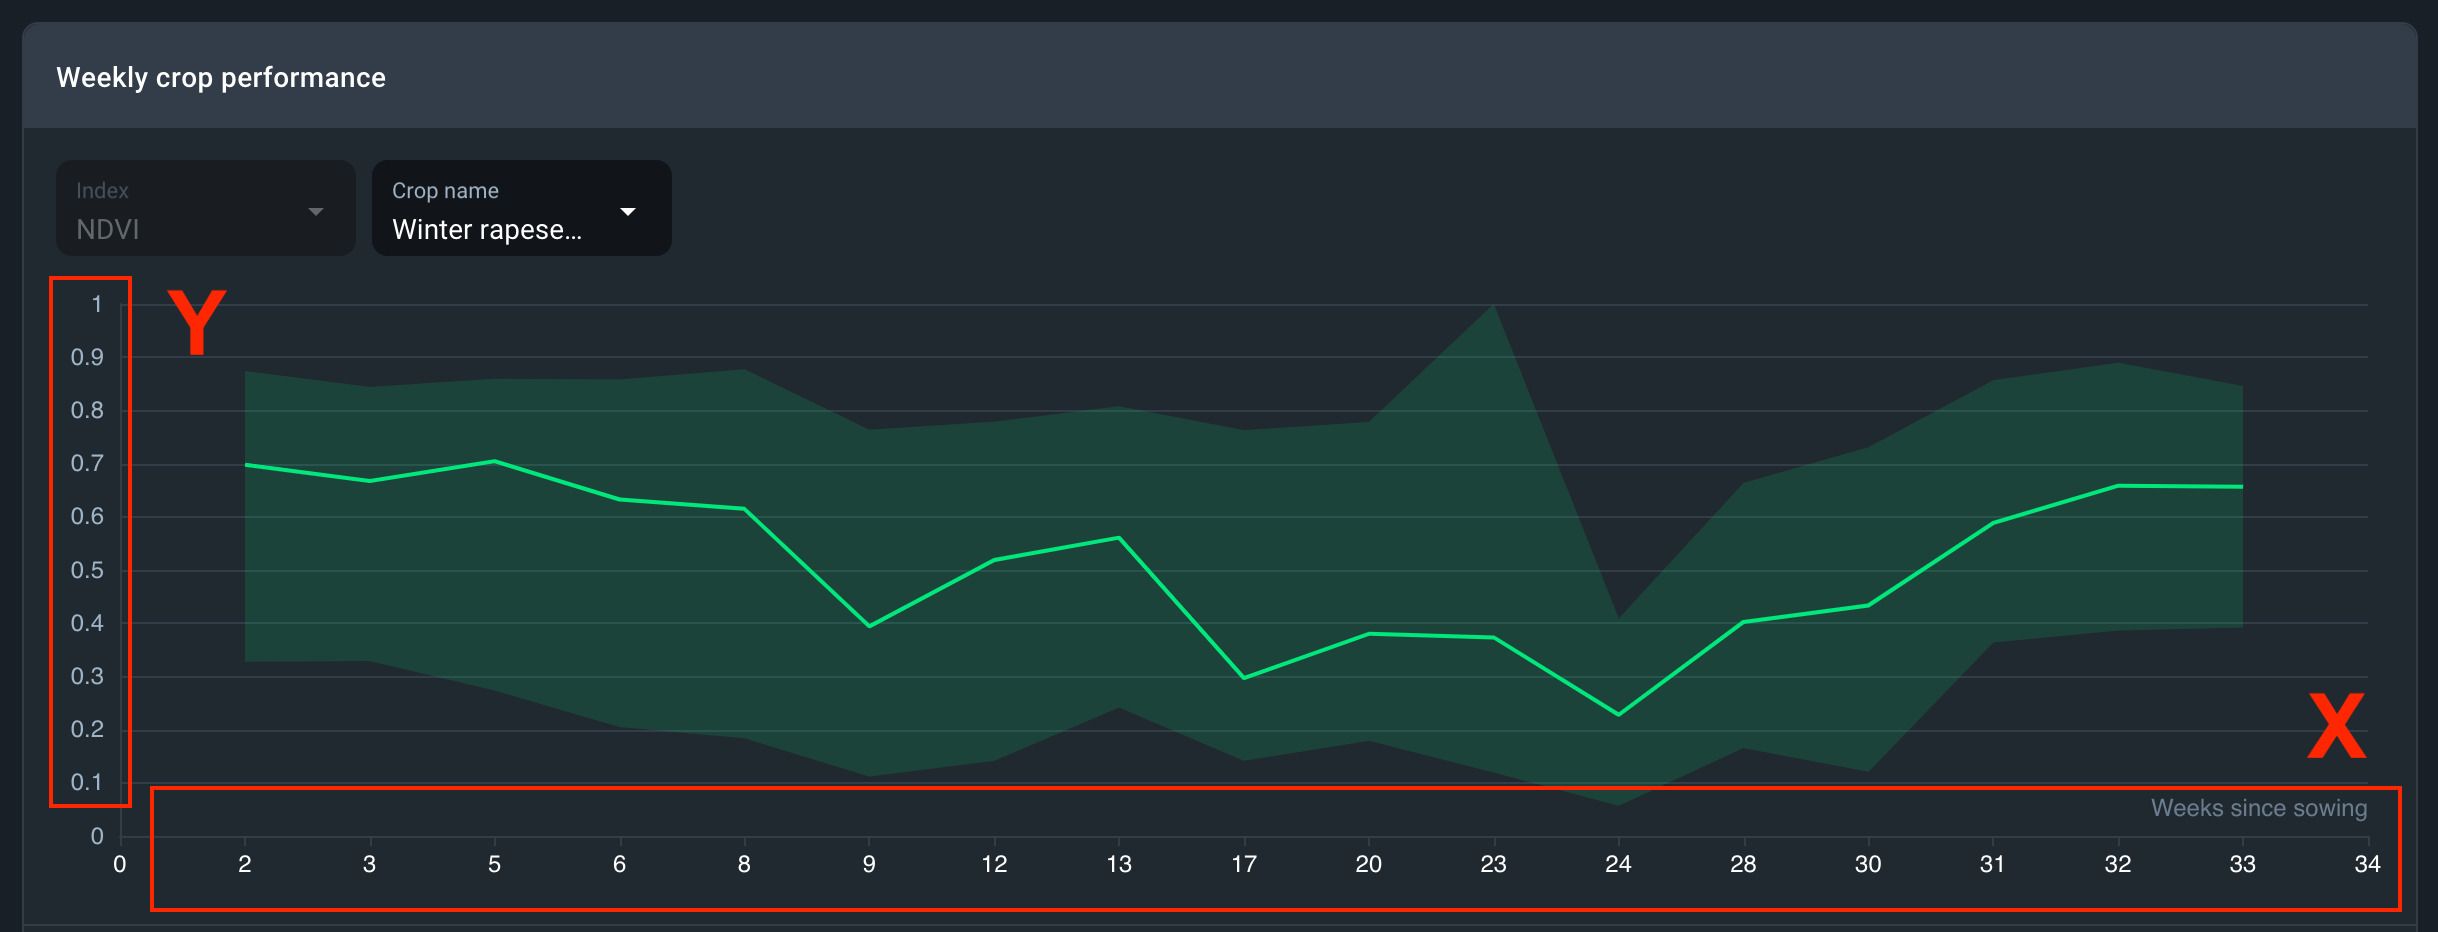
The Weekly Crop Performance widget illustrates the average crop development over time based on the NDVI index across all fields in the season where the selected crop is planted.
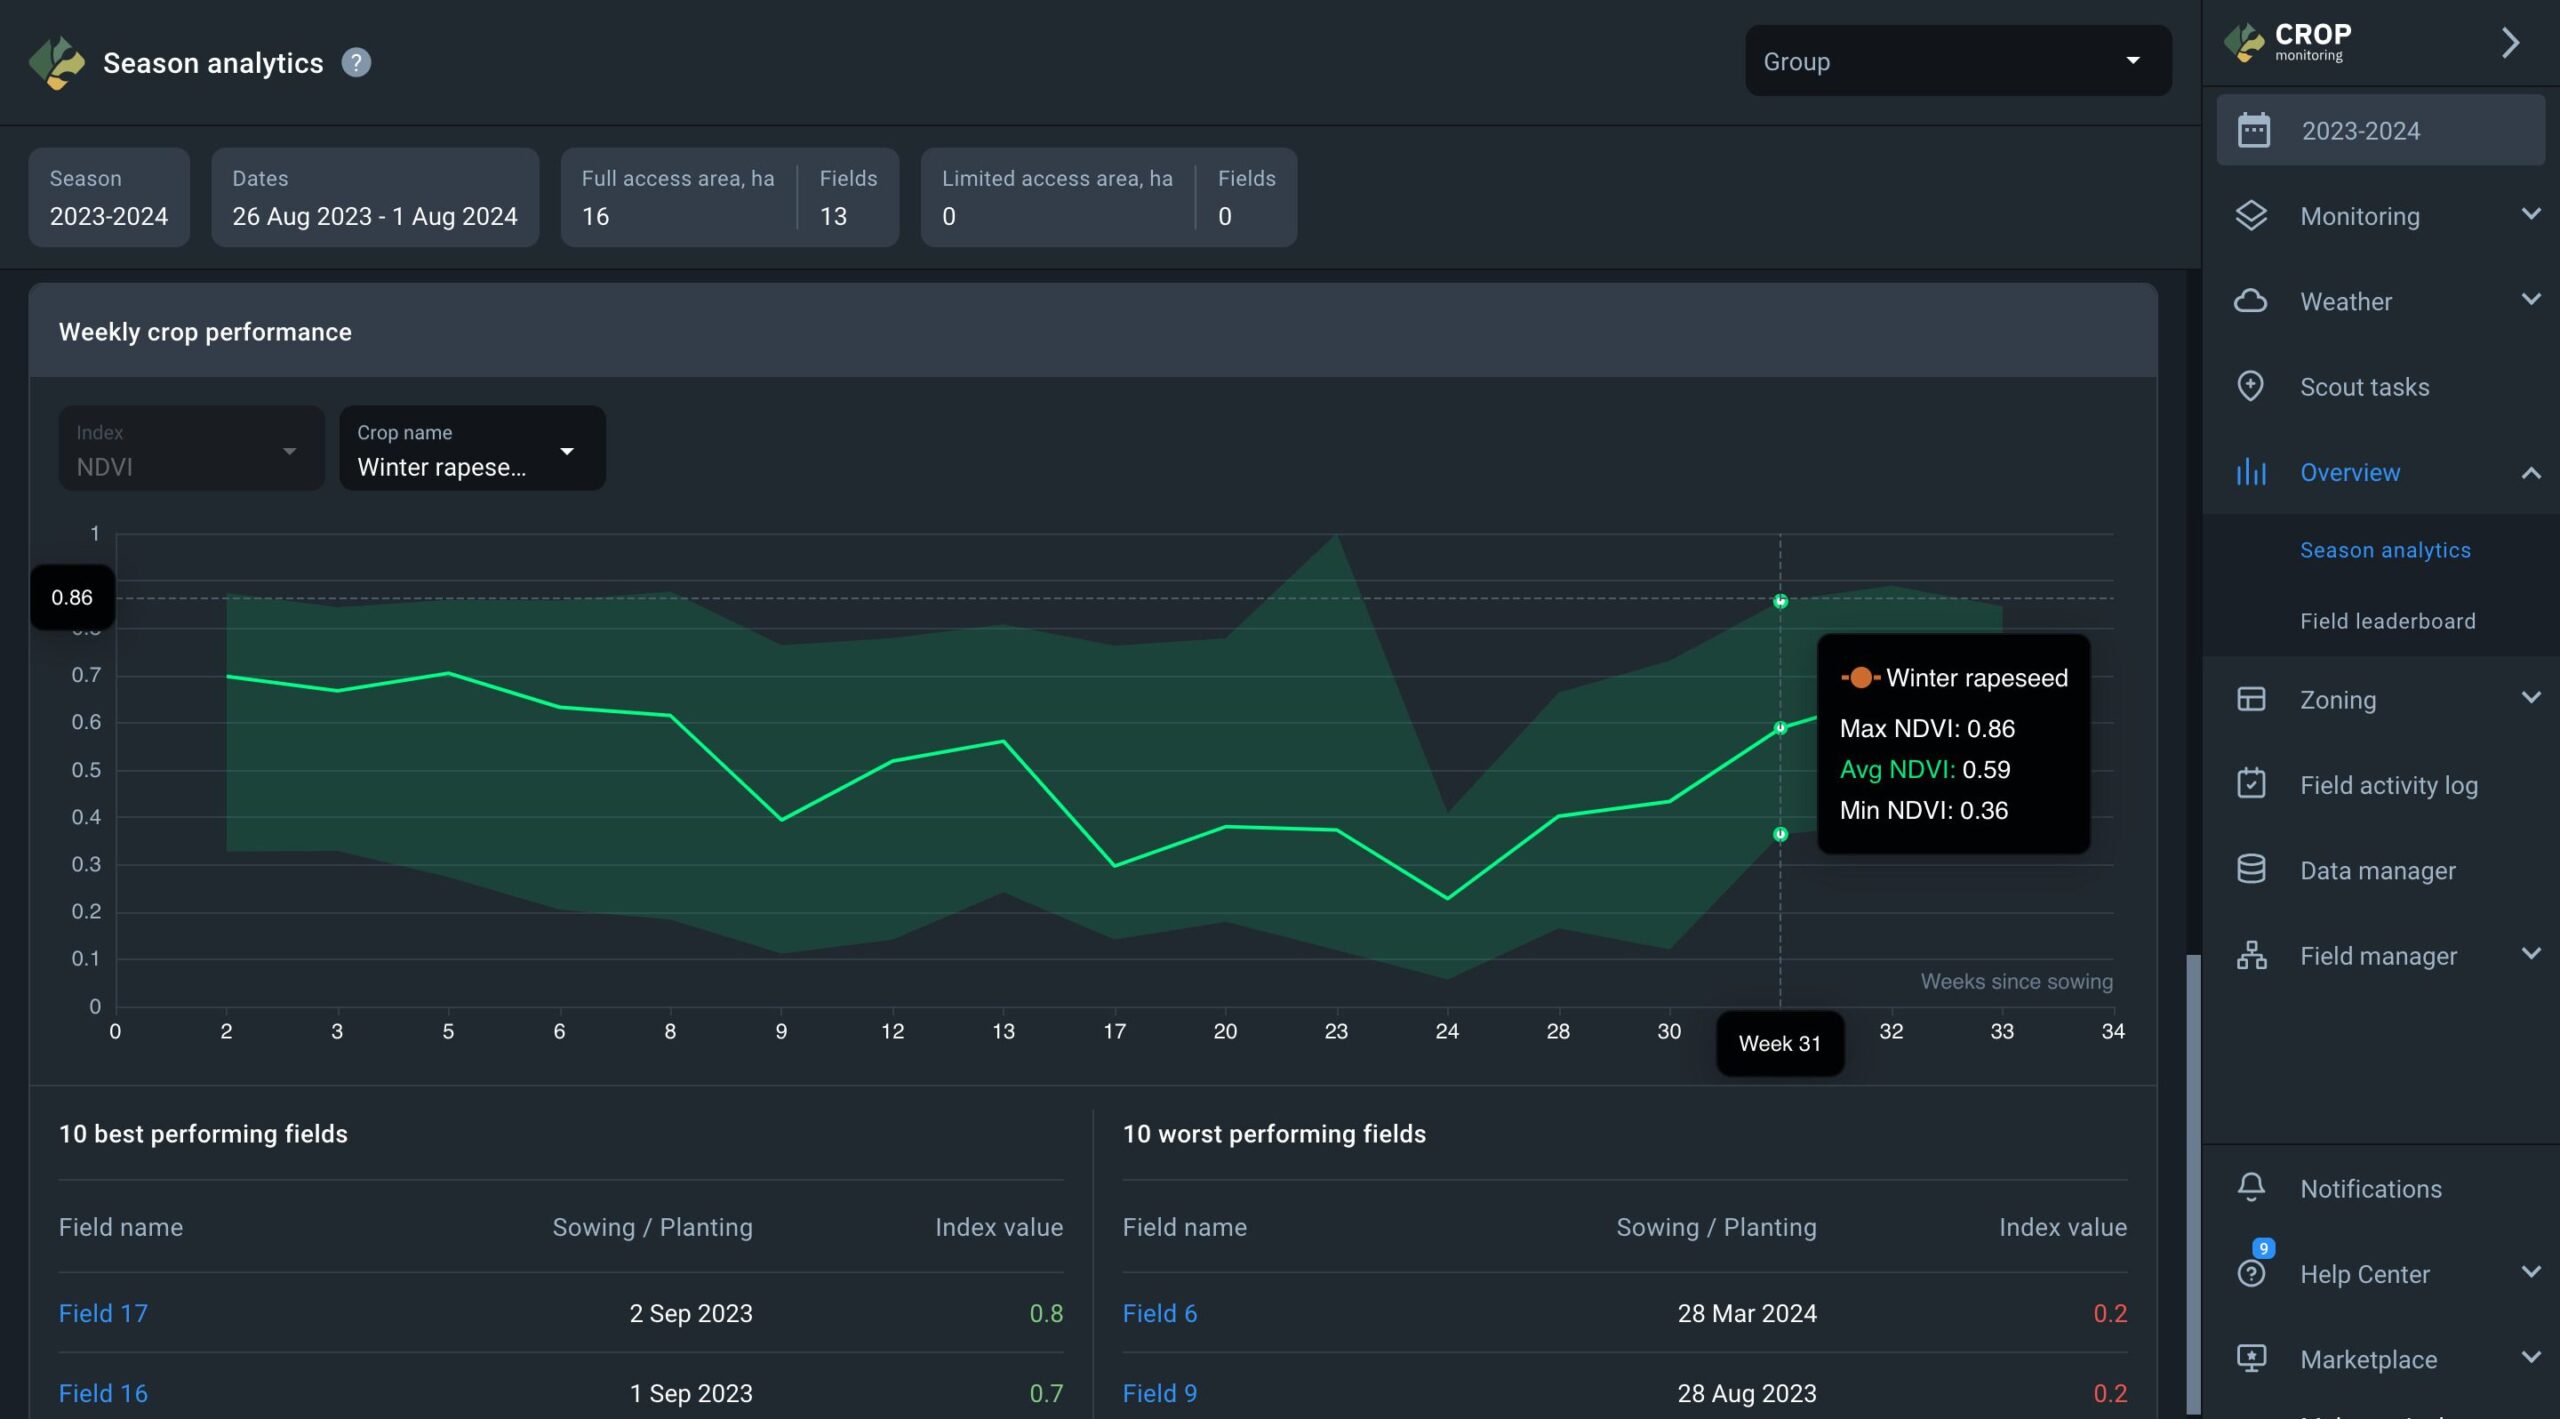
- The Y scale indicates the NDVI index values.
- The X scale represents the number of weeks from the earliest sowing date of the selected crop.
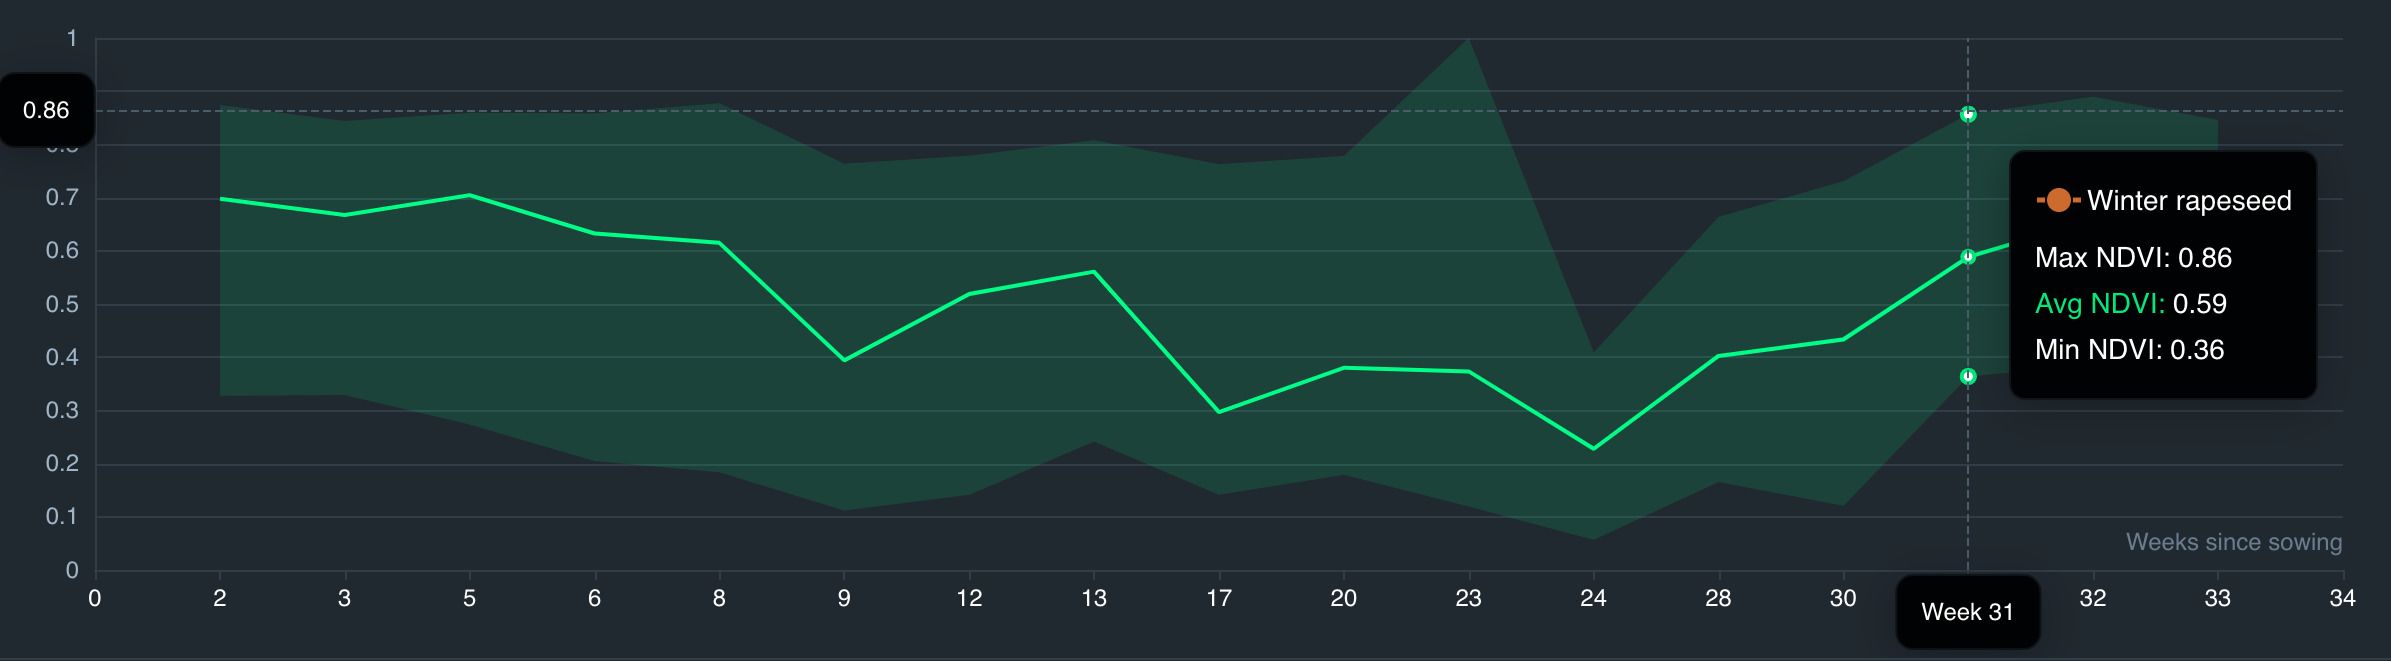
- When hovering over the graph, the average NDVI value for the selected crop for the week is displayed along with the maximum and minimum NDVI values.
Below the graph, you’ll find a table featuring the top 10 best and worst fields for the selected crop, determined by NDVI index values. These values are calculated based on the average NDVI value among all fields with the selected crop. For instance, if the average NDVI index among all fields with the crop “Corn (Maize)” is 0.5, fields with NDVI values lower than 0.5 will be listed in the table of the top 10 fields with the worst vegetation, while fields with NDVI values higher than 0.5 will be listed in the table of the top 10 fields with the best vegetation.
Notice: This data is displayed exclusively for an active season in the Seasonal Analytics section.
Field Leaderboard
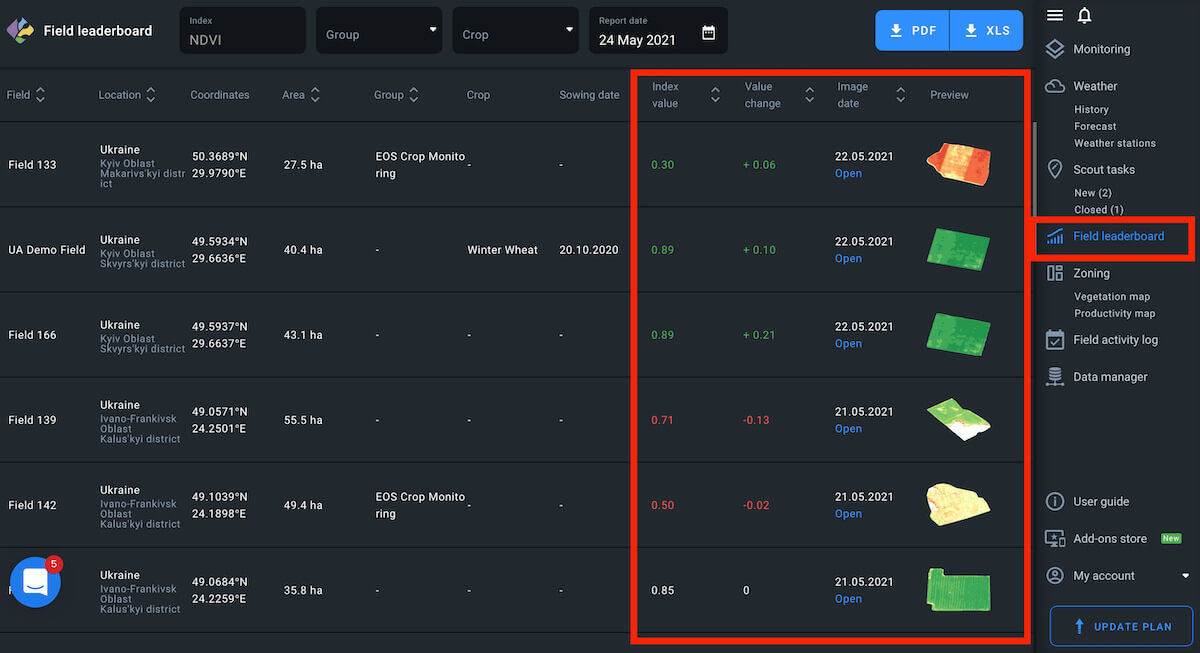
Field leaderboard has been designed to help users prioritize their field management tasks according to the NDVI value change. Leaderboard also arranges all of your fields in one place according to 1 of 8 different categories:
- Name
- Location
- Area
- Group
- Crop
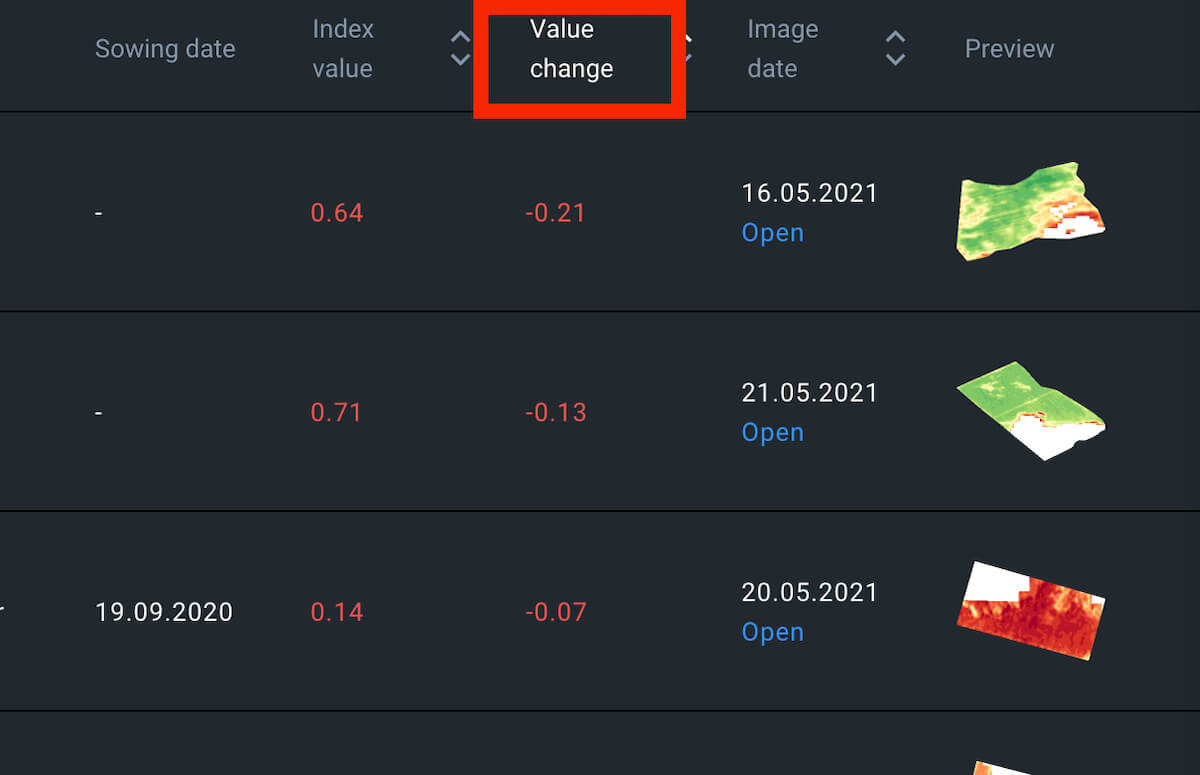
- Index value
- Value change
- Image date
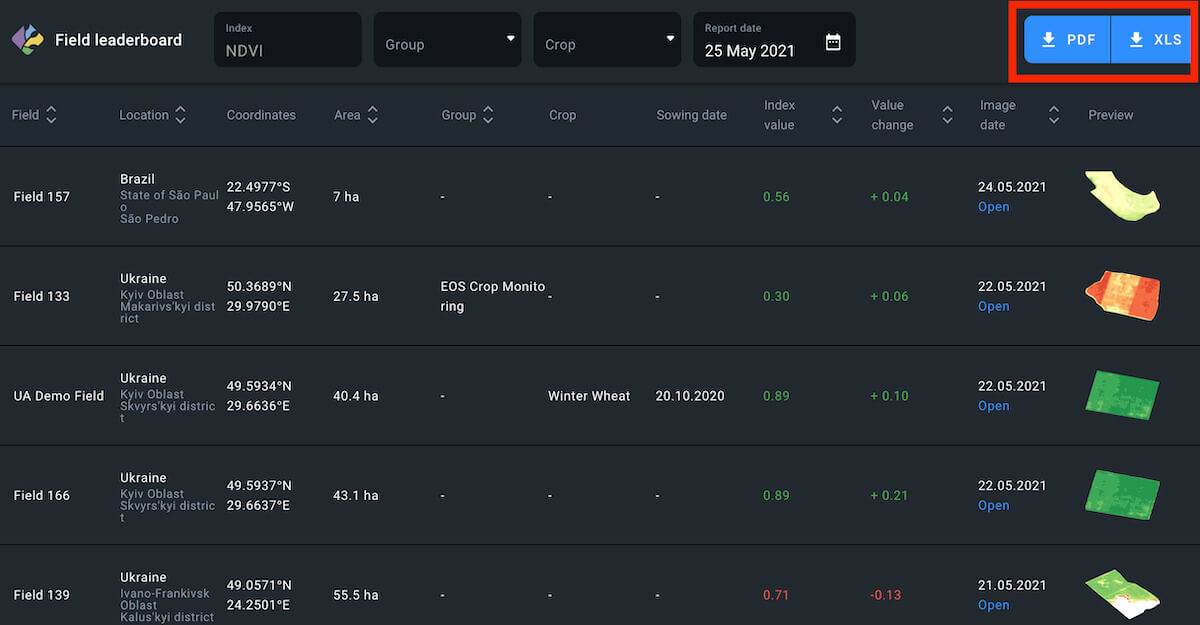
Each arrangement appears as a list of fields sorted and ranked accordingly and can be exported as a PDF file and/or .xls spreadsheet.
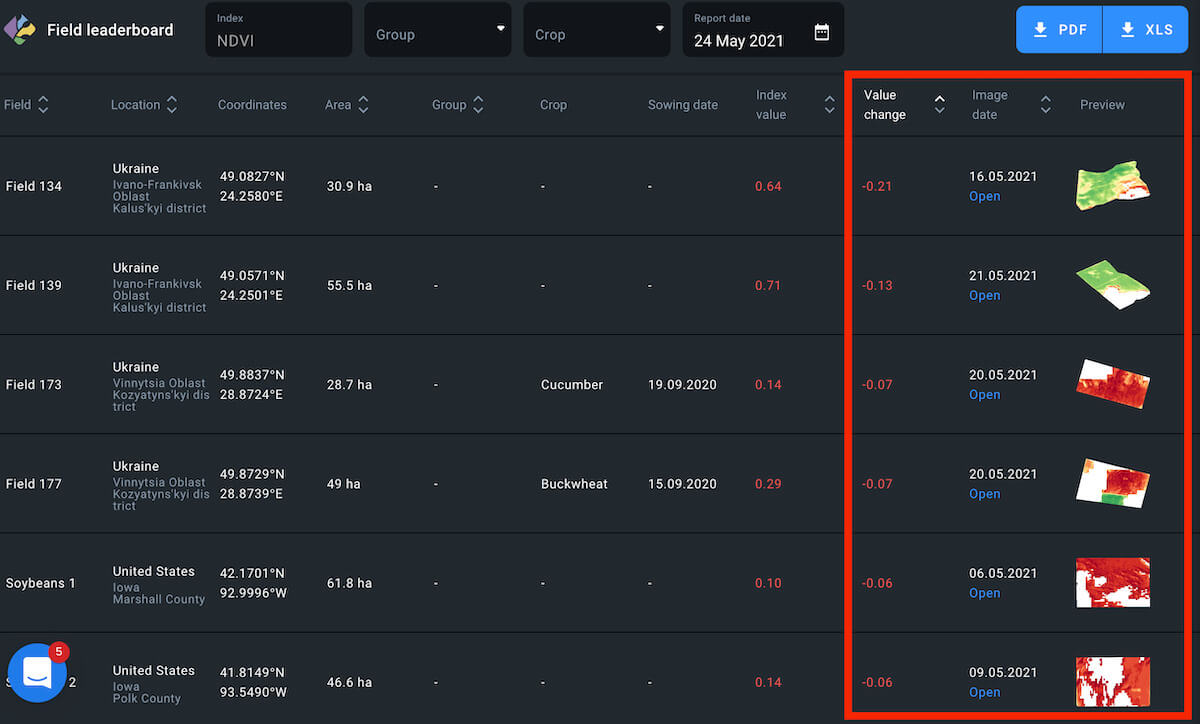
Default
By default, the leaderboard shows your fields arranged according to the latest available image and the most negative NDVI value change.
Note: the field with the latest available image may have less of a NDVI value drop compared to another field with an older available image. This allows you to focus on the most urgent issues first.
Notifications
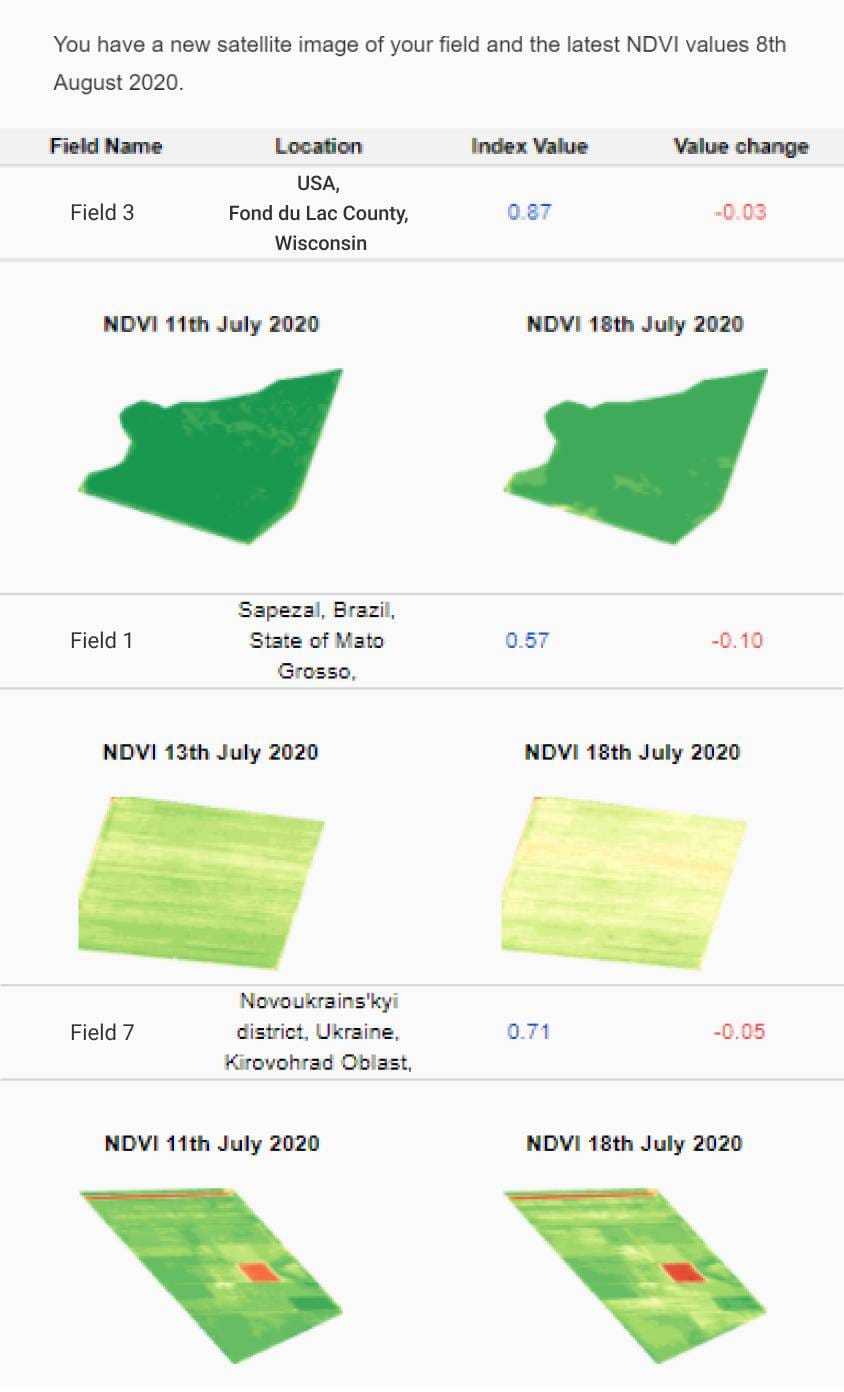
Every time there are new satellite images of one, several, or all of your fields, Leaderboard gets updated. You will automatically get notified about each update via email.
The notification email will contain the following data:
-
-
- current index value for the field
- value change compared to the previous image
- field name (the one you have assigned to it)
- field location
- new image date
- previous image date
-
Every notification email may contain the data for up to 3 of the fields that are currently at the top of the leaderboard.
NDVI Drop
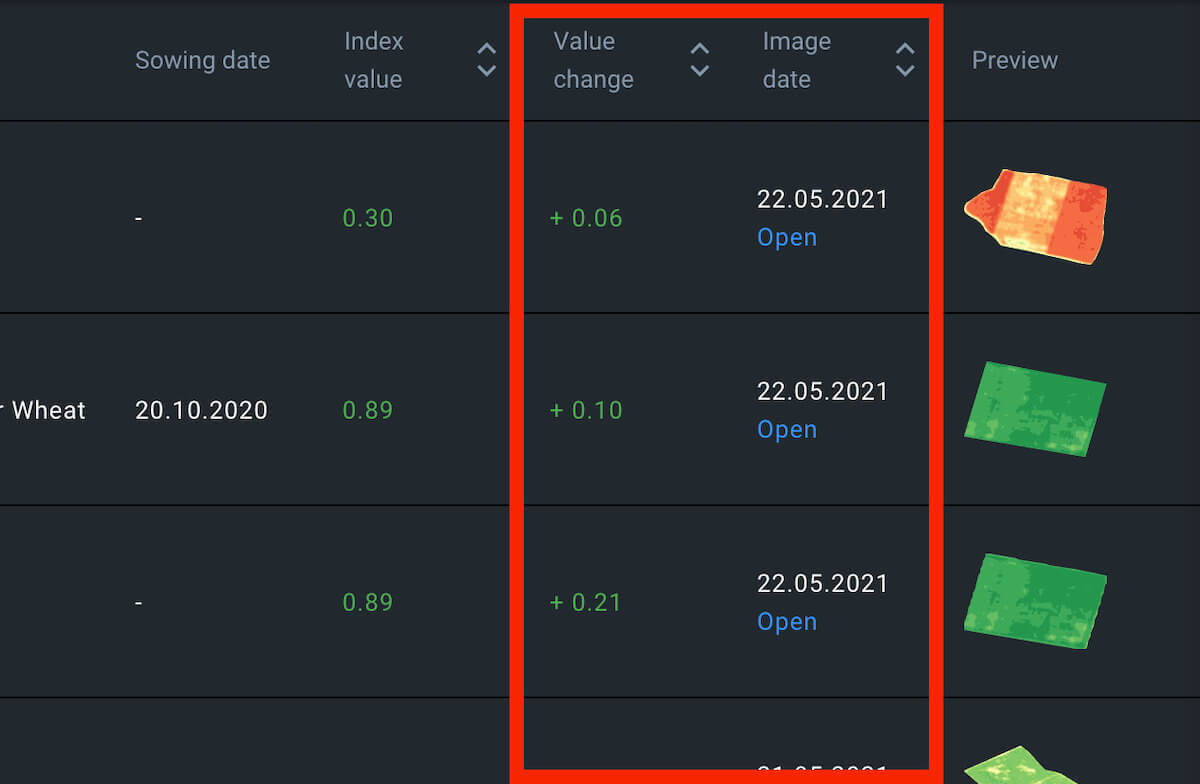
You can rearrange the leaderboard to show your fields ranked only according to the NDVI value change. The field with the largest NDVI value drop automatically moves up to the top of the leaderboard. On the contrary, the field with the largest NDVI value rise gets sorted to the bottom of the list.
Parameters
To rearrange the leaderboard, click on the appropriate sorting parameter above the leaderboard.
The parameter should light up.
Note: you can always tell which category arrangement is currently on the leaderboard by checking the parameter. Only one parameter can light up at a time.
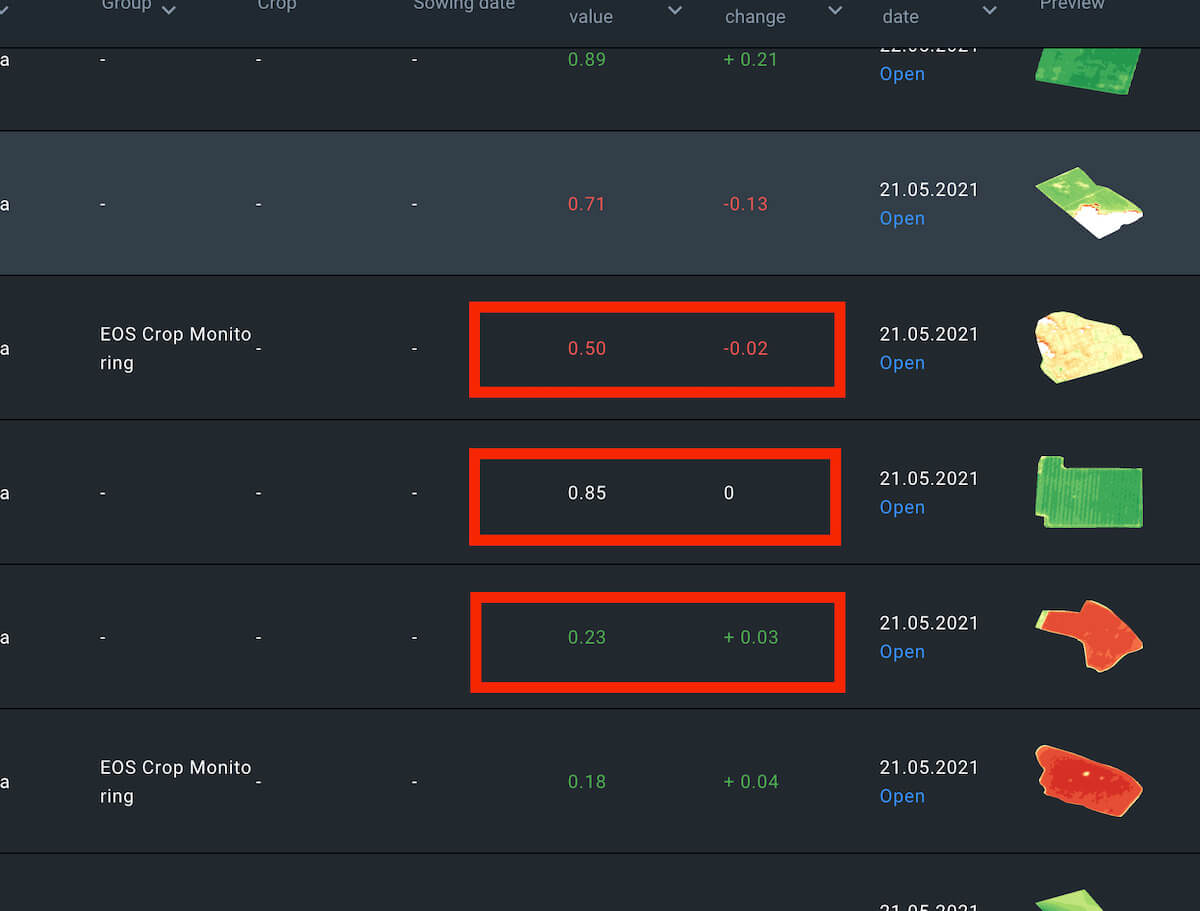
Color Code
NDVI value drop is marked by the red color and a minus “-” symbol, while the rising NDVI value appears green, with a “+” sign. If there has been no change over the period in question, NDVI value appears white.
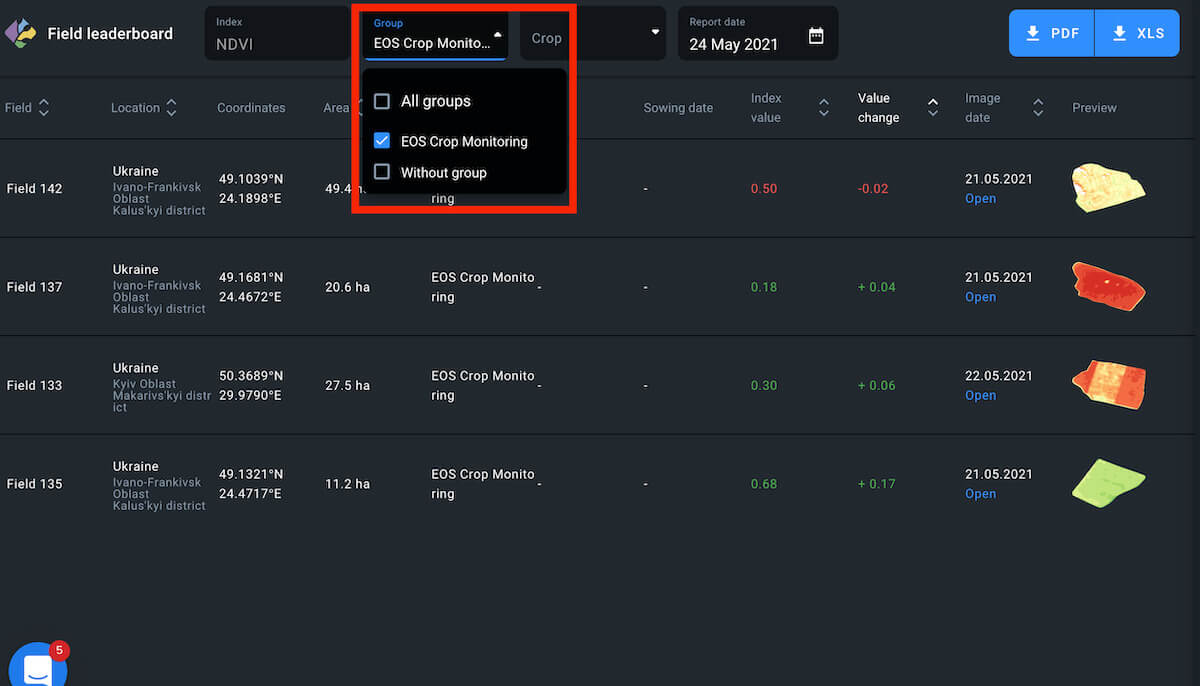
Group
You can sort fields according to the group. To view all fields at once, select All groups.
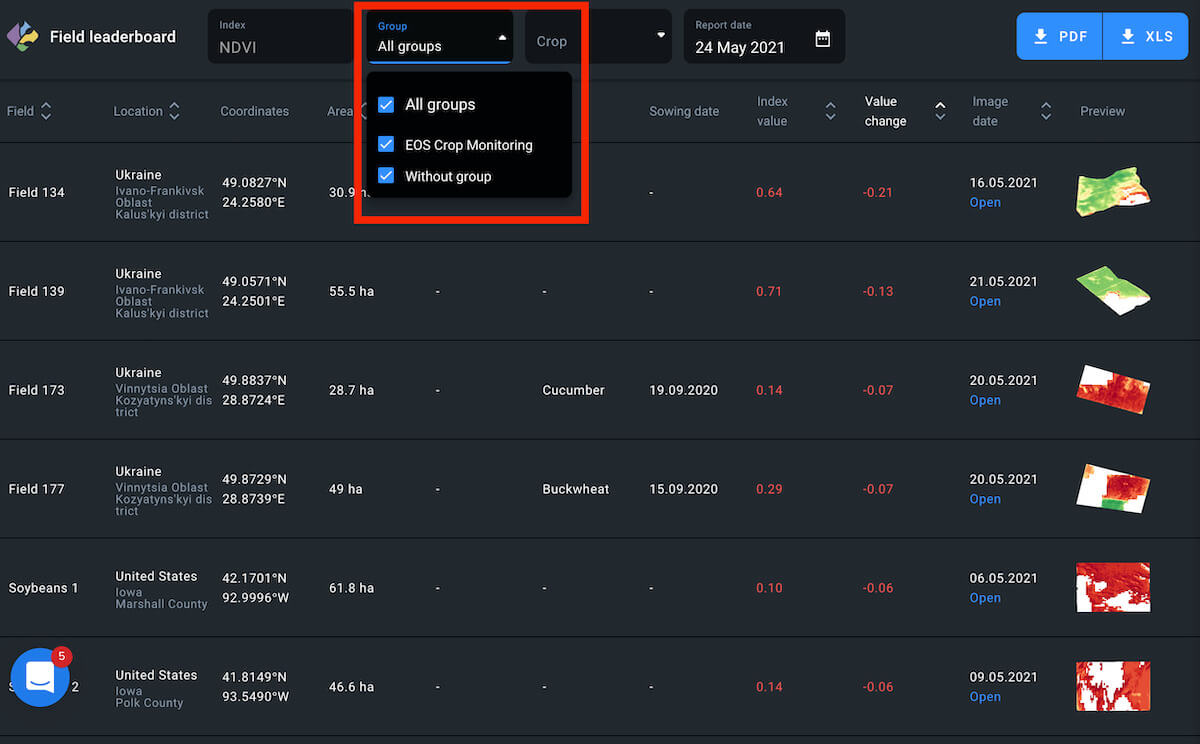
To view fields that do not belong to any group, tick the appropriate checkbox.
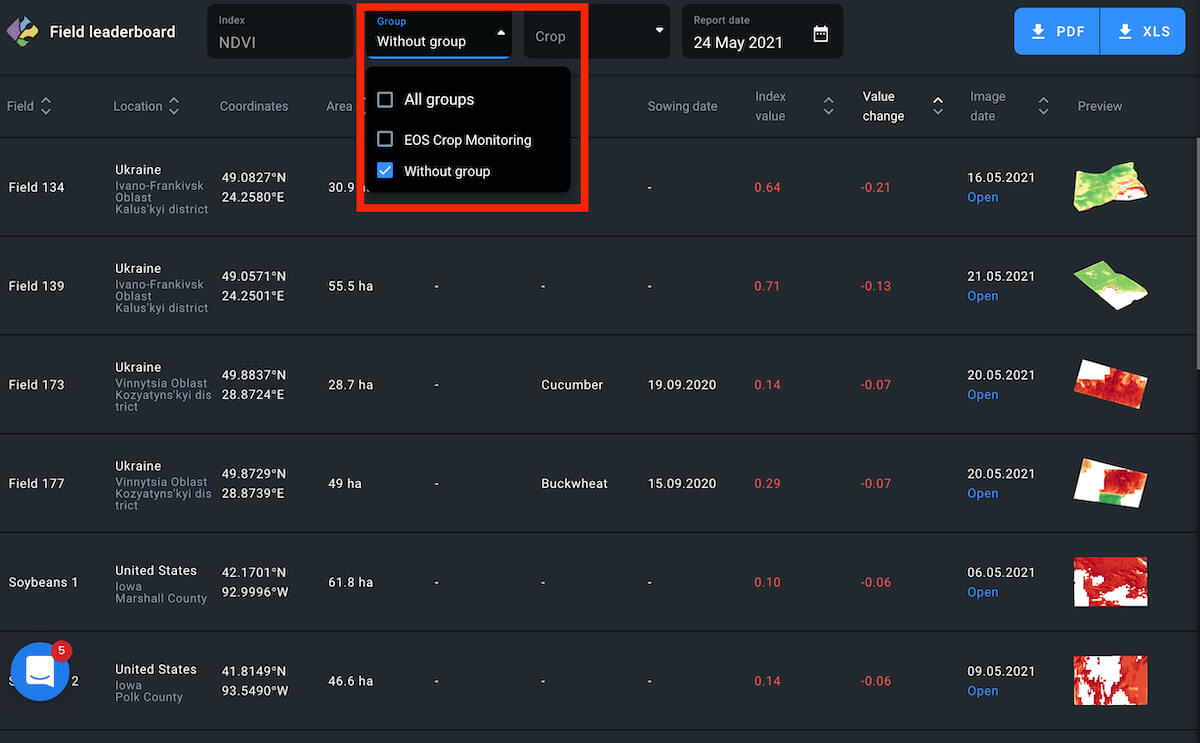
Another option is to view only the fields that belong to a specific group.
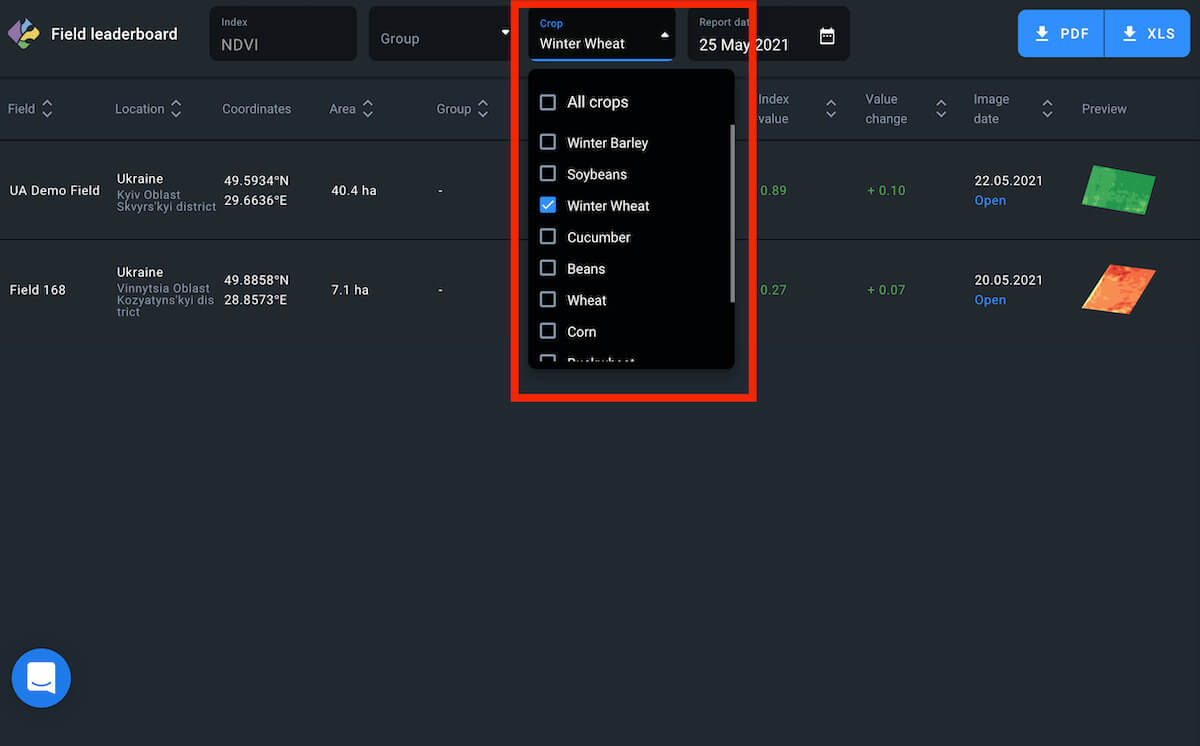
Crop
You can also arrange fields according to their currently growing crop type.
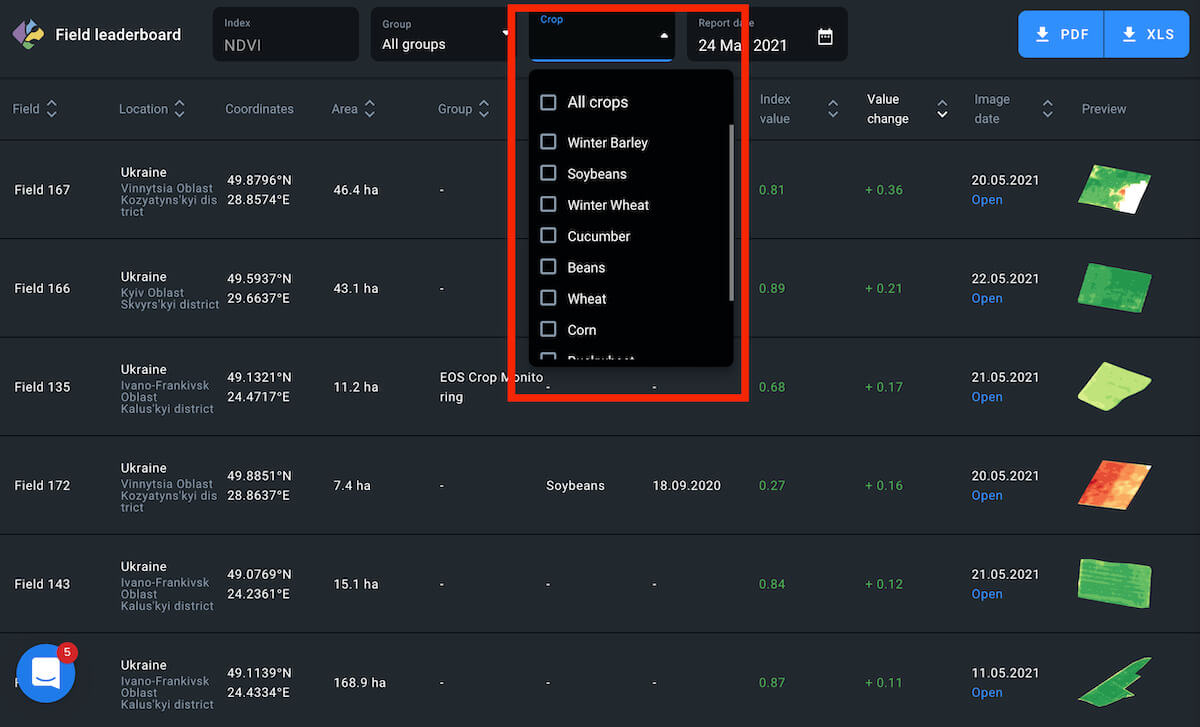
To view the fields with a common growing crop, click on the appropriate checkbox.
Note: Fields without added crop rotation data cannot be arranged according to crop type.
Download
You can rearrange the fields on the leaderboard in 9 different lists and download them as PDF file and/or xls. spreadsheet.
The download begins automatically as soon as you click on the PDF or XLS button.
Select Date
You can select a date to view the NDVI change for the period between two available images of the same field (3-5 days).
1. Find the Report date field right above the leaderboard.
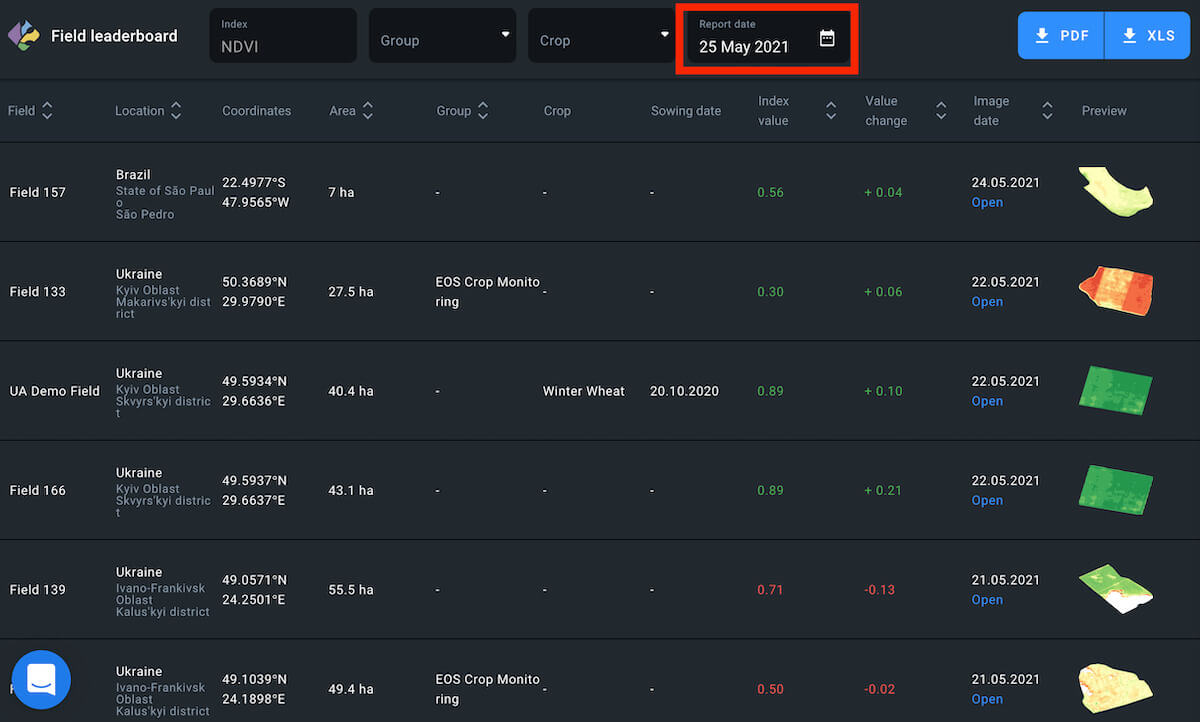
2. Click anywhere on the Report date field
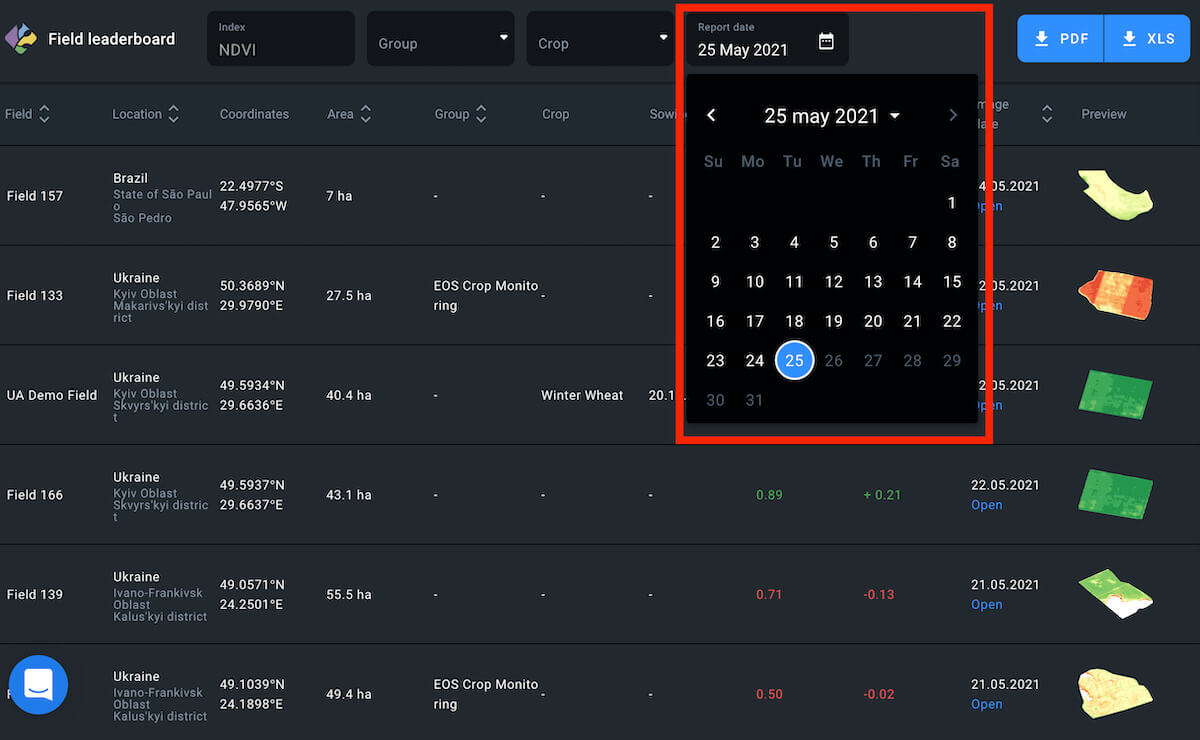
3. Select the date in the pop-up calendar in 1 click
The leaderboard will automatically refresh to show you the data for the period between two images closely preceding the selected date.
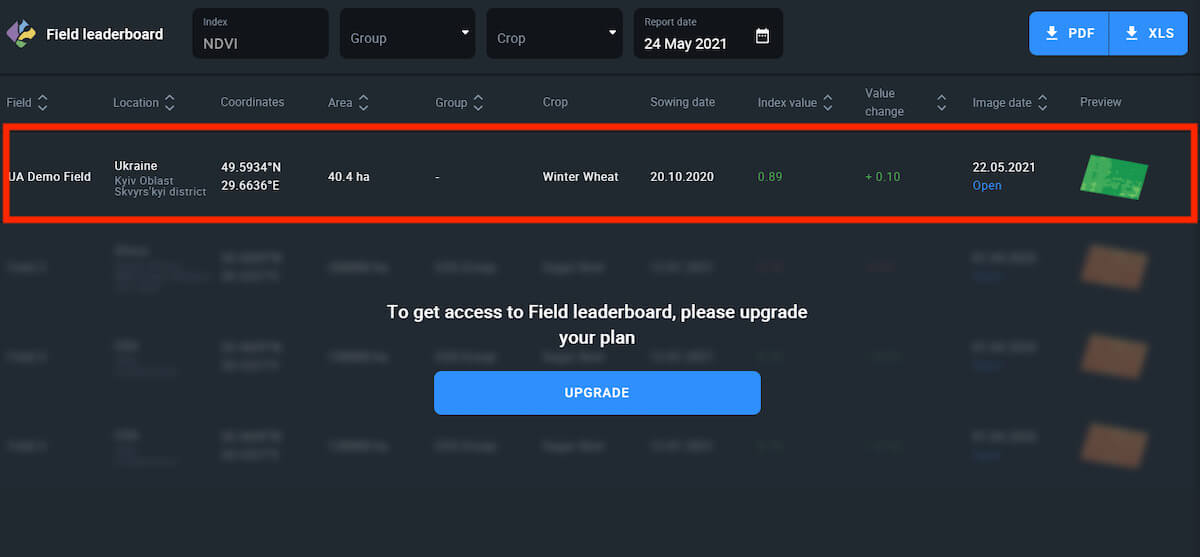
Free Account
To access the Field leaderboard, you need to update your pricing plan to Essential or Professional.
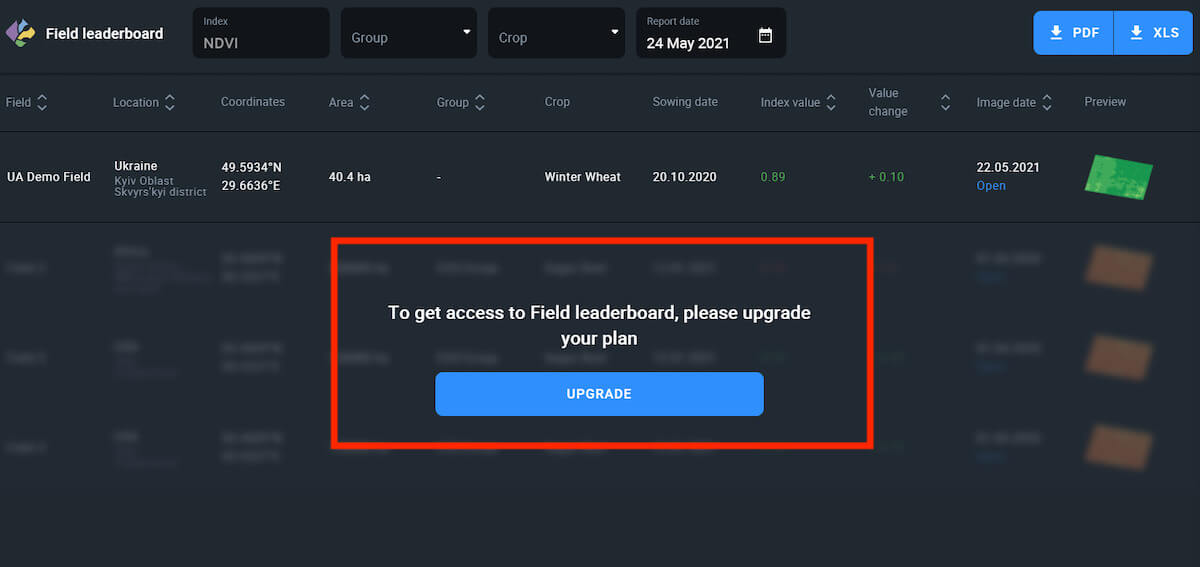
You can try out the Field leaderboard feature on your Demo field in the Free Account.
Note: Only the Demo field data will be accessible.
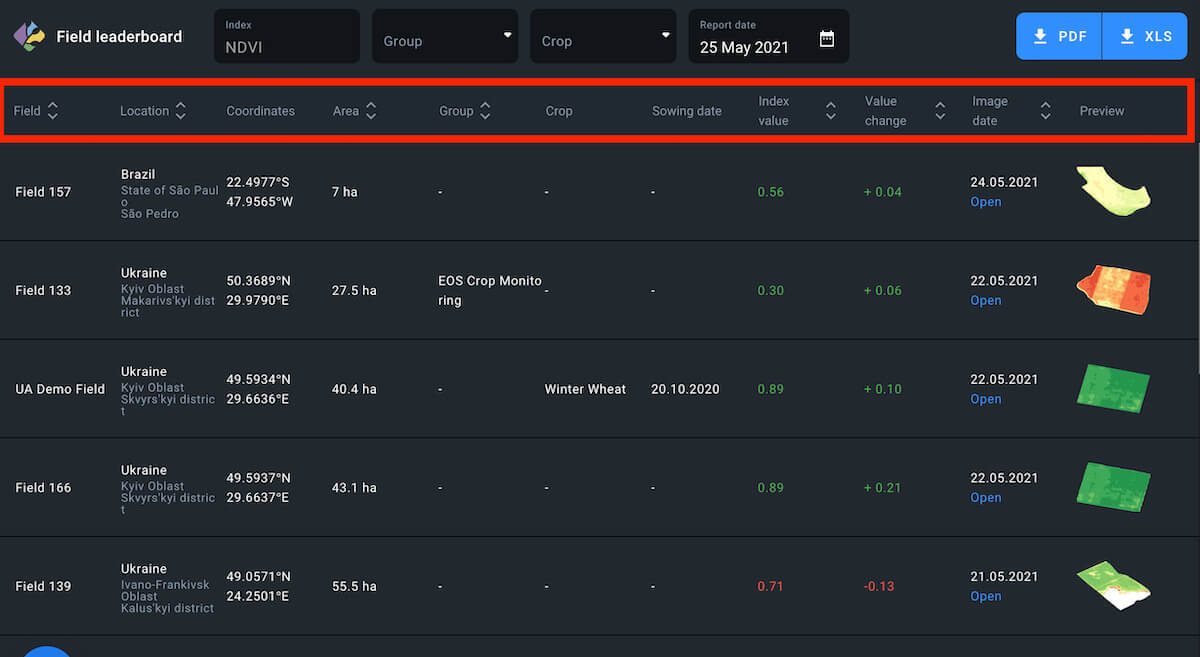
Sort
Additionally, you can sort fields within the leaderboard based on 7 different attributes:
-
-
- Name (in the alphabetical order)
- Location (in the alphabetical order)
- Area (least to greatest and vice versa)
- Group (1 group/some groups/all groups/without group)
- Index value (least to greatest and vice versa)
- Value change (difference between two images)
- Image date (oldest to newest and vice versa)
-
You can create 7 different leaderboards with fields arranged differently and download each leaderboard as either a PDF file or xls. spreadsheet.
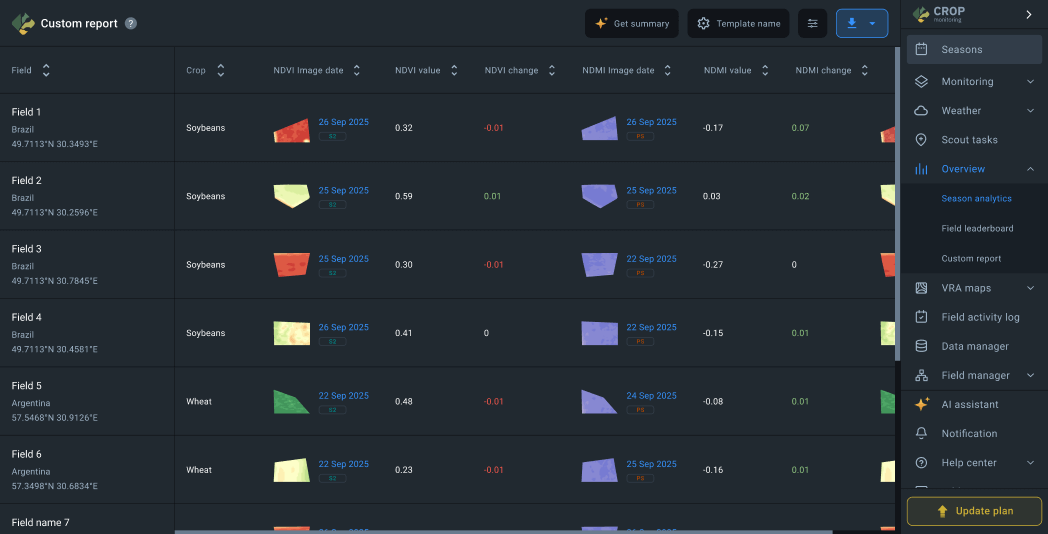
Custom Report
The Custom report feature allows you to generate tabular reports on the current state of your fields in a format that works best for you. There’s no limit to the number of reports you can create for each query. The reports support both vertical and horizontal scrolling depending on the amount of available data.
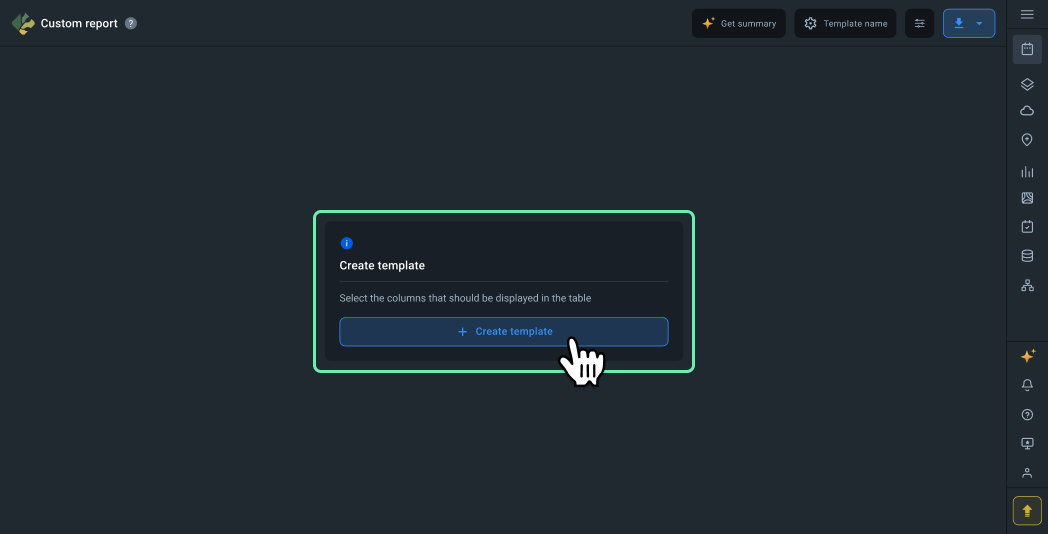
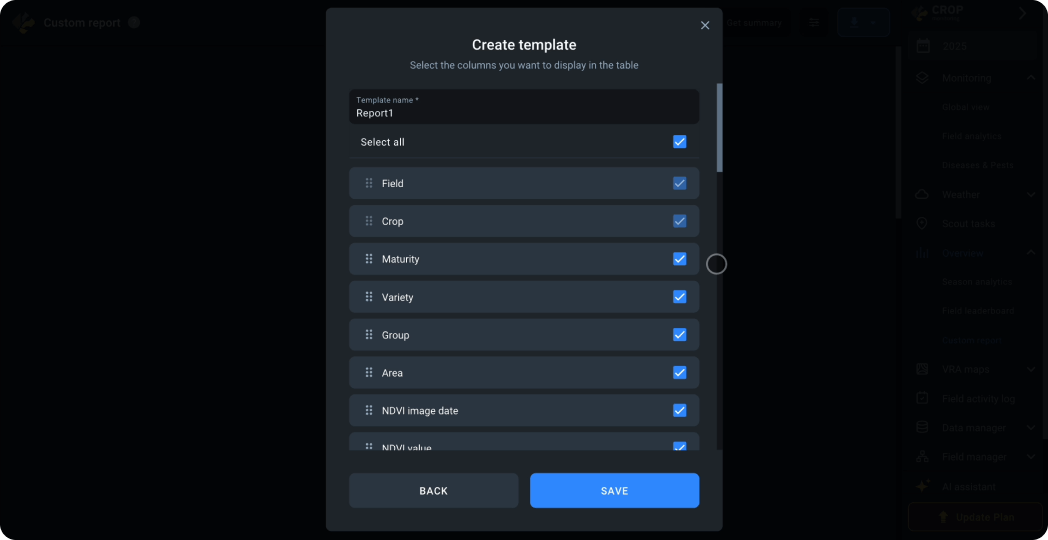
Creating your first report
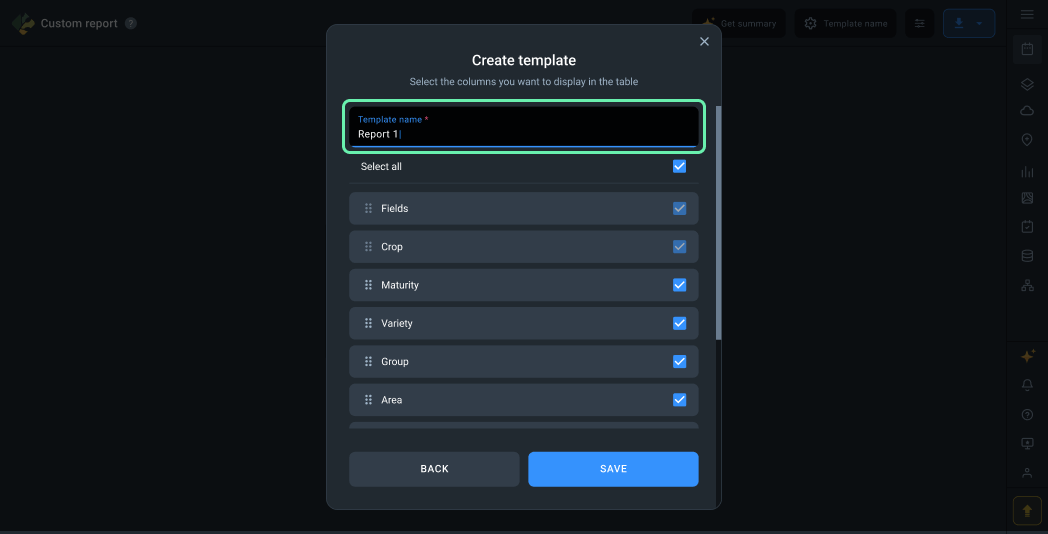
- Go to the Custom report page and click the “Create template” button.

- In the template creation window, you can enter a custom name for your report.
- Below, you’ll find the complete list of available columns for the report.

- You can rearrange the column order as needed.

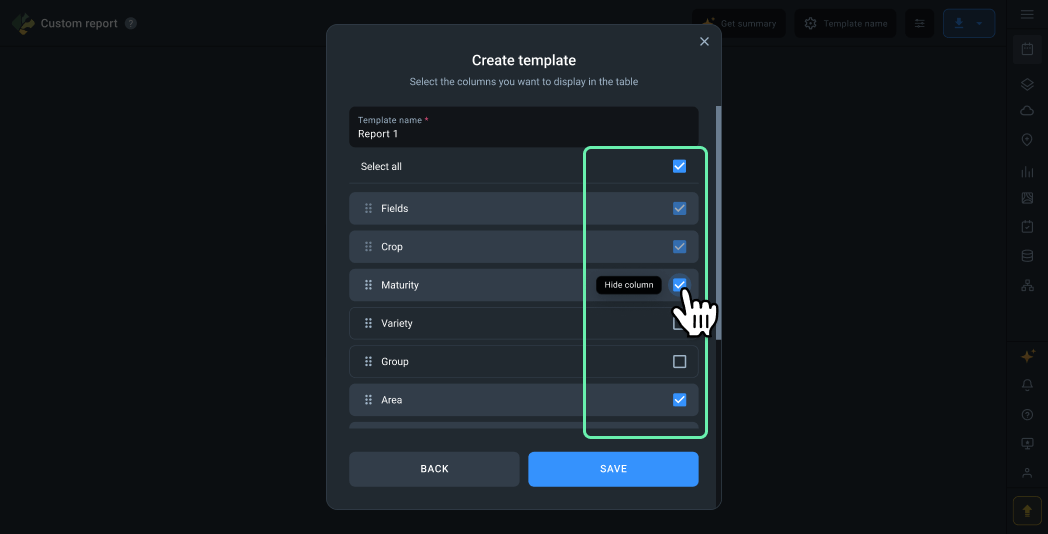
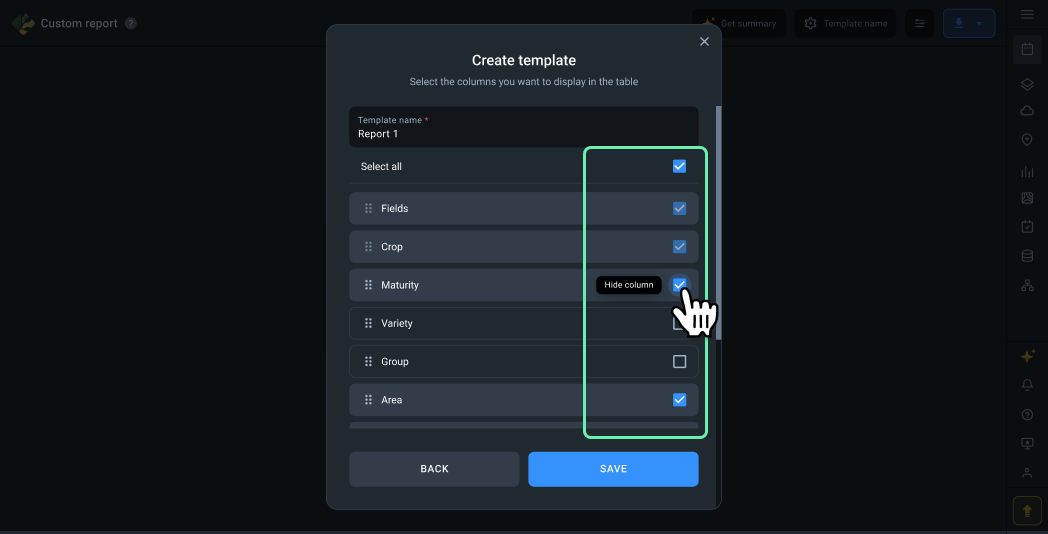
- You can hide unnecessary columns to monitor only the information you need. Please note that the Field and Crop columns have a fixed order and cannot be hidden.
- When you click the “Save” button, changes are saved to the template, and data processing for the selected columns begins. Depending on the data volume, processing may take anywhere from a few seconds to an hour.

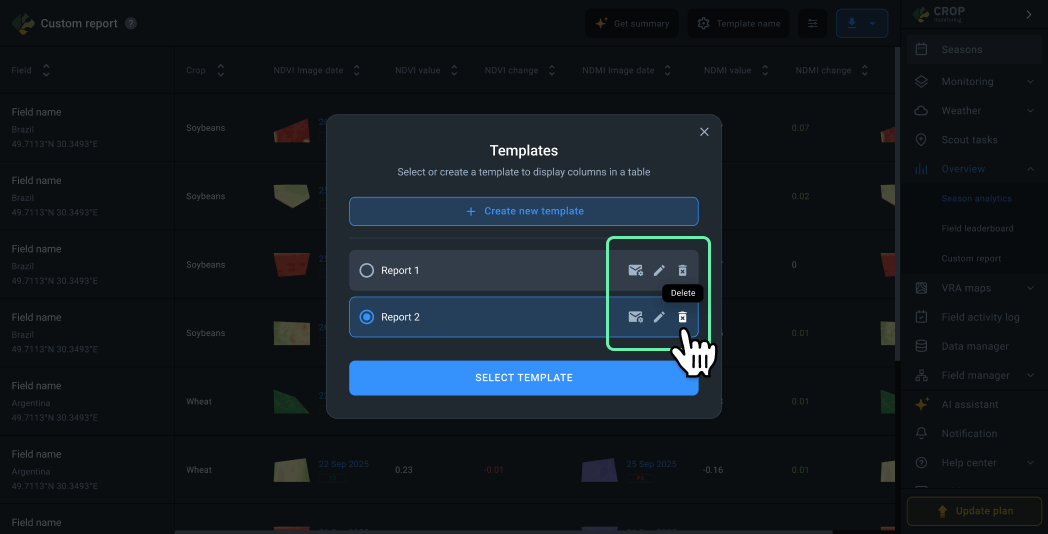
Creating a new template
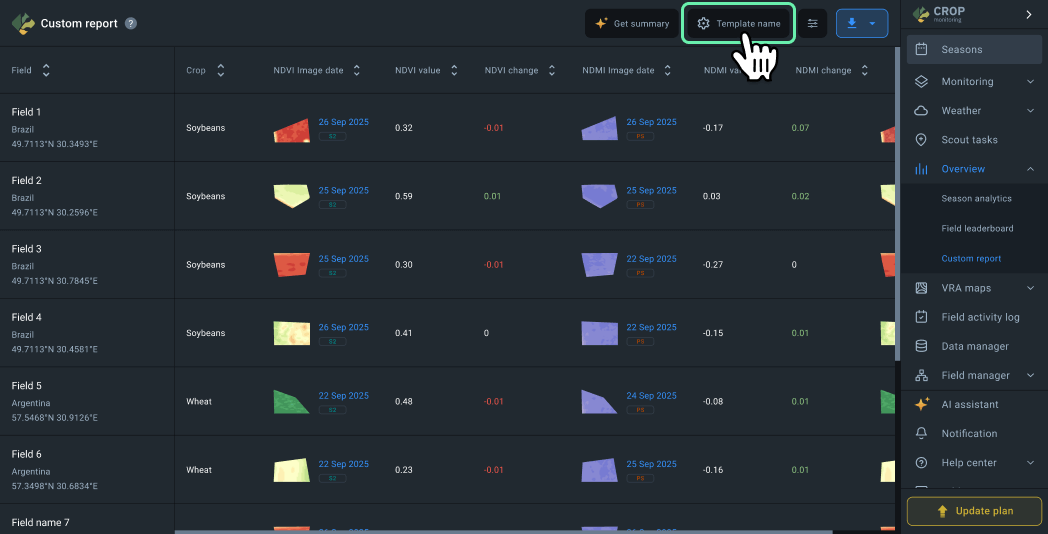
If you’ve already created a template, you can create new ones for other requests.
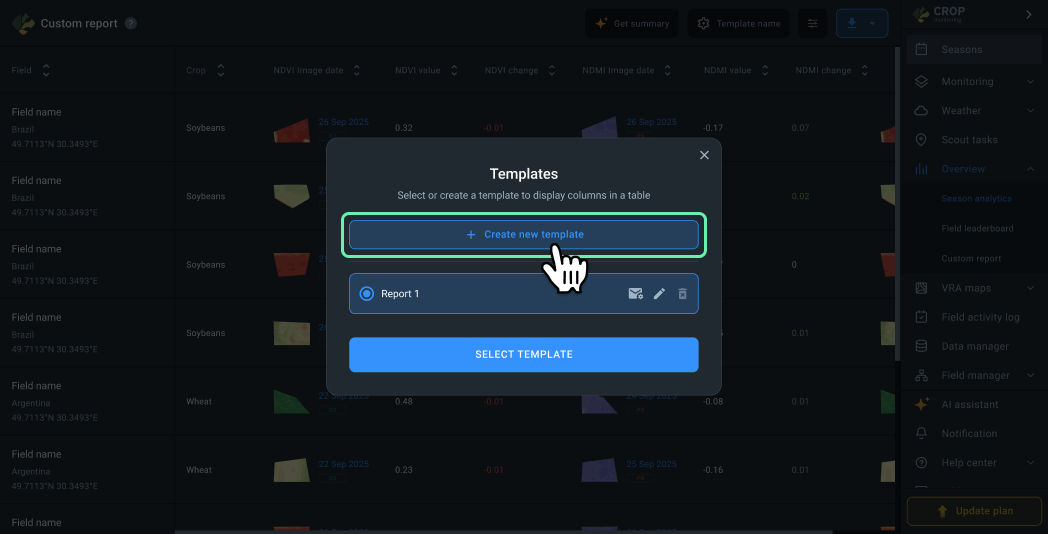
- Click the name of the currently selected template to open the template management menu.
- Click the “Create new template” button.
- In the template creation window, you can enter a custom name for your report.
- Below, you’ll find the complete list of available columns for the report.

- You can rearrange the column order as needed.
- You can hide unnecessary columns to monitor only the information you need. Please note that the Field and Crop columns have a fixed order and cannot be hidden.
- When you click the “Save” button, changes are saved to the template, and data processing for the selected columns begins. Depending on the data volume, processing may take anywhere from a few seconds to an hour.


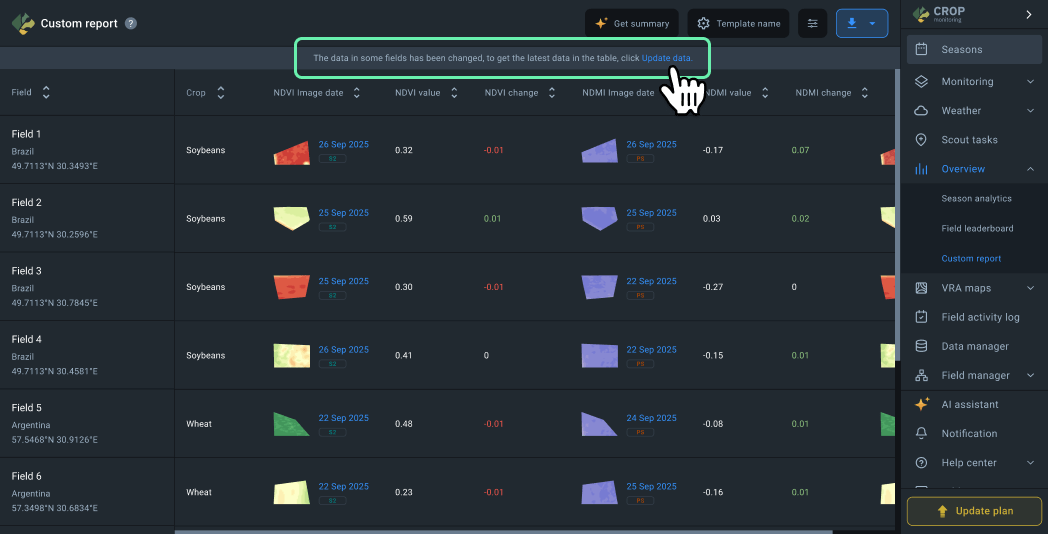
Updating an existing template
Over time, your report data may become outdated. You’ll see a notification at the top of the report when this happens. To update the data, click the “Update data” button. Depending on the data volume, processing may take anywhere from a few seconds to an hour.
Editing an existing template
If you need to edit an existing template, click the “Edit” button. The steps for editing are the same as for creating a report.
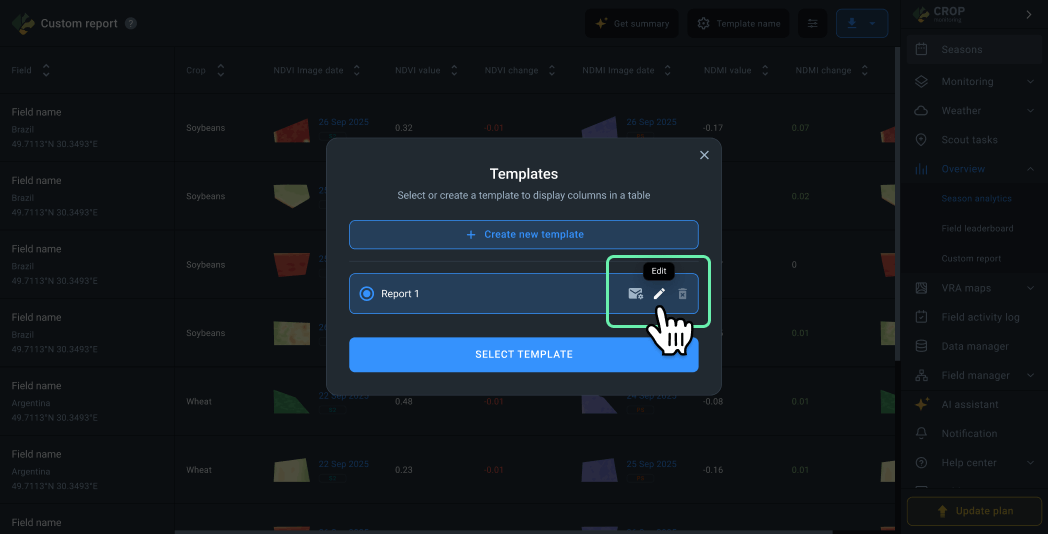
Deleting a template
To delete unnecessary templates, click the “Delete” button and confirm the action. Please note that once deleted, the report cannot be restored.
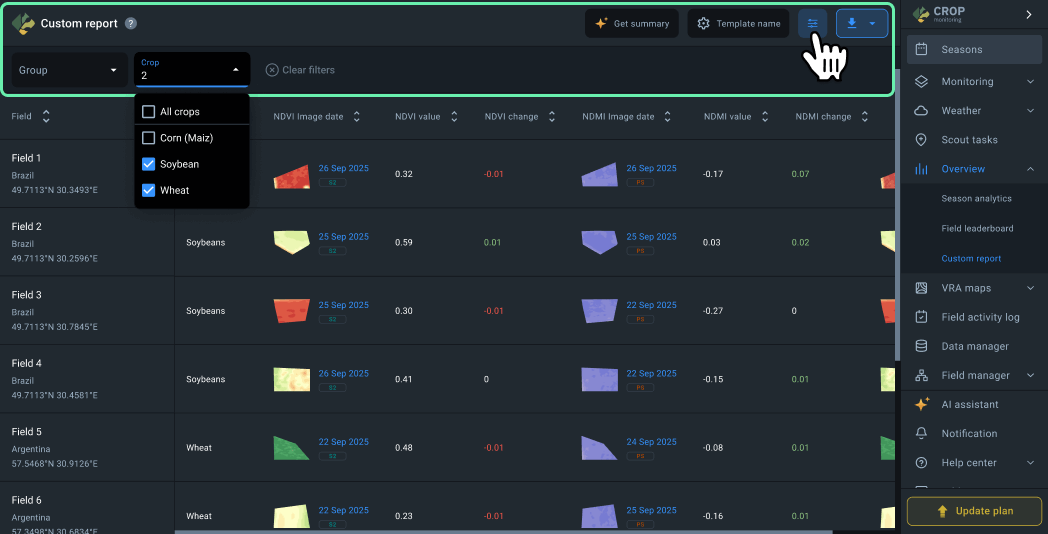
Filtering data
You can filter data in the table by crops and field groups if needed. Click the filtering button on top of the page to access the filter panel with available options.
Data available in Custom report
- Crop rotation information:
- Crop
- Maturity
- Variety
- Sowing / Planting date
- Harvesting date
- Target yield t/ha
- Actual yield t/ha
- Field information:
- Filed name
- Field group
- Area
- Tillage type
- Irrigation type
- Indices’ data is available for NDVI, NDRE, MSAVI, RECl, and NDMI:
- Date of the last image
- Index value of the last image
- Index value change to the previous image
- NDVI values split
- Yield estimation is available as an add-on and relevant only for some crops:
- Dry biomass estimation, tons
- Dry biomass estimation, t/ha
- Dry yield estimation, tons
- Dry yield estimation, t/ha
- Wet yield estimation, tons
- Wet yield estimation, t/ha
- Recommended harvesting date
- Current risks forecast threats that are likely to influence yields. Some risks go as add-ons and are relevant only for some crops:
- Index risk
- Disease risk
- Cold stress risk
- Hot stress risk
- Rainfall risk
- Wind risk