Monitoring
Image sources
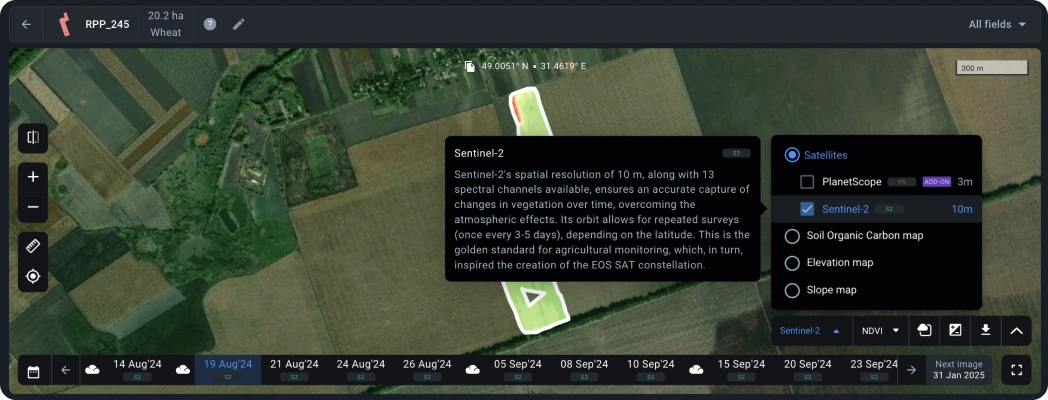
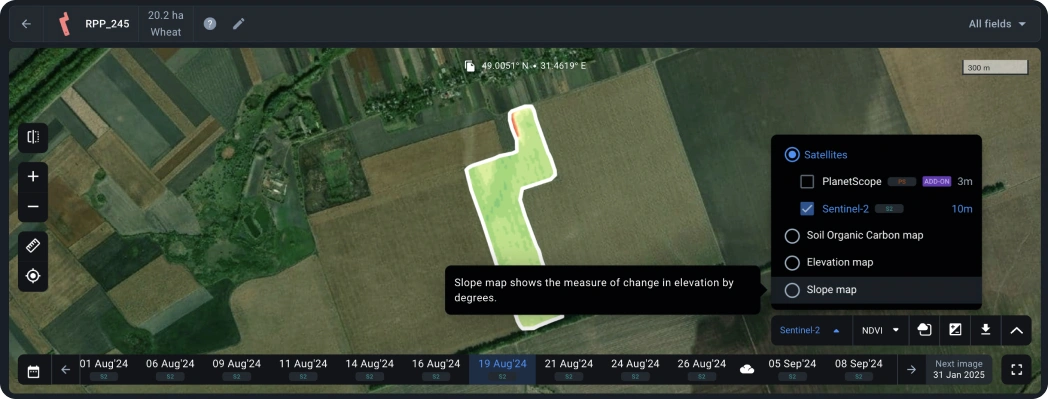
Currently, we use Sentinel-2 satellite images with a 10-meter resolution. In addition, you can connect daily PlanetScope images with a resolution of 3 meters. For both systems, you can adjust the threshold for cloud and shadow coverage. Thus, the collected statistics include a representative selection and exclude external factors as much as possible, but sometimes require visual verification using Natural Color.
Elevation map
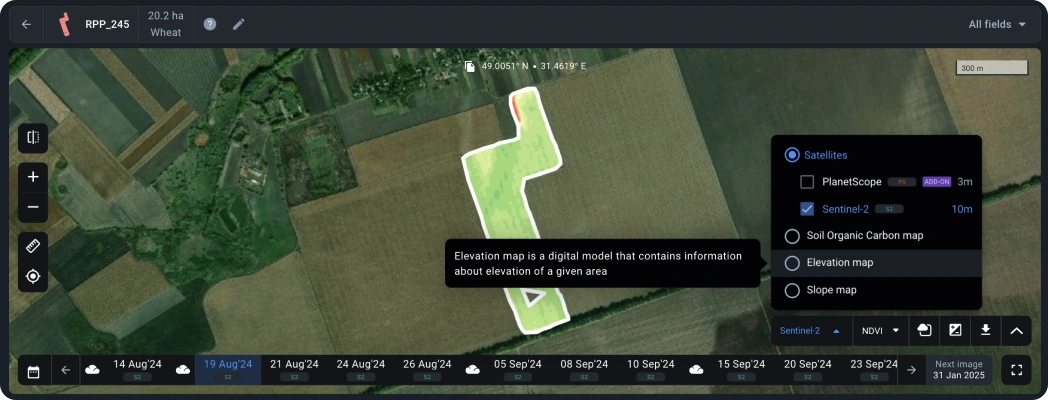
An elevation map is a digital model that displays elevation changes on your field. The model allows you to identify potentially problematic areas of the field, such as flood zones, areas of limited water access, soil erosion, etc.
Combined with other data (NDVI index, productivity map, etc.), the elevation map indicates factors that impede plant development and allows you to reduce their impact.
This model also enables you to determine the actual field size for more accurate calculation of seed, fuel and lubricants costs and time spent on field treatment.
How to find a field elevation map
By default, only the NDVI values of your field are displayed on the map. To see elevation differences, click on the panel with the name of the satellite (Sentinel 2) and select the elevation map from the drop-down list.
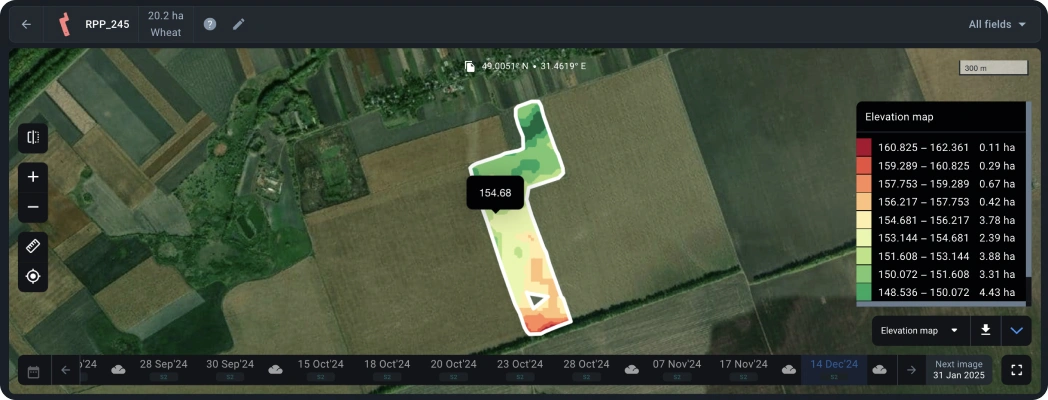
Visually, the elevation difference looks like a difference in shades, from dark green lowlands to dark red highlands. In addition, by hovering the cursor across the map, you can see the actual elevation values (in meters) at any point in the field.
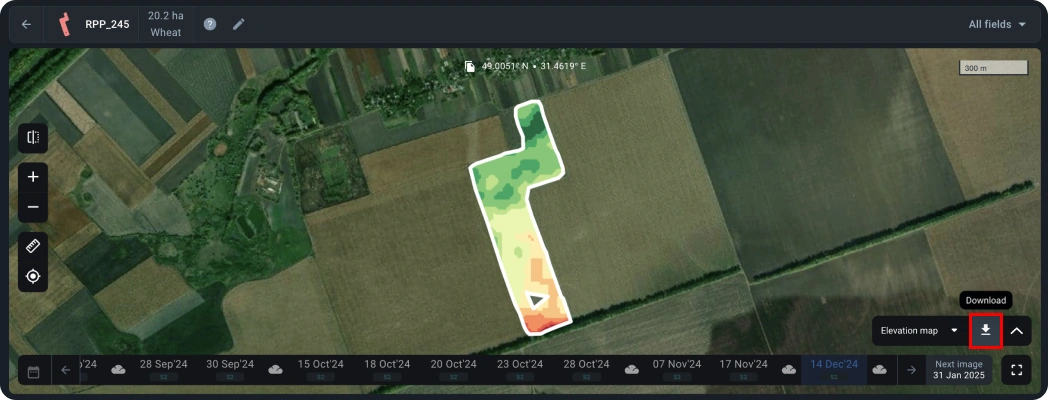
You can also download the elevation map in .tiff format by clicking on the download arrow icon in the panel in the lower right corner.
Slope map
The slope map characterizes the extent of elevation or decline of the terrain in degrees. Visually, the slope map looks like a difference in shades, from red steep slopes to dark green gentle slopes. You can find detailed color meanings in the legend.
Date line
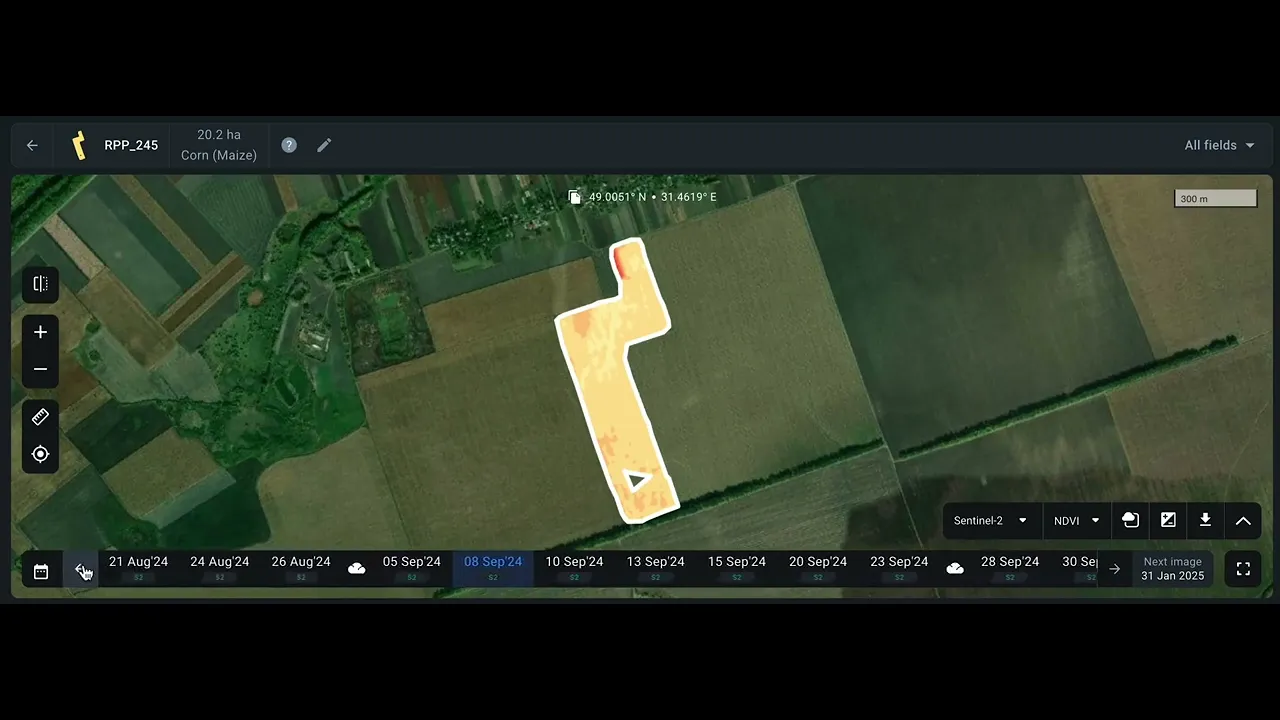
All images are displayed here. When you select a date, you’ll see a satellite image with an index applied to the image taken on the day you selected.
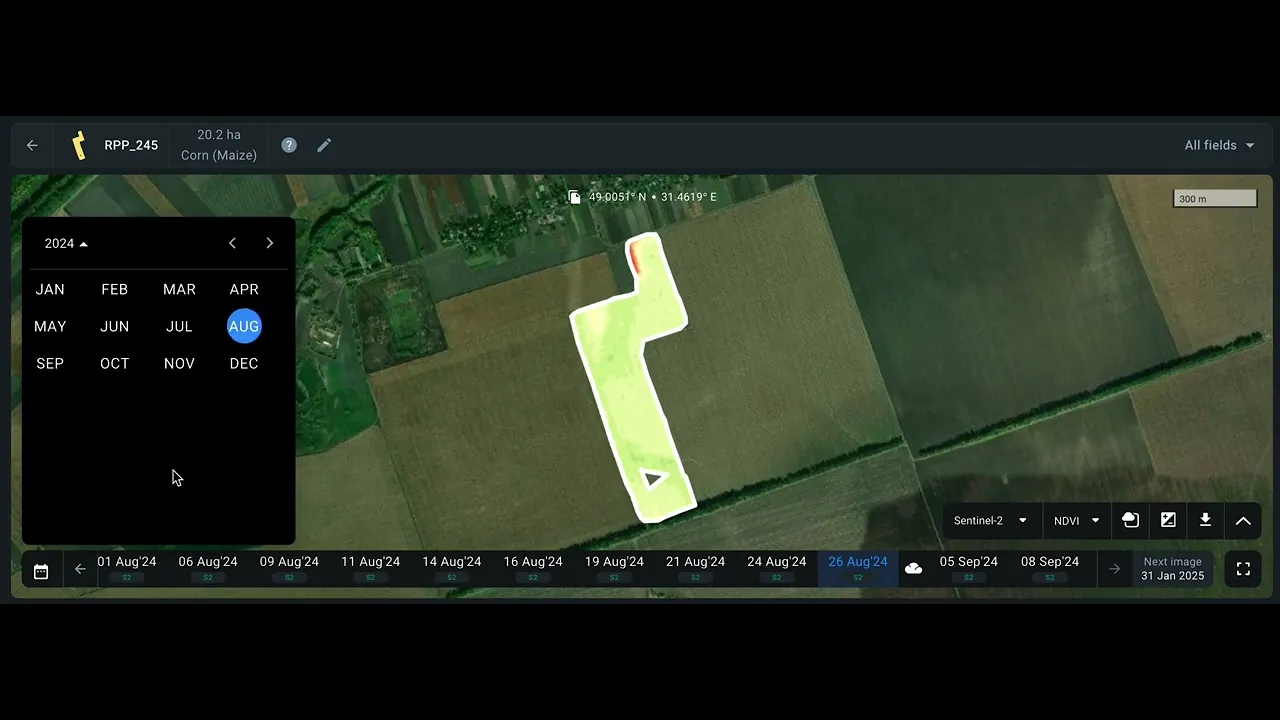
Satellite images for the last 3 months are available for free.
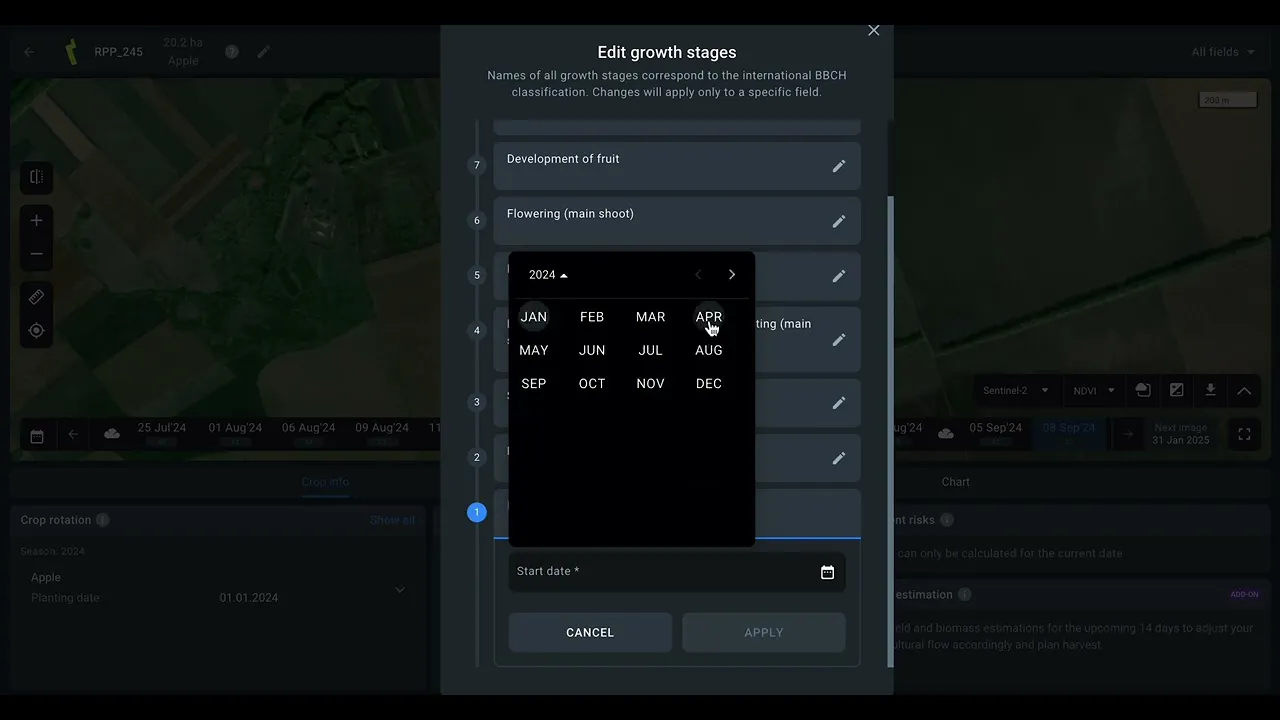
To select the desired year, click on the calendar icon.
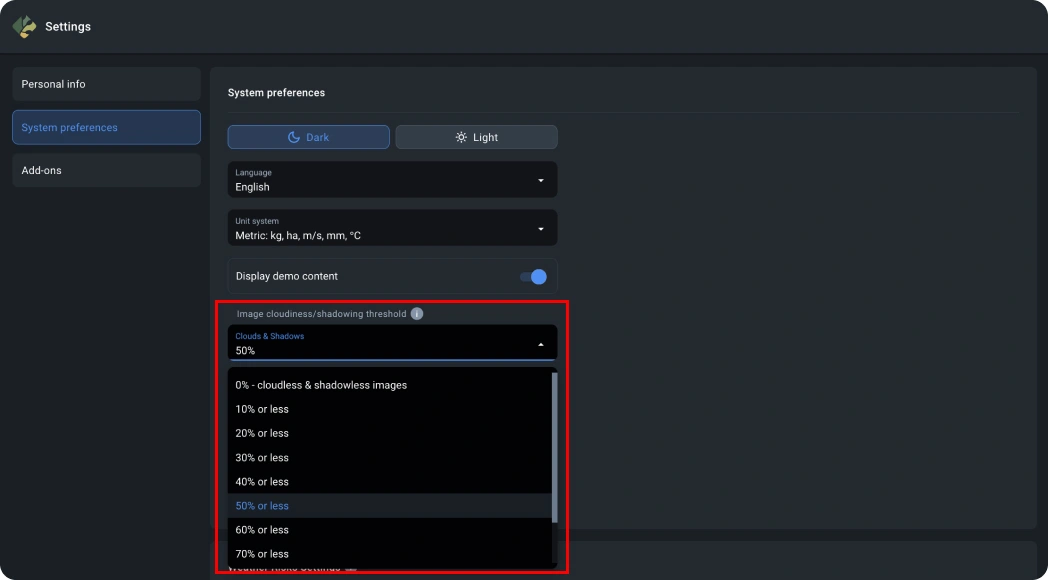
By default, only images with less than 50% cloud cover are displayed. You can change the cloudiness threshold in the account settings.
Crop info
The panel with information about the crop allows you to see the following data and analytics about the field:
- Crop rotation
- Growth stages
- Current risks
- Yield estimation (available as an add-on).
Crop rotation
The crop rotation block is empty by default and requires you to enter input data starting from a crop. Without this, it is impossible to calculate the stages of development, risks and perform yield estimation. The correct crop and sowing date affect the accuracy of results.
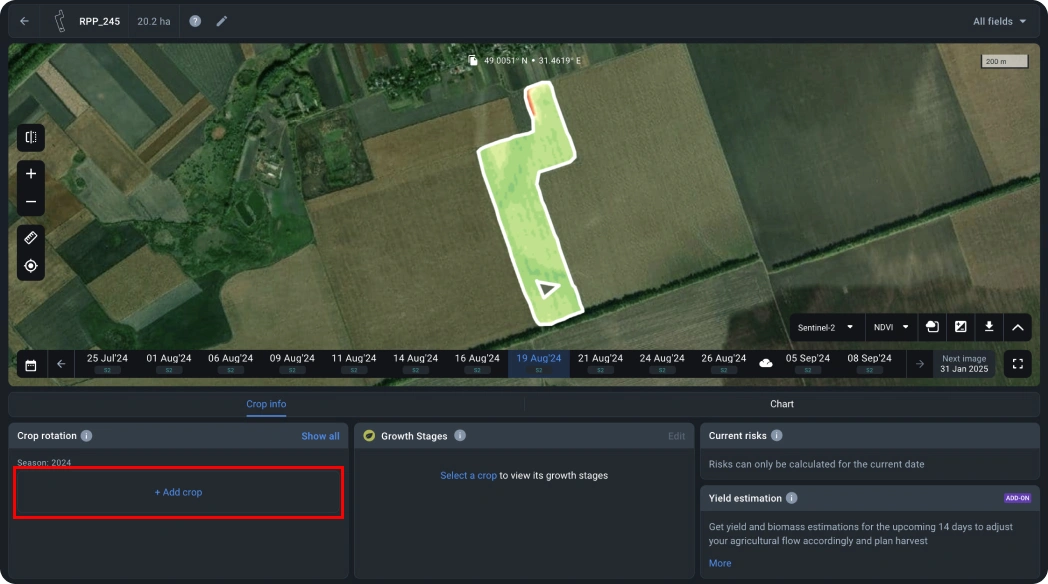
To start adding crops, click on the “+ Add crop” button.
Now this section will display general information about the crop(s) in this field within the season in which this field was added.
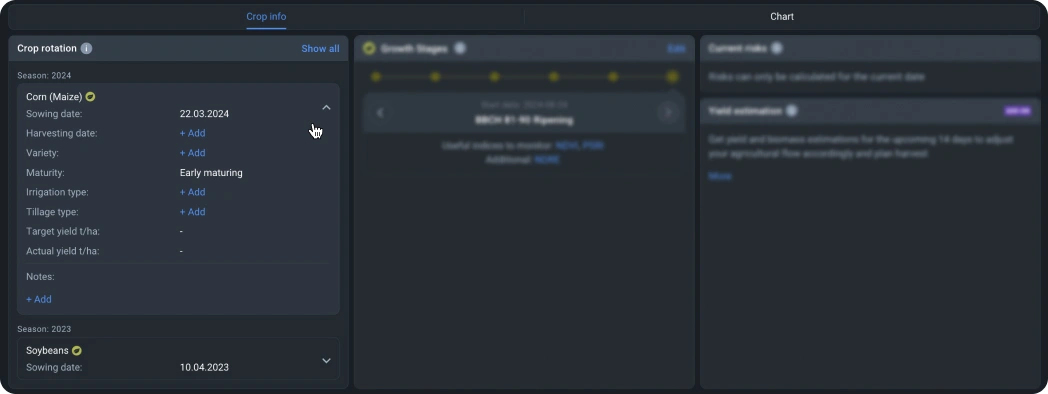
You can add several crops within the same season. To see information on a particular crop, select it with the radio button.
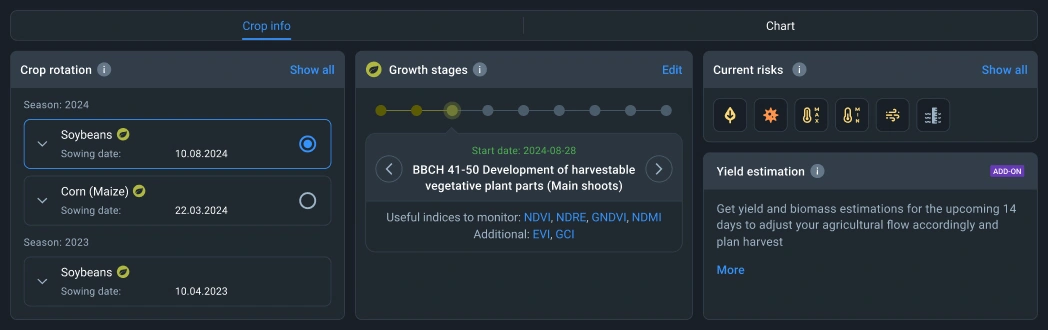
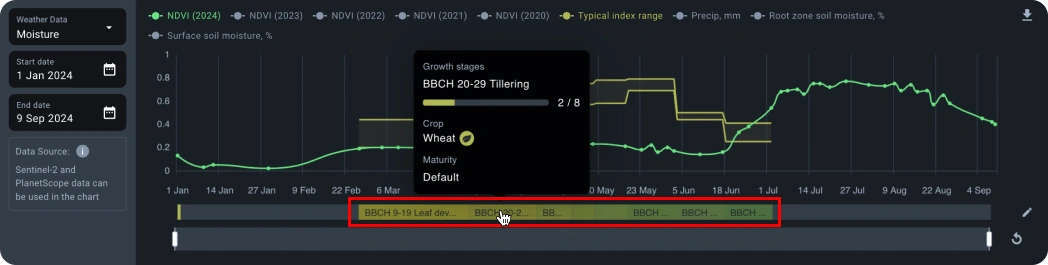
Growth stages
This feature is designed to determine the current growth stage of the crop according to the BBCH system to take this information into account when planning field work. You can also view the start date of a particular growth stage and switch between stages.
See which crops have available growth stages here.
To effectively monitor the condition of the field, it is important to keep in mind that each crop requires the use of specific indices at certain stages of its development. On the platform, these indices are divided into recommended and additional indices.
The recommended indices are the result of in-depth research and have been confirmed as the most informative for specific crops and stages of development. They provide high accuracy and reliability in identifying key parameters of plant condition.
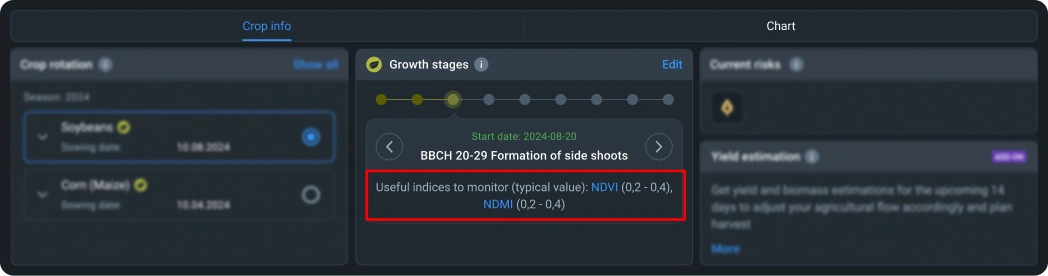
Additional indices, although also based on research, have less clear-cut results. Their use is often limited to more general analysis or serves as an additional tool to verify the data obtained with the recommended indices.
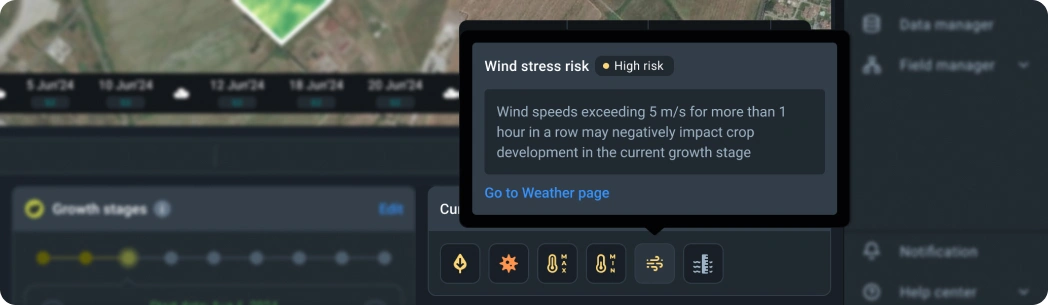
Risks
To use the Current risks feature, you need to select an Essential or Professional plan.
Each risk may have a different level of probability:
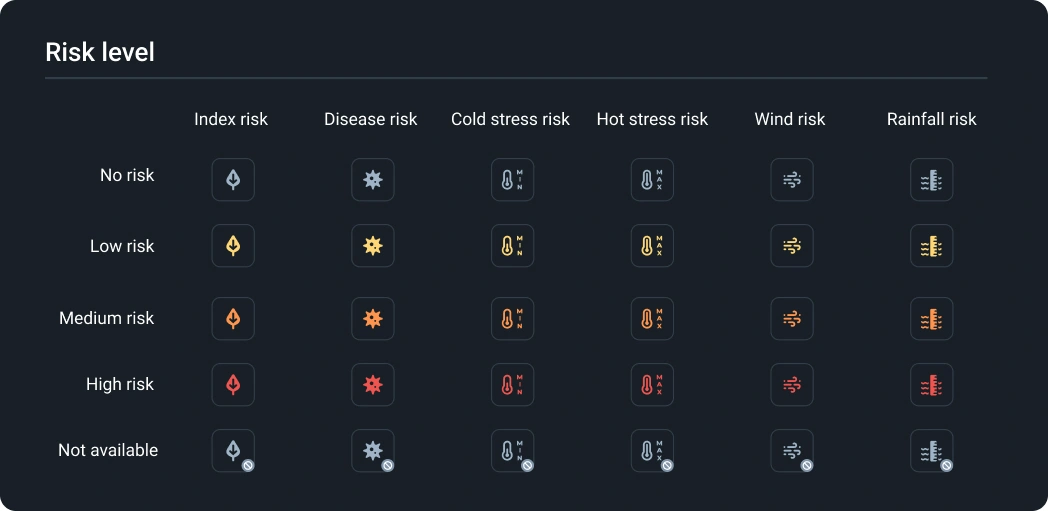
To expand the full information about a risk, click on the icon of the risk you are interested in.
Charts
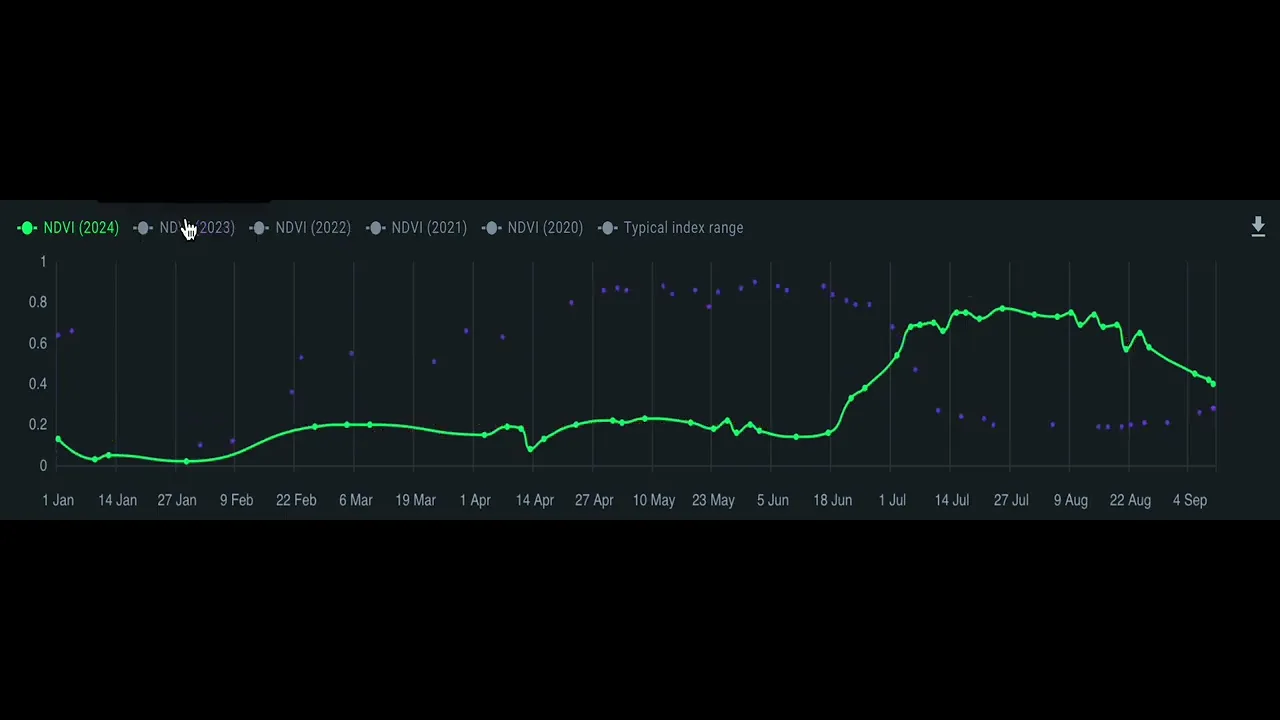
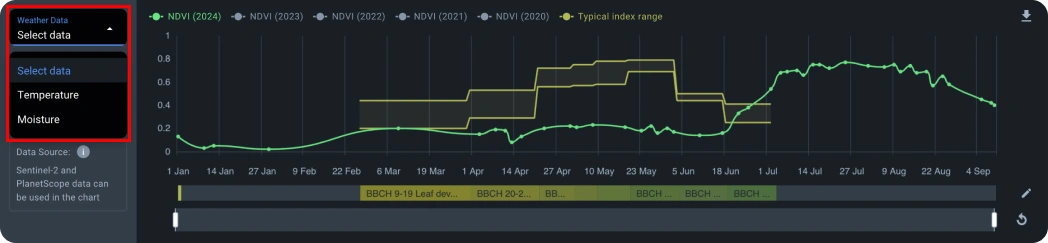
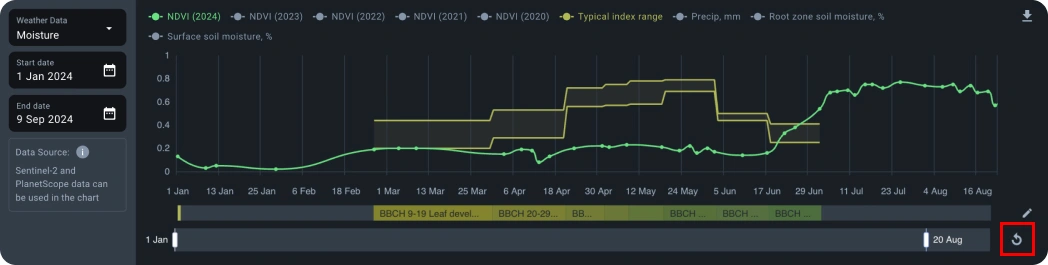
Charts show the dynamics of changes in the values of the selected index.
Vegetation indices
Each curve can be disabled by clicking the corresponding colored buttons on the legend. This allows you to eliminate unnecessary elements and compare values by the years of interest.
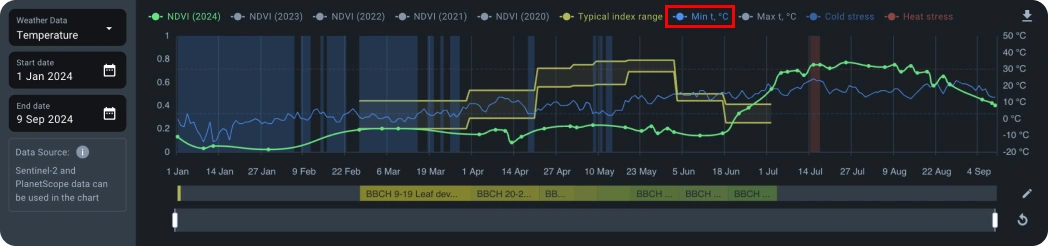
Weather chart
To display weather data on a graph, select the corresponding data type from the drop-down list.
Data in “Temperature” section:
- Minimum/Maximum temperature in degrees Celsius
- Threat of Cold/Heat stress
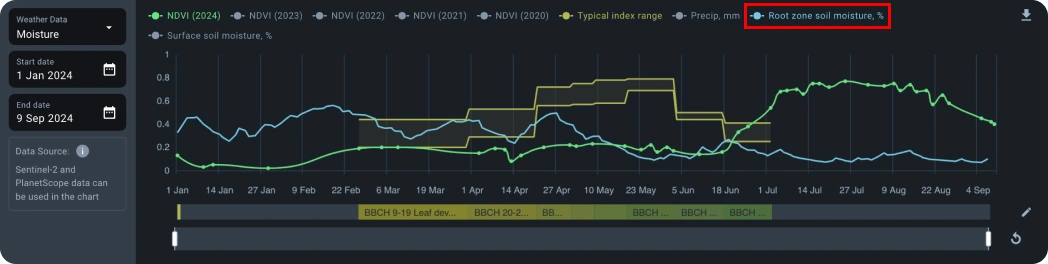
Data in ”Moisture” section:
- Precipitation in mm
- Root zone moisture
- Soil surface moisture in %.
Temperature
The minimum temperature curve shows the history of minimum temperatures in the field over a certain period. Keep an eye on this curve and take relevant plant protection measures in time. When the curve crosses the “Threat of cold” mark (-6°C), your plants are in danger: they can be damaged or even die. Study the temperature trends in the field based on this graph to better protect your plants.
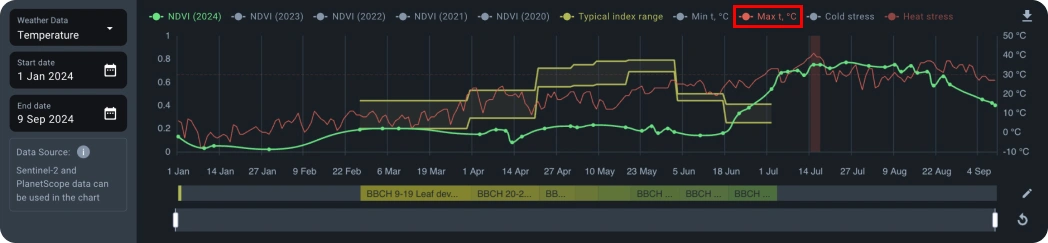
The maximum temperature curve shows the history of maximum temperatures in the field over a certain period. Keep an eye on this curve and take relevant plant protection measures in a timely manner. When it crosses the “Heat stress” mark (+30°C), your plants are most likely experiencing drought. Study the temperature trends in the field based on this graph to better protect your plants.
Moisture
The precipitation graph shows the history of precipitation on the field in mm. Study rainfall trends based on this graph and plan irrigation and fertilization more efficiently and effectively.
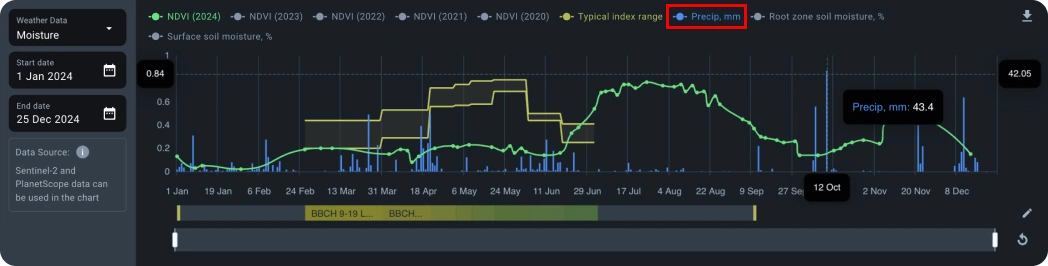
The soil surface moisture curve shows the change in the amount of water in the top layer of soil, several centimeters deep, over a certain period. This data will help you to carry out irrigation work more efficiently.
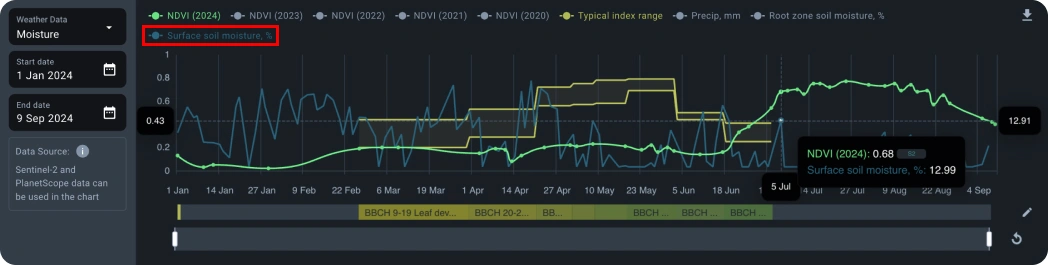
The root zone moisture curve shows the change in the amount of moisture required by the roots of plants. Optimize your water use by making decisions based on this graph.
Growth stages
Use the growth stages to find out what stage your crop is currently at.
Period intervals
By default, the period of one year or the date range selected in the calendar is displayed.
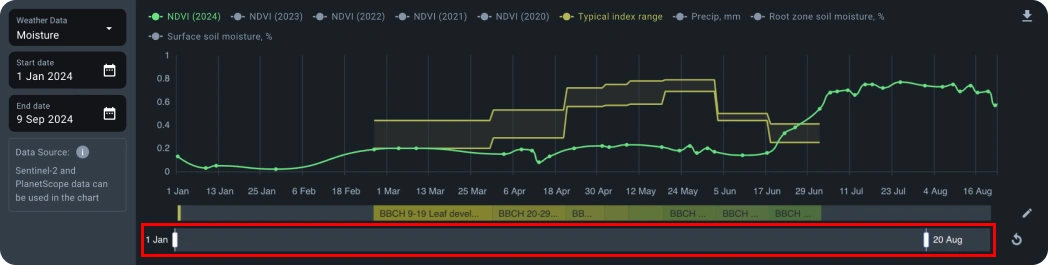
If you have customized the date range and want to get the default annual overview, click Update.
Indices
By default, the date line displays images based on the NDVI index. You can select a different index from the drop-down list.
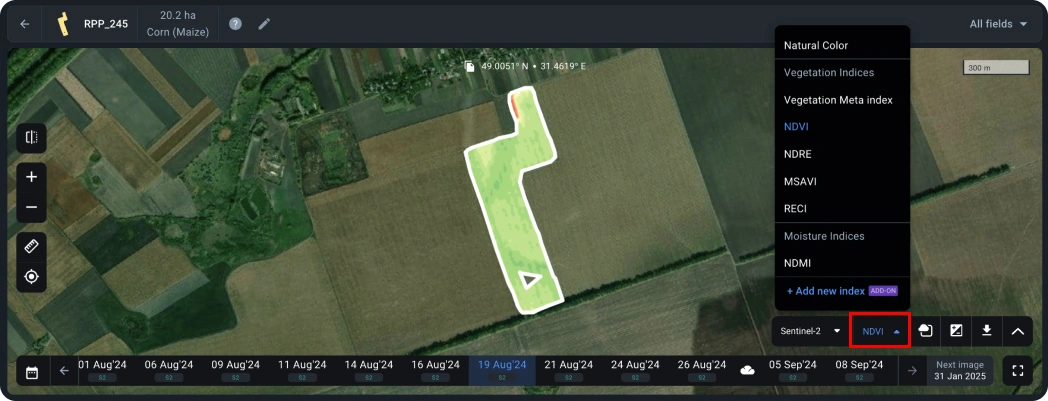
Below are the most commonly used vegetation indices that are presented in monitoring feature.
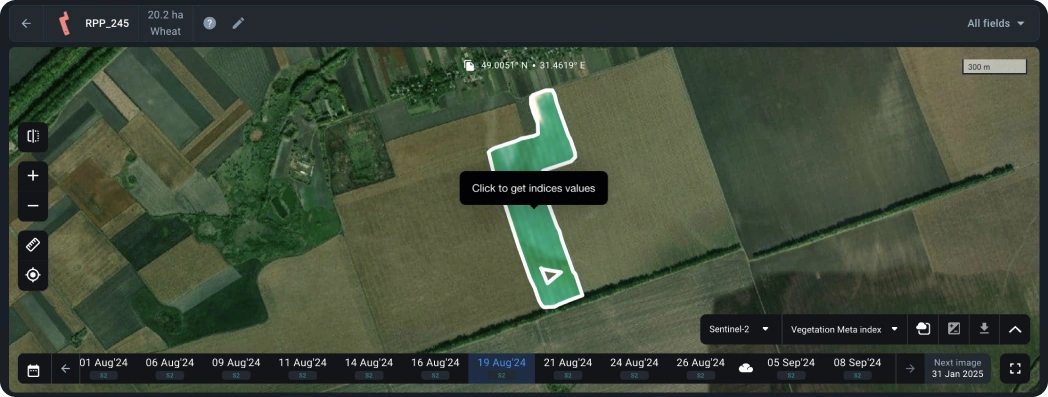
VMI or Vegetation Meta index
The Vegetation Meta Index is a composite index based on the RGB model, where Red corresponds to MSAVI, Green to NDRE, and Blue to NDVI. Each of these defined indices is more effective at different stages of plant development. When combined into an RGB composite, the influence of each index is characterized by a change in color, allowing for visual determination of the state of the corresponding crop in the image. Importantly, the color scheme remains consistent regardless of crop type, region, or time of capture, as it is constructed based on the absolute values of the indices. This index is developed by the EOSDA science team and it is in the initial development stage. The legend for this index will be developed and improved over time.
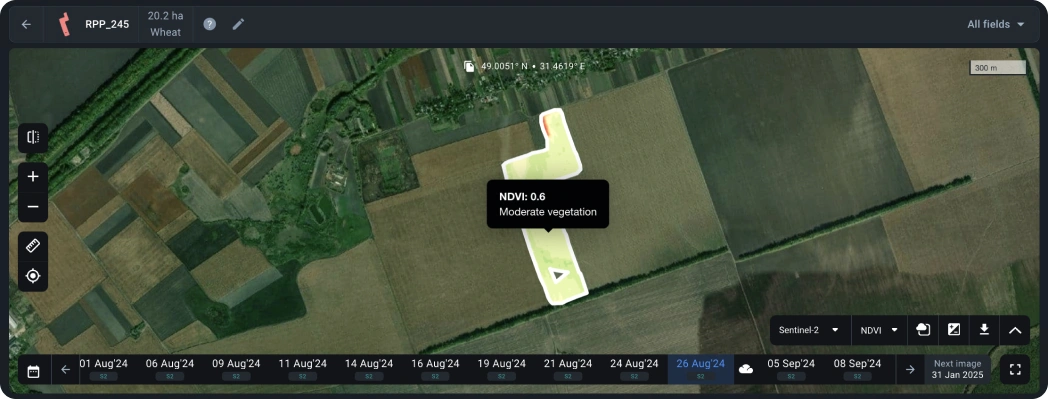
NDVI or Normalized Difference Vegetation Index
NDVI is calculated according to the way a plant reflects and absorbs solar radiation at different wavelengths. The index allows for identification of problem areas of the field at different stages of plant growth for timely response. Pay attention to the areas where NDVI values differ considerably.
For example, the areas of a field that have an extremely low NDVI rate may indicate problems with pests or plant diseases; and the areas with an abnormally high NDVI signalize the occurrence of weeds.
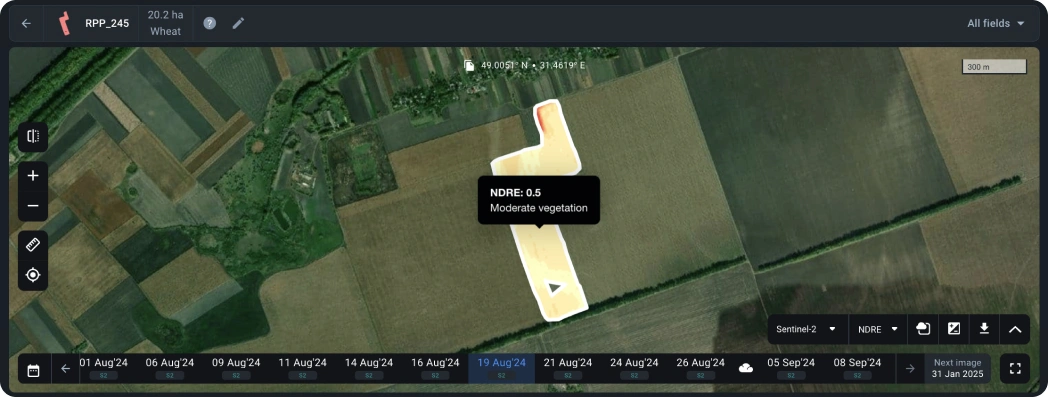
NDRE or Normalized Difference RedEdge*
NDRE is an indicator of photosynthetic activity of a vegetation cover used to estimate nitrogen concentrations in plant leaves in the middle and at the end of a season. It allows you to detect the oppressed and aging vegetation and is used to identify plant diseases. It also makes it possible to optimize the timing of the harvest.
*The red-edge band is a narrow band in the vegetation reflectance spectrum between the transition of red to near infra-red.
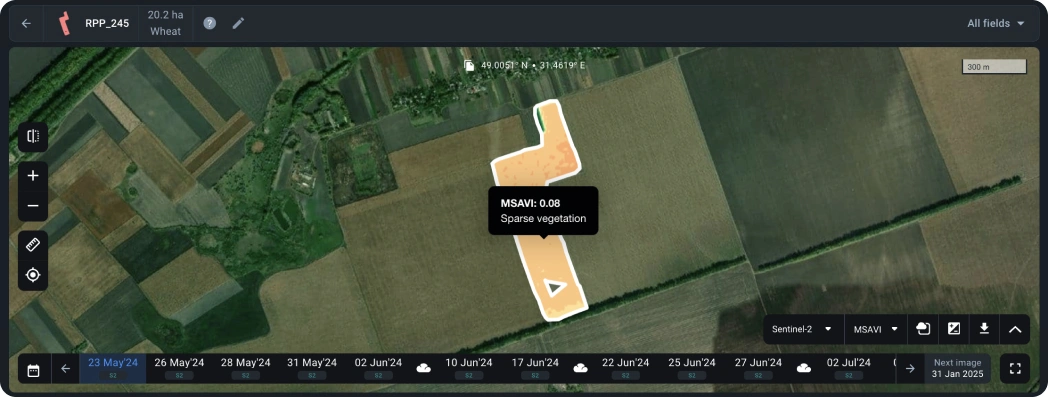
MSAVI or Modified Soil-Adjusted Vegetation Index
MSAVI allows you to determine the presence of vegetation in the early stages of emergence when there is a lot of bare soil. The index minimizes the effect of bare soil on the display of vegetation maps. Based on the index, you can build maps for differential fertilizer application in the early stages of crop growth.
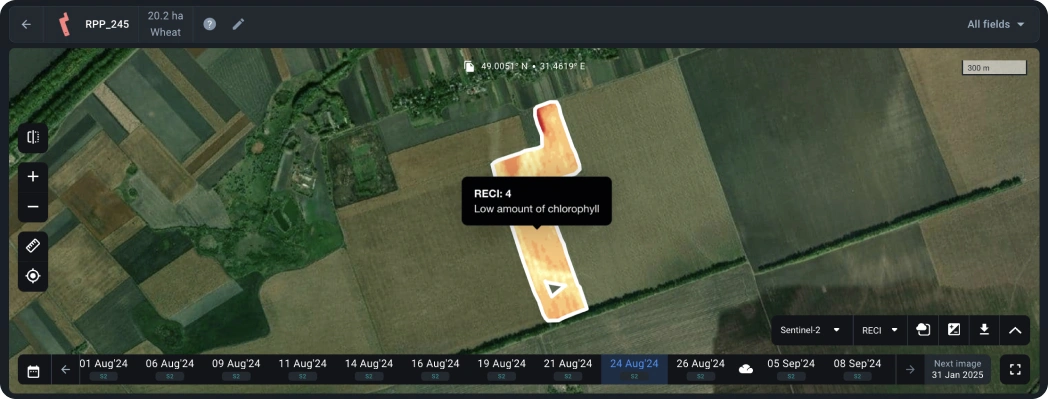
ReCI or Red-edge Chlorophyll Index
ReCI is an index of photosynthetic activity of a vegetative cover, sensitive to the content of chlorophyll in leaves. Since the level of chlorophyll is directly related to the level of nitrogen in the crop, the index allows you to identify the areas of the field that have yellow or faded leaves, which may require additional fertilizer application.
Currently, one moisture index is also available on the platform:
NDMI or Normalized Difference Moisture Index
NDMI describes the crop’s water stress level and is calculated as the ratio between the difference and the sum of the refracted radiation in the near-infrared and SWIR spectrums. The interpretation of the absolute value of the NDMI makes it possible to immediately recognize the areas in which the farm or field is experiencing water stress. NDMI is easy to interpret: its values vary between -1 and 1, and each value corresponds to a different agronomic situation, independently of the crop.
You can also select the Natural color option to see the real image and make sure that clouds, haze, fog, and shadows from them have not affected the correctness of the field data.
If you don’t find the index you need in the list, please contact our support team to connect it.
Here are some indices that are already available in Add-ons.
GNDVI or Green Normalized Differential Vegetation Index
The Green Normalized Differential Vegetation Index is indispensable at late and intermediate stages of plant development. GNDVI index allows you to effectively assess the level of plant stress, soil moisture and nitrogen concentration in the leaves. Due to its sensitivity to chlorophyll, this index provides high-quality monitoring of crops, including aging or weakened vegetation.
EVI or Enhanced Vegetation Index
The Enhanced Vegetation Index is designed to correct for the effects of soil and atmospheric factors. It is more effective in regions with high biomass, such as tropical forests, where NDVI may be less accurate. EVI is also not recommended for use in mountainous areas due to the limited topographic effect.
SIPI or Structural Pigment Intensity Index
The Structural Pigment Intensity Index is ideal for analyzing canopy cover with a heterogeneous structure. It helps to estimate the ratio of carotenoids to chlorophyll, which allows you to detect early signs of stress or disease in plants.
ARVI or Atmosphere Resistant Vegetation Index
The Atmosphere Resistant Vegetation Index is designed to work in conditions of high aerosol content in the air, such as dust, smoke or rain. It is an ideal choice for monitoring crops in tropical regions and mountainous areas.
RENDVI Red Edge Normalized Differential Vegetation Index
The Red Edge Normalized Differential Vegetation Index is an advanced version of the NDVI that improves the accuracy of chlorophyll analysis. Particularly effective in the later stages of plant development, it allows you to take into account the area of leaf cover and its structure.
PSRI or Plant Senescence Index
The Plant Senescence Index is excellent for determining the processes of fruit ripening and leaf senescence. It allows you to accurately assess the level of chlorophyll and carotenoids in aging vegetation, providing early detection of stress.
GCI or Green Chlorophyll Index
The Green Chlorophyll Index is used to analyze the chlorophyll content, which allows to assess the physiological state of plants. This index is useful for monitoring the impact of seasonal changes and stress factors on vegetation.
NDYI Normalized Difference Yellow Index
NDYI is designed to detect yellow color in vegetation. It is used to monitor the flowering stage of crops such as rapeseed, sunflower and mustard, as well as to detect stress in cereals.
NRFI or Normalized Rapeseed Flowering Index
The NRFI specializes in determining the flowering stages of rapeseed and other yellow-flowering crops. This index is also useful for assessing the yellowing of plants under stressful conditions.
NDPI or Normalized Difference Phenology Index
The NDPI is the best tool for monitoring the early growth of winter crops after snowmelt. It is sensitive to spring vegetation activity.
CI or Custom Index
If you need a customized index for specific crops or climatic conditions, please contact us. We can help you implement your index formula, optimize thresholds, and ensure accurate data analysis.
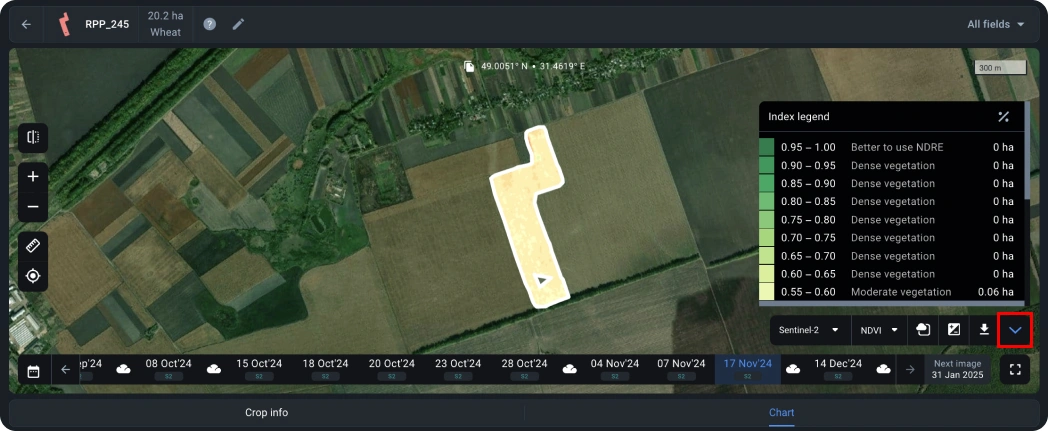
Details
To expand the details to check the index values of your field, use the panel above the analytics window. Values can be displayed in hectares or percentages and downloaded in XLS format.
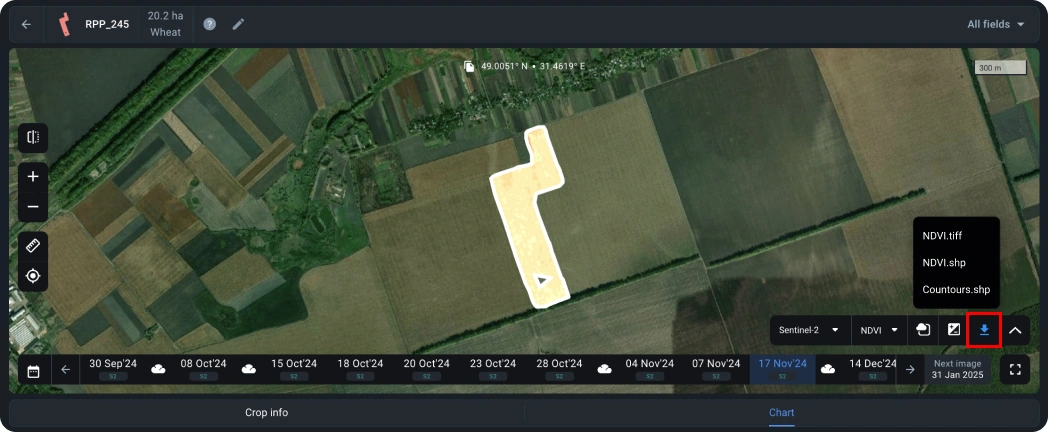
Download
Using the download button, you can download, for example, an NDVI map in .tiff or .shp formats or field contours. The Shape format shows you the NDVI value in pixels at each point, and the TIFF format shows you a normal image with NDVI applied.
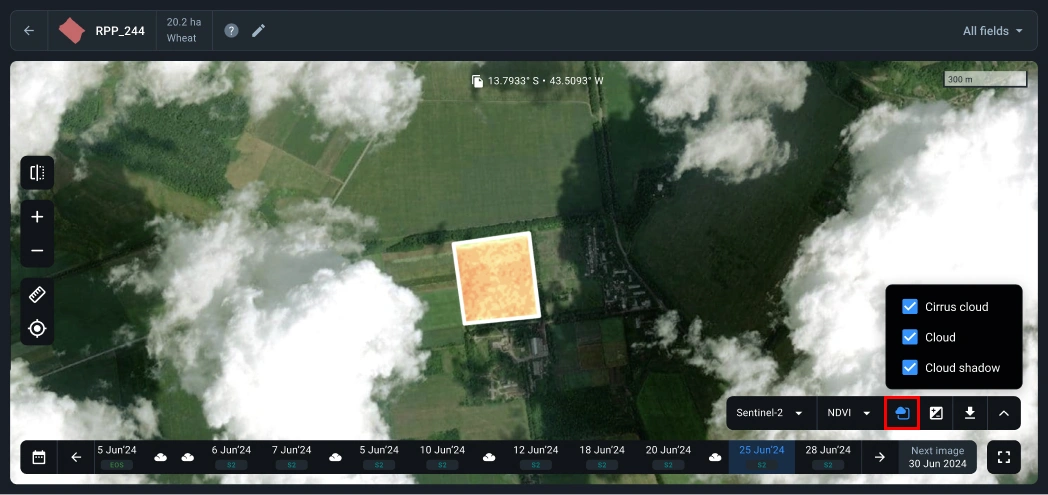
Mask filter
The mask filter allows you to recognize clouds, cirrus clouds, and cloud shadows in the image to take these phenomena into account when calculating the index values.
By default, all three masks are applied simultaneously. To disable one of them, uncheck the box next to it in the drop-down list.
Available features for crops
| Crop | Disease Risk | Growth Stages | Yield Estimation | Variety | Weather Risk | Recommended indices | Typical index range |
|---|---|---|---|---|---|---|---|
| U3 Bermuda Grass | |||||||
| Napier grass | |||||||
| Grapefruit | |||||||
| St. Augustine grass | |||||||
| Industrial Hemp | |||||||
| Einkorn wheat | |||||||
| Tomatillo | |||||||
| Olive | |||||||
| Ryegrass | |||||||
| Spring wheat | |||||||
| Sprout | |||||||
| Rapeseed | |||||||
| Crimson clover | |||||||
| Rice | |||||||
| Camelina | |||||||
| Grapes | |||||||
| Radish | |||||||
| Agave | |||||||
| Willow | |||||||
| Senna | |||||||
| Mullein | |||||||
| Mallow | |||||||
| Gotu Kola | |||||||
| Elder | |||||||
| Dandelion | |||||||
| L1F Zoysia Grass | |||||||
| Jamur Zoysia Grass | |||||||
| Areca nut | |||||||
| Lemons | |||||||
| Other | |||||||
| Apple | |||||||
| Fruit | |||||||
| Almonds | |||||||
| Nuts | |||||||
| Alfalfa | |||||||
| Citrus | |||||||
| Teak | |||||||
| Red Cabbage | |||||||
| Midiron Bermuda Grass | |||||||
| Naked oat | |||||||
| Oranges | |||||||
| Hungarian vetch | |||||||
| Avocado | |||||||
| Cushaw squash | |||||||
| Cupuasu | |||||||
| Zoysia Grass | |||||||
| Cocoa | |||||||
| Sunflower | |||||||
| Lady's mantle | |||||||
| Hibiscus | |||||||
| Hemp | |||||||
| Devil's claw | |||||||
| Belladonna | |||||||
| TifGrand Bermuda Grass | |||||||
| Kiwi | |||||||
| Pear | |||||||
| Pineapple | |||||||
| Vineyard | |||||||
| Watermelon | |||||||
| Coffee | |||||||
| Solidago | |||||||
| Rudbeckia | |||||||
| Rosehip | |||||||
| Moss | |||||||
| Passion flower | |||||||
| Narrowleaf Plantain | |||||||
| Triticale | |||||||
| Fodder beet | |||||||
| Green Cabbage | |||||||
| Acai palm | |||||||
| Cassava | |||||||
| Oil palm Elaeis guineensis | |||||||
| Eucalyptus | |||||||
| Bananas | |||||||
| Soybeans | |||||||
| Bermuda Grass | |||||||
| Oats | |||||||
| Guava | |||||||
| Turnip | |||||||
| Grass cover | |||||||
| Rosemary | |||||||
| Nasturtium | |||||||
| Moringa | |||||||
| Chamomile | |||||||
| Castor crop | |||||||
| Durian | |||||||
| Mango | |||||||
| Peach | |||||||
| Date palm | |||||||
| Turmeric | |||||||
| Yams | |||||||
| Plantain | |||||||
| Oil palm | |||||||
| Melon | |||||||
| Olive tree | |||||||
| Cashew | |||||||
| Cherry | |||||||
| Summer fallow | |||||||
| Pasture | |||||||
| Kola nut | |||||||
| Blackberry | |||||||
| Plum | |||||||
| Summer Squash | |||||||
| Spring pea | |||||||
| Peanuts | |||||||
| Mixed cereals | |||||||
| Sunbelt Bluegrass | |||||||
| Figs | |||||||
| Lemon Grass | |||||||
| Clover | |||||||
| Papaya | |||||||
| Hazelnut | |||||||
| Casuarina | |||||||
| Coconut | |||||||
| Table grapes | |||||||
| Pomegranate | |||||||
| Rose | |||||||
| Raspberry | |||||||
| Blueberry | |||||||
| Zeon Zoysia grass | |||||||
| Zenith Zoysia grass | |||||||
| TiWay Bermuda grass | |||||||
| TifTuf Bermuda grass | |||||||
| Fescue grass | |||||||
| Emerald Zoysia grass | |||||||
| Centipede grass | |||||||
| Bluegrass | |||||||
| Pistachio | |||||||
| Tangerine | |||||||
| Lazer Zoysia Grass | |||||||
| Potatoes | |||||||
| Butternut Squash | |||||||
| Winter pea | |||||||
| Rye | |||||||
| Cotton | |||||||
| Flax | |||||||
| Agave Cupreata | |||||||
| Blue agave | |||||||
| Bitter melon | |||||||
| Reed | |||||||
| Tea | |||||||
| Stadium Zoysia Grass | |||||||
| Southern Blue Bluegrass | |||||||
| Oil palm Hybrid OxG | |||||||
| Oil palm Elaeis Oleifera | |||||||
| Indian cress | |||||||
| Yellow woodsorrel | |||||||
| Rest area | |||||||
| Nolina | |||||||
| Mandarin | |||||||
| Meyer Zoysia grass | |||||||
| Celebration Bermuda grass | |||||||
| Walnuts | |||||||
| Field pea | |||||||
| Pigeonpea | |||||||
| Trinity Zoysia Grass | |||||||
| TifBlair Centipede Grass | |||||||
| Gum arabic | |||||||
| Milk thistle | |||||||
| Lychee | |||||||
| Rambutan | |||||||
| Passion fruit | |||||||
| Wheat | |||||||
| Prism Zoysia Grass | |||||||
| Primo Zoysia Grass | |||||||
| Agave salmiana | |||||||
| Pecan | |||||||
| Dragon fruit | |||||||
| Rubber | |||||||
| Corn (Maize) | |||||||
| Sugar beet | |||||||
| Peas | |||||||
| Pulses | |||||||
| Tobacco | |||||||
| Tuber crops | |||||||
| Sugarcane | |||||||
| Canola | |||||||
| Vegetables | |||||||
| Beans | |||||||
| Spice | |||||||
| Oilseed crops | |||||||
| Spring cereals | |||||||
| Spring barley | |||||||
| Winter rapeseed | |||||||
| Winter barley | |||||||
| Spring rapeseed | |||||||
| Winter cereals | |||||||
| Sorghum | |||||||
| Winter sorghum | |||||||
| Winter wheat | |||||||
| Cereal | |||||||
| Buckwheat | |||||||
| Poppy seed | |||||||
| Sesame | |||||||
| Millet | |||||||
| Ginger | |||||||
| Lettuce | |||||||
| Endive | |||||||
| Garlic | |||||||
| Onions | |||||||
| Chilli | |||||||
| Sage | |||||||
| Paprika | |||||||
| Pepper | |||||||
| Cucumber | |||||||
| Lavender | |||||||
| Mint | |||||||
| Cumin | |||||||
| Tomatoes | |||||||
| Fababean | |||||||
| Mungbean | |||||||
| Chickpea | |||||||
| Cowpea | |||||||
| Sweet potato | |||||||
| Groundnut | |||||||
| Lentils | |||||||
| Carrot | |||||||
| Asparagus | |||||||
| Mustard | |||||||
| Strawberry | |||||||
| Green beans | |||||||
| Okra | |||||||
| Broccoli | |||||||
| Cauliflower | |||||||
| Snap Peas | |||||||
| Triticosecale | |||||||
| Sorghum sudanense | |||||||
| Anise | |||||||
| Artichoke | |||||||
| Blessed thistle | |||||||
| Calendula | |||||||
| Caraway | |||||||
| Coriander | |||||||
| Echinacea | |||||||
| Fennel Bitter | |||||||
| Fennel Sweet | |||||||
| Feverfew | |||||||
| Hyssop | |||||||
| Lemon Balm | |||||||
| Lemon Thyme | |||||||
| Lemon Verbena | |||||||
| Lucerne | |||||||
| Peppermint | |||||||
| Red clover | |||||||
| Roseroot | |||||||
| Safflower | |||||||
| Spearmint | |||||||
| St. John's wort | |||||||
| Stinging nettle | |||||||
| Stevia | |||||||
| Thyme | |||||||
| Valerian | |||||||
| Vervain | |||||||
| Yarrow | |||||||
| Celery | |||||||
| Kale | |||||||
| Radicchio | |||||||
| Eggplant | |||||||
| Forage Grass | |||||||
| Chia | |||||||
| Romaine lettuce | |||||||
| Cranberry | |||||||
| Iceberg lettuce | |||||||
| Winter triticale | |||||||
| Winter rye | |||||||
| Spring triticale | |||||||
| Sainfoin | |||||||
| Silage corn (Maize) | |||||||
| Silage sorghum | |||||||
| Becva festulolium | |||||||
| Basil | |||||||
| Chard | |||||||
| Cranberry bean | |||||||
| Black kale | |||||||
| Romanesco broccoli | |||||||
| Chicory | |||||||
| Broccoli rabe | |||||||
| Parsley | |||||||
| Spinach | |||||||
| Savoy cabbage | |||||||
| Zucchini | |||||||
| Pumpkin | |||||||
| Shallot | |||||||
| Brussels sprout | |||||||
| Guar beans | |||||||
| White lupin |