The UAE is one of the fastest-growing construction markets in the world, and keeping accurate records of what is being built and where is a real operational challenge. A local industrial development authority was struggling to stay current across its sites using periodic ground inspections. EOSDA built a satellite monitoring workflow that gave them a continuous, plot-level view of active development areas.
Case Highlights
Challenge
A UAE infrastructure authority struggled to monitor industrial sites where manual inspections were too slow, expensive, and prone to data gaps.
Solution
EOS Data Analytics used a satellite-based approach to accurately map PAD areas and flag construction activity and structural changes over time.
Outcome
The client gained continuous visibility over development zones, allowing them to verify construction progress remotely and reduce the need for costly field visits.
Overview: Rapid planned area development in the UAE
The United Arab Emirates is growing very fast, particularly in major hubs like Dubai and Abu Dhabi. Official strategies, such as the Dubai 2040 Urban Master Plan, aim to double the city’s space for hospitality and tourism activities over the next 15 years . Rapid city development is evident in historical data; for example, Abu Dhabi’s built-up area surged from just 54 square kilometers in 1975 to over 750 square kilometers by 2019 .
Such intense large-scale growth requires constant monitoring of planned area development (PAD) zones. Without precise tracking, cities risk outgrowing their essential services and failing to meet sustainability goals. On a local level, individual developers must also conduct their own monitoring to align with the broader urban vision.
Satellite monitoring allows tracking construction scalably and maintaining an up-to-date view of PAD areas. Using medium-resolution images for frequent updates and high-resolution satellite images for checking details helps ensure the data is accurate. This supports evidence-based policy-making and reporting, so that planners and developers move forward in sync.
Challenge: Inefficiency and data gaps of manual site monitoring
A UAE-based infrastructure planning and development authority needed a better system to track progress across its industrial zones. These sites are essential for oil and gas operations, but the authority found that manual monitoring could not keep up with the scale and speed of the work:
- Areas are too large to cover. The monitoring areas are massive and spread out across the desert. Sending teams to inspect every single plot is slow, expensive, and they often miss important changes.
- Too much time between updates. Construction moves very fast, but ground teams only visit every few weeks or months. This creates a blind spot. Often, by the time an inspector sees a problem, the construction has moved so much further that the problem is extremely hard to fix.
- No neutral evidence. Reports from the ground are based on what a person sees, which can be fragmented and subjective. For effective planning, the authority requires a single source of truth that provides the same level of detail for every plot. Objective, geo-tagged evidence is necessary to accurately track construction progress and ensure that the development follows the official master plan.
With hundreds of kilometers to cover and zero room for error, the authority realized that the only way to get a full, objective picture was to change their perspective. They needed a scalable, high-tech solution that could work around the clock.
Solution: Satellite-powered monitoring and change detection
EOSDA used a satellite-based approach to give the UAE client a bird’s-eye view of their industrial sites. By comparing images from different months, they could track development progress without anyone having to set foot in the extreme heat.
Here is how the methodology worked:
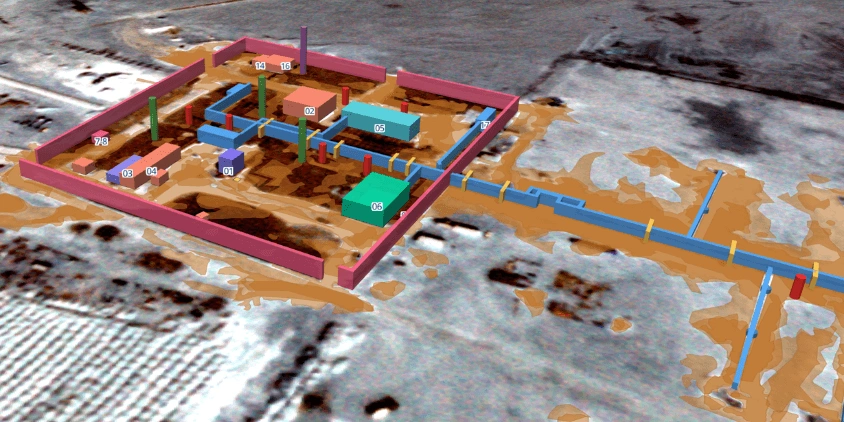
- Mapping the area. First, we defined the boundaries of the PAD areas and broke them down into smaller segments based on client permit zones and high-activity clusters. This made it easier to track changes plot-by-plot without missing anything.
- Analyzing the images. Then, the EOSDA team analyzed high-resolution cloud-free satellite images from different periods. We looked specifically for new construction activity, infrastructure expansion, land clearing and earthworks, and structural changes.
- Detecting changes. By running images through our dedicated change-detection algorithms, the team could accurately spot the exact changes — like new fences or bare soil patches. This removed the guesswork that comes with fragmentary manual inspections.
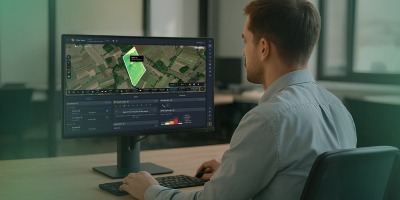
Finally, EOSDA put all this information into dynamic maps. Instead of stacks of paperwork, the client now has a user-friendly interface that does the hard work for them. It highlights every change with color-coded overlays that are easy to read and provides important metrics, such as the pipeline length or earthwork area. These maps and reports allowed stakeholders to quickly check the progress of any site and keep up with the situation.
We wanted the client to understand the situation at a glance, so we turned complex analysis into simple maps with color-coded markers. Now, any stakeholder can open the interface and instantly see exactly where new infrastructure has appeared.


Outcome: Enhanced visibility and streamlined project oversight
EOSDA’s satellite-powered solution helped our UAE client keep a constant eye on their development zones. By spotting new construction and land changes early, the client can react much faster to what is happening on the ground. This move to digital monitoring made the whole process of watching over infrastructure simpler and more reliable.
The practical results for our UAE client include:
- Spotting changes early. The client can now identify new buildings or ground disturbances as soon as they happen.
- Easier progress checks. It is much simpler to verify how work is moving along across different sites.
- Saving money. The client no longer needs to rely as much on expensive and time-consuming site visits.
- Streamlined oversight. Planning and following regulations became easier because the data is always up to date.
EOSDA’s satellite-powered solution helps everyone work from the same set of facts for better policy-making and clearer communication. In the future, this same scalable approach can be applied to any new PAD area. It ensures that no matter how fast the development expands, our client stays in total control.
Turn high-tech satellite data into actionable solutions for your business.
More news
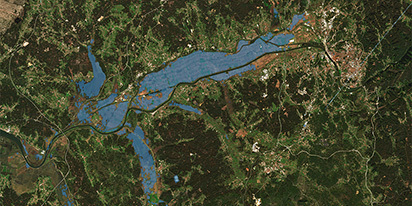
Validating satellite tech for flood analysis and damage mapping in Coimbra
Can satellites improve disaster response? We explored this in the Coimbra district, showing how integrated satellite intelligence can assess flood impacts and fill critical data gaps during a crisis.
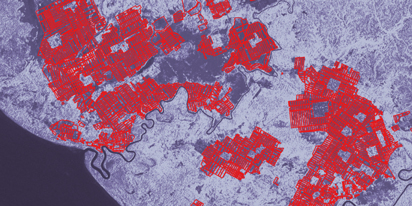
EOSDA advances rice field mapping in Indonesia with SAR
EOSDA tested a radar-based approach to improve rice field detection in Indonesia. By integrating SAR and optical data, the team ensured stable monitoring even during peak monsoon months.

EOSDA Forecasts Yields For 2025 In Saskatchewan
EOSDA created RM-level crop yield forecasts for Saskatchewan to address limitations of official data. The project shows how satellite and weather inputs reveal local yield changes during the season.