Agro & land use
Monitor thousands of hectares with the same measurable indicators season by season. Identify expansion, crop health patterns, and yield-related risks. Built for large areas and recurring monitoring.
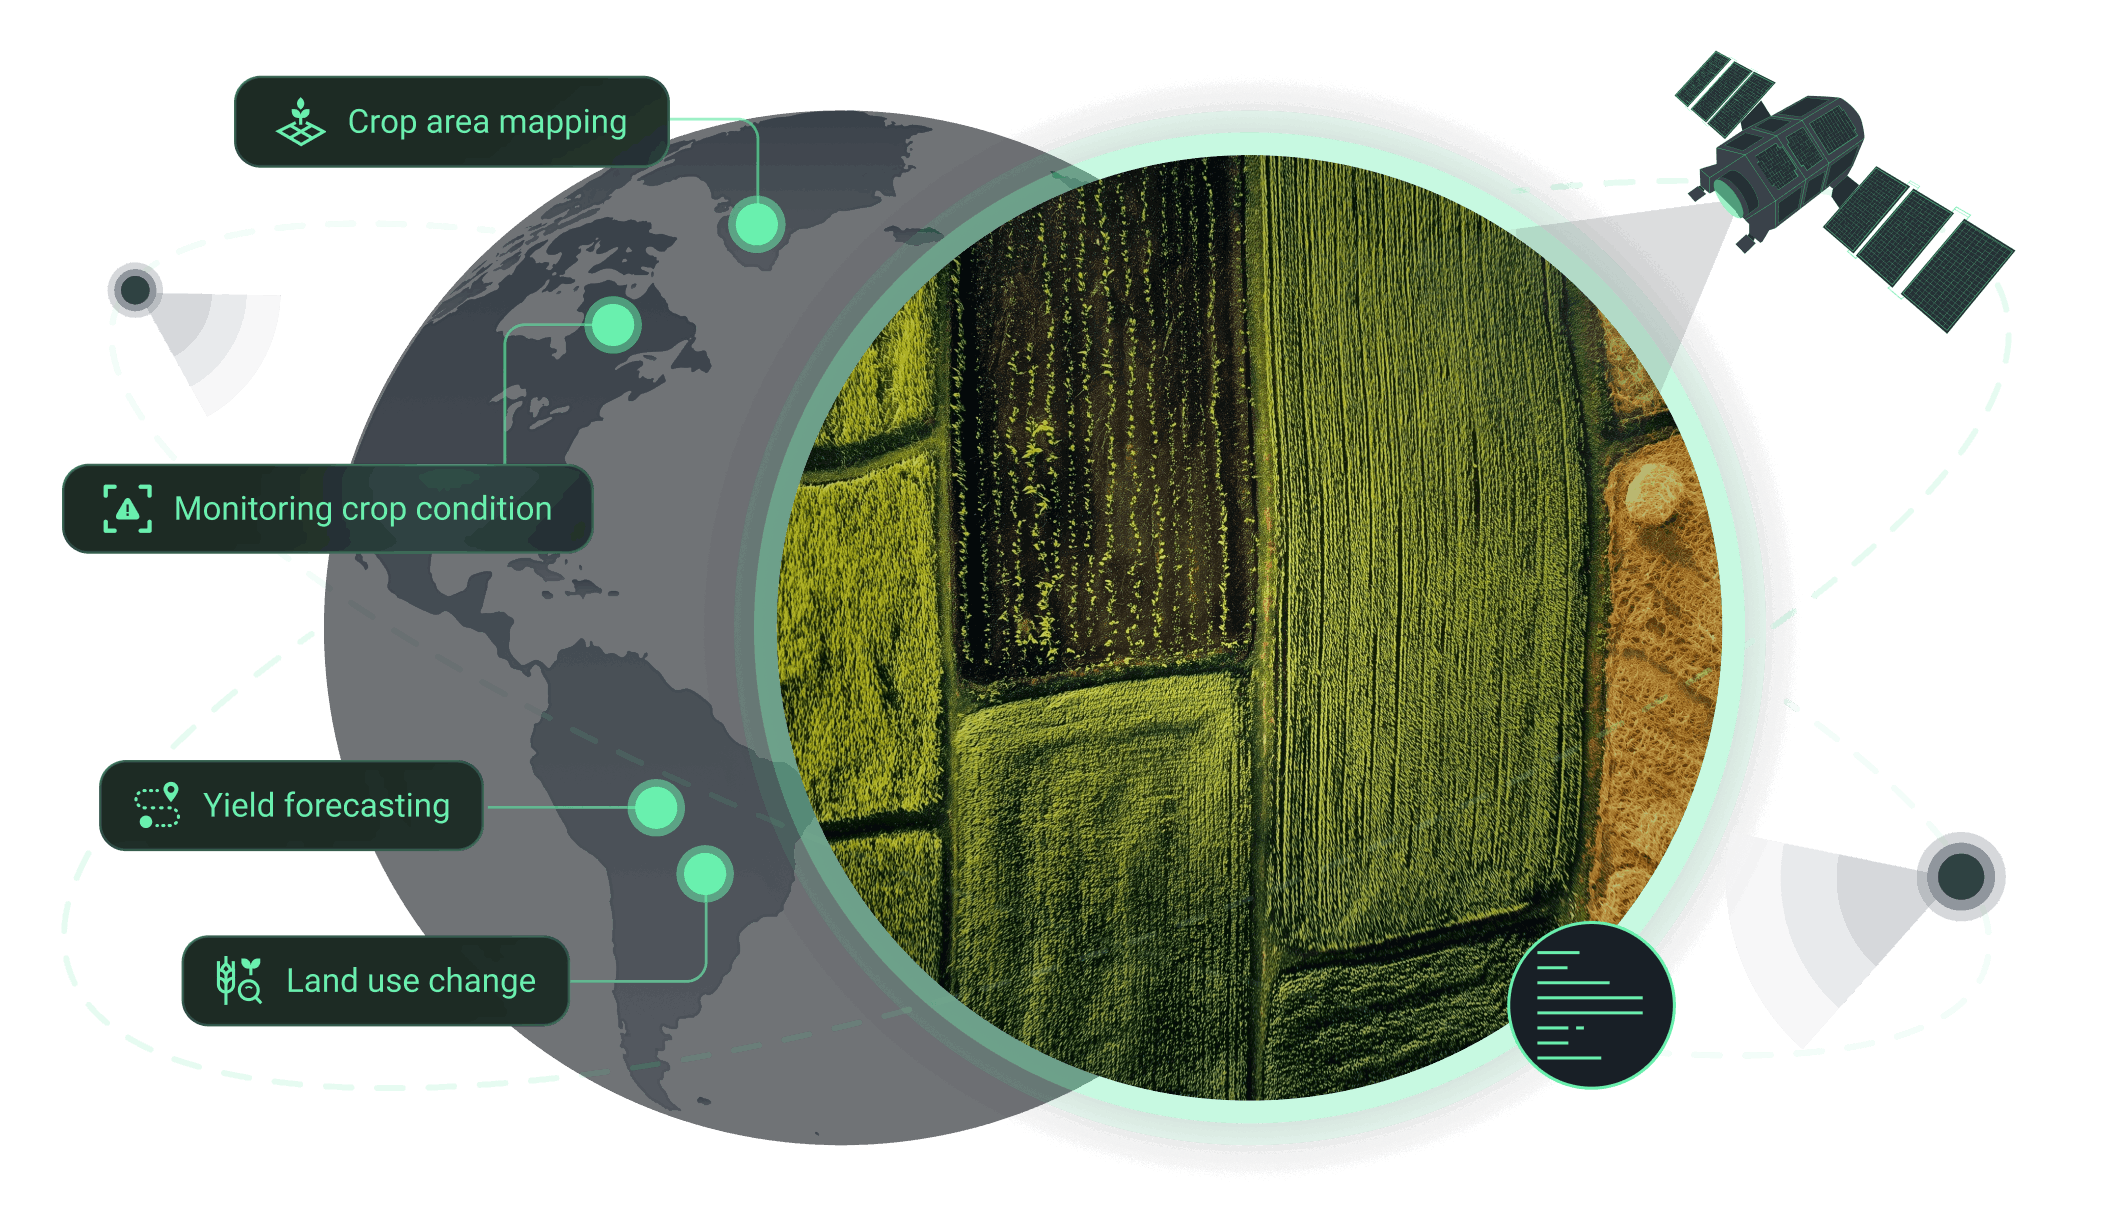
How we support agriculture and land use operations
Core benefit:
Easily quantify planted area and seasonal shifts across regions.
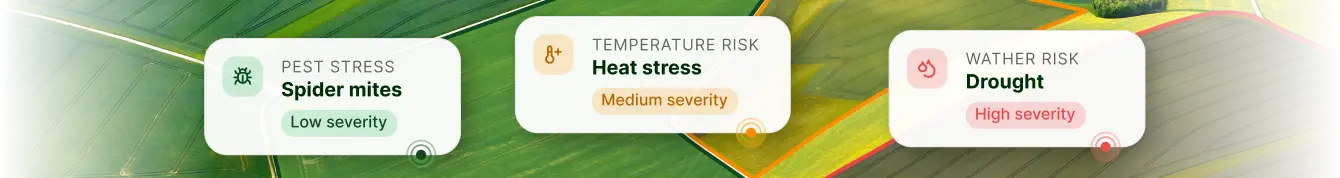
Core benefit:
Spot stress signals early to safeguard your projected yields.
Core benefit:
Get early production trends for smarter planning and logistics.
Core benefit:
Streamline monitoring and reporting with automated field polygon extraction.
Core benefit:
Stay on top of the situation by detecting new activity, conversion, expansion.
Core benefit:
Assess damage accurately with satellite scans after flood, drought, or storms.
Our solutions for agriculture and land use management
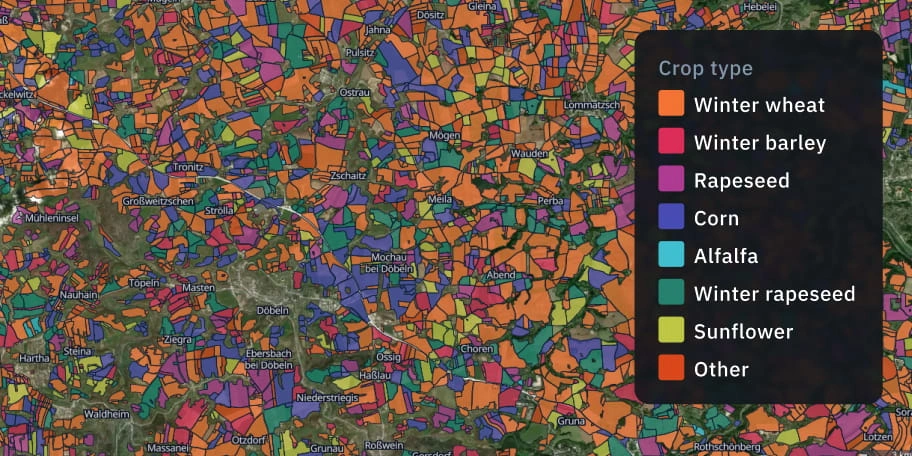
Crop classification
Сrop types and field boundaries identified with high accuracy using bespoke EOSDA's ML models. Reliable satellite-driven classification supports procurement planning, acreage estimation, and regional production analysis.
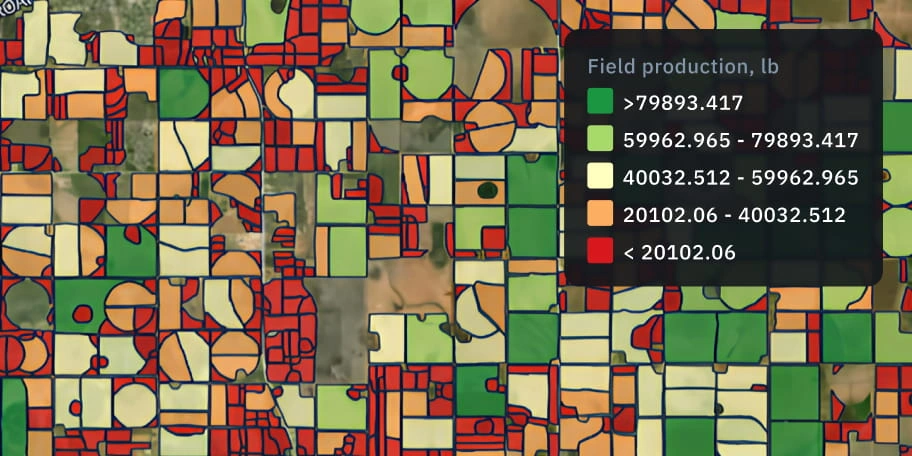
Yield prediction
Plan ahead with early-season biophysical and ML-powered yield forecasts. Optimize trading strategies, manage storage capacity, secure your bottom line, and ensure supply chain stability across regions.
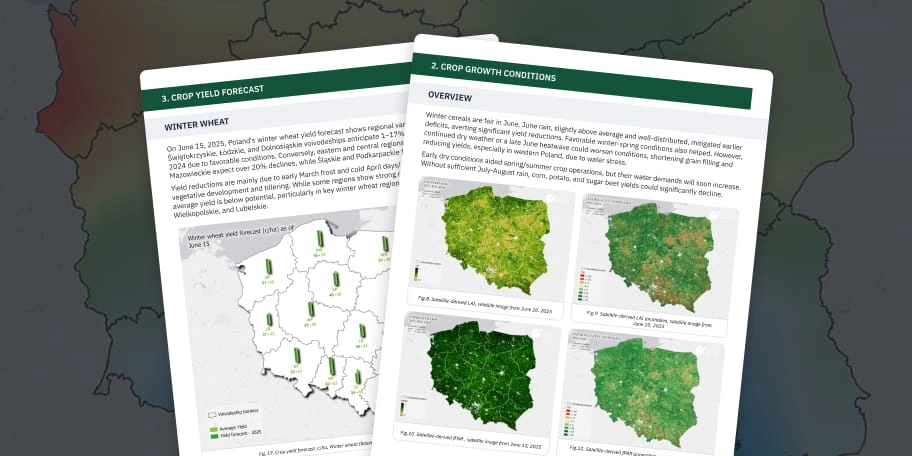
Agroclimatic reports
Evaluate crop performance across regions using agroclimatic reports that merge satellite data, weather inputs, and advanced ML modeling. Receive reliable yield projections to guide planning and market decisions.
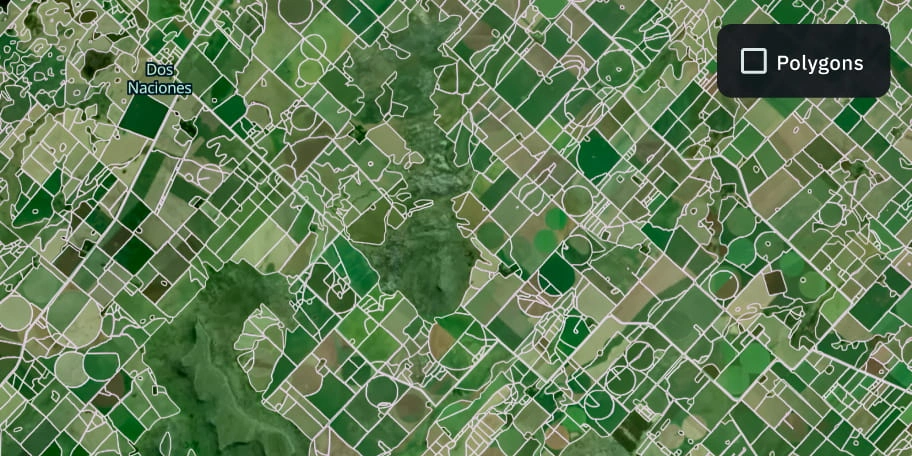
Boundaries detection
Detect field and land boundaries quickly using satellite imagery. Eliminate manual mapping errors, digitize your assets at scale, and start optimizing your per-field analytics today.
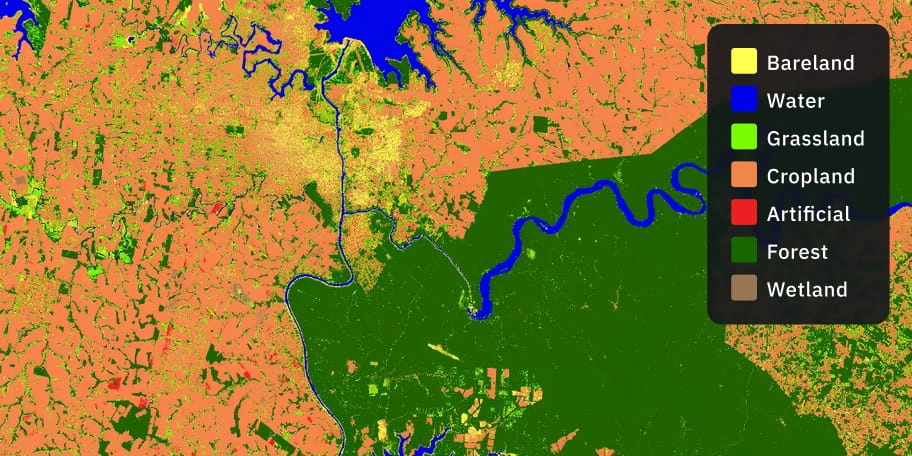
Land cover classification
Classify land efficiently using multi-spectral satellite data and machine learning models. Get ready-to-use maps, area statistics, and insights for better planning decisions.
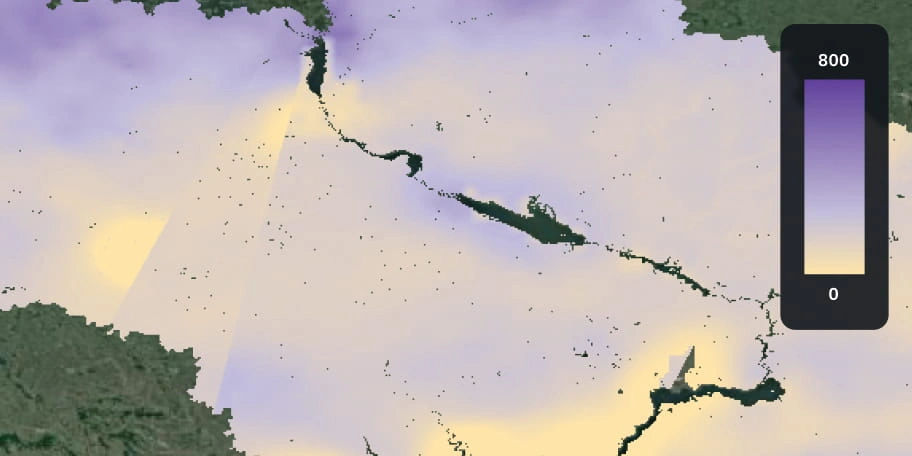
Soil moisture analysis
Track soil moisture across your fields using satellite data to improve irrigation and crop health. Access ready-to-use maps and historical trends to make informed, timely decisions.
The outputs we deliver
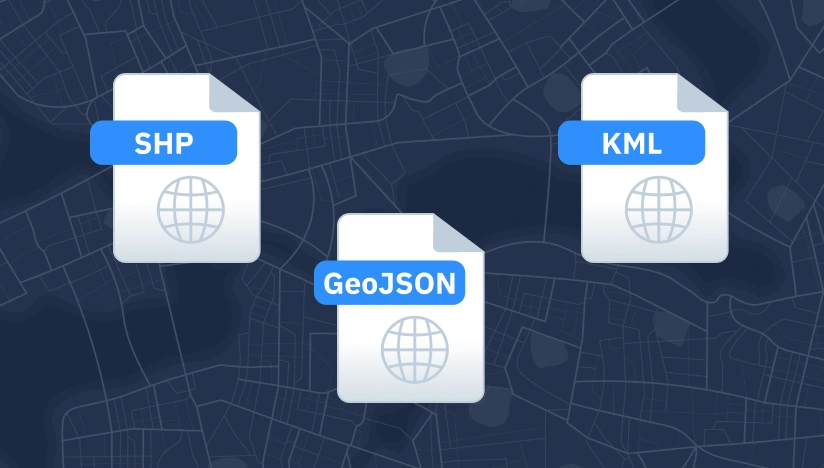
Original data layers
Receive GEOJSON / KML / SHP datasets and upload them wherever you want.
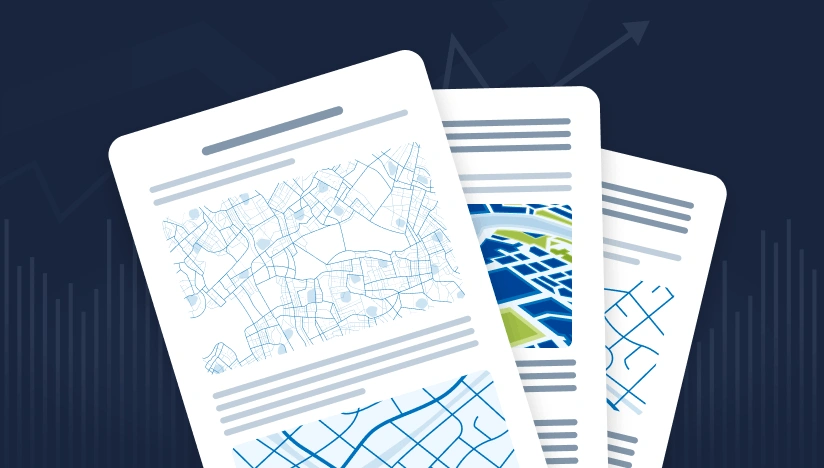
Decision-ready PDF report
Actionable report summarizing key findings for rapid response and easy sharing.
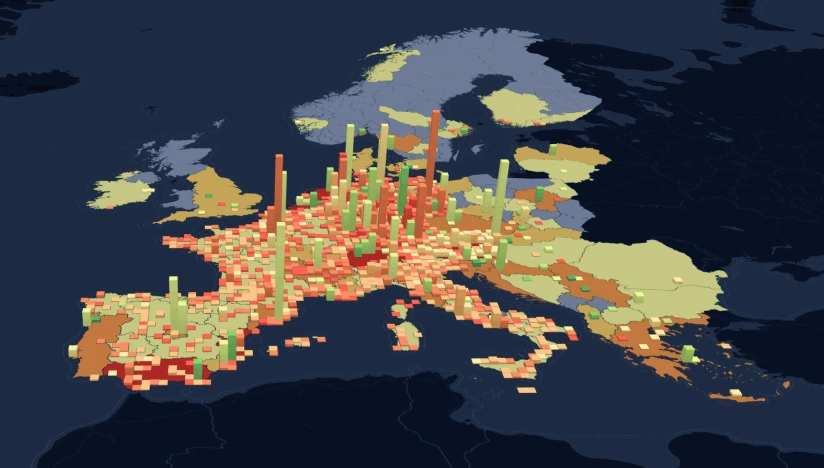
Interactive smart map
Cloud-based interactive map with 3D view for clear visualization and spatial analysis.
Featured case study
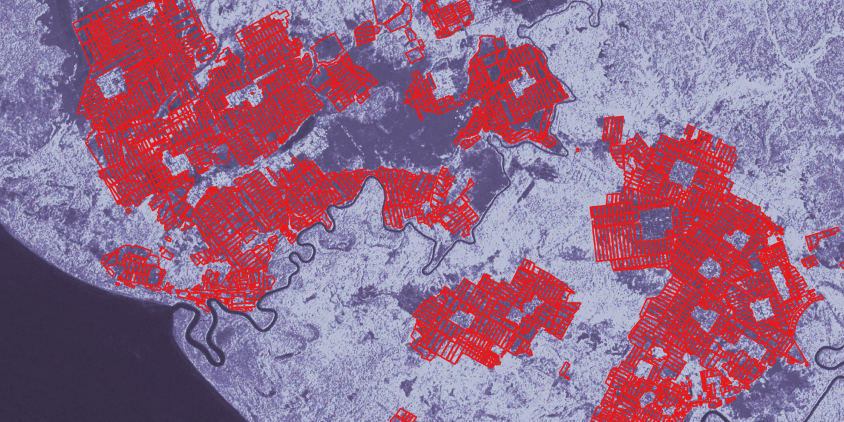
EOSDA advances rice field mapping in Indonesia with SAR
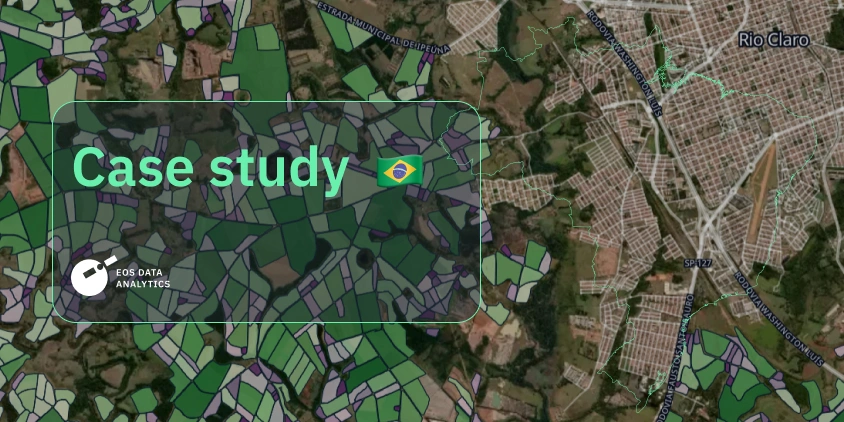
Changing sugarcane yield estimation in São Paulo
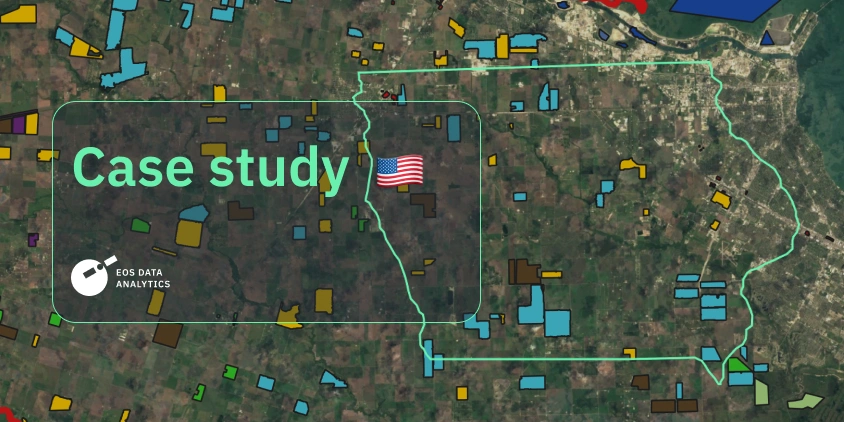
Mapping Iowa: Smarter crop ID and field boundaries
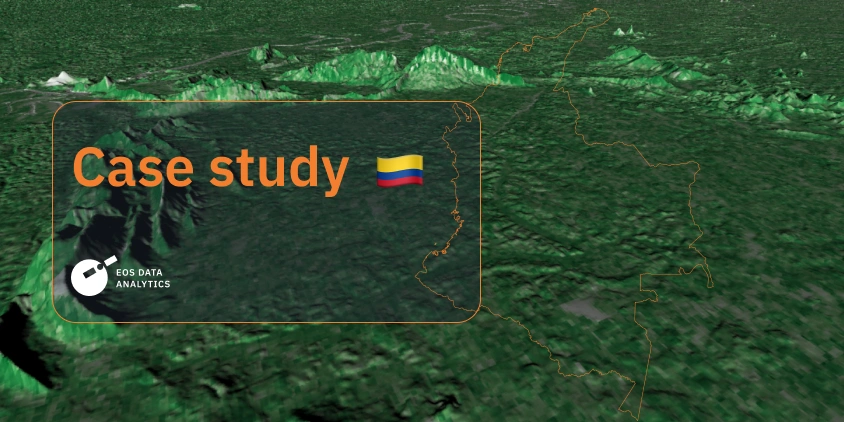
EOSDA analyzes land use for Legado Green in Colombia
Why choose EOSDA for agro monitoring
Delivery that fits operations
Get results as data layers, maps, and reports that your team can put to work immediately.
Reliable outputs every time
Rigorous validation minimizes manual fixes and ensures consistent outputs across all areas.
Deploy fast, scale anywhere
Start fast and scale easily with reusable ML components and pipelines.
Insights instead of raw layers
Get actionable alerts, KPIs, and reports instead of raw data to interpret.
Spot changes against a clear baseline
First, a reliable baseline; then, continuous alerts on new objects and changes.
Clear view no matter the visibility
Ensure consistent observation even through clouds or smoke with optical and SAR sensors.