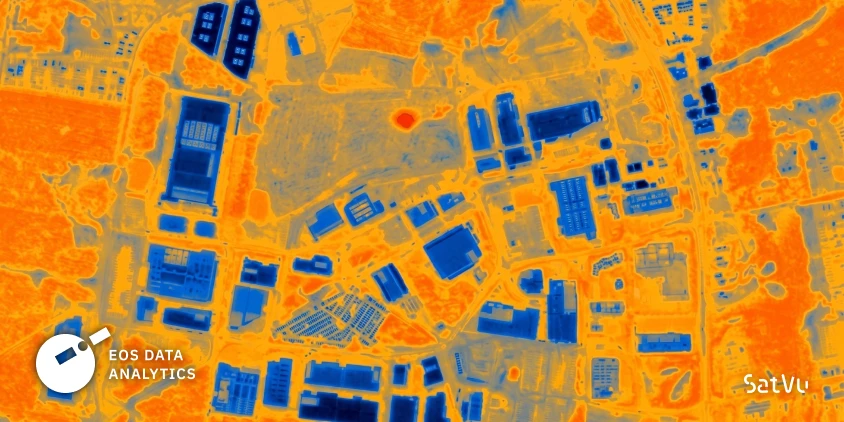
EOS Data Analytics, in partnership with SatVu, conducted remote monitoring of operational and construction activity at a data center site in Sydney. The assessment showed what was happening across the site: which equipment was operating, where construction was underway, which assets were passive, how the solar installation was behaving, and where high-temperature industrial activity was present. This allowed the client to verify asset status and construction progress remotely, without relying solely on physical site inspections. SatVu supplied the high-resolution thermal data, while EOSDA combined it with other geospatial inputs to assess the site’s physical and operational condition for integration into the client’s asset monitoring system.
Case Highlights
Challenge
The client needed independent remote evidence of which equipment was active and where construction was underway at Marsden Park. Large infrastructure sites change fast, and optical imagery shows how a site looks, but does not reliably show its operational state.
Solution
SatVu supplied high-resolution thermal imagery of the site. EOSDA combined it with other geospatial data, corrected for differences in material emissivity, and interpreted the heat patterns across the site.
Outcome
The assessment allowed the client to remotely verify active equipment, ongoing construction, solar infrastructure status, and high-temperature activity across the site, reducing reliance on physical site inspections.
Overview: A data center site in Sydney’s Marsden Park
The Marsden Park industrial precinct, part of Sydney’s North West Growth Area, is expected to provide up to 10,000 jobs .
The precinct also includes an A$3.1 billion hyperscale data center project that the NSW Government approved in November 2025 and described as the biggest in the Southern Hemisphere . The official project record covers six four-story data center buildings with a power consumption of 504 MW . The campus covers about 20 hectares and will include a dedicated substation .
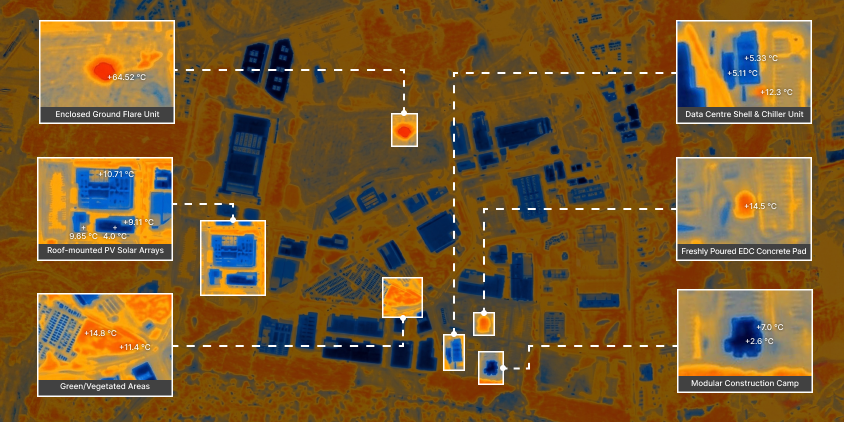
The scene analyzed in this project covered a data center under construction in Marsden Park and the surrounding infrastructure: a cooling plant, generator foundations being poured, and a temporary modular construction camp. Nearby were industrial buildings with roof-mounted solar panels, vegetated areas, and an enclosed ground flare unit.
Monitoring a site like this is challenging because its most important systems cannot be judged by appearance alone. The project plans an air-based cooling system that uses chilled waterwater , and cooling is essential because IT equipment turns nearly all the electricity it uses into heat , The campus is also planned with 40 generators , making on-site power another relevant system to track.
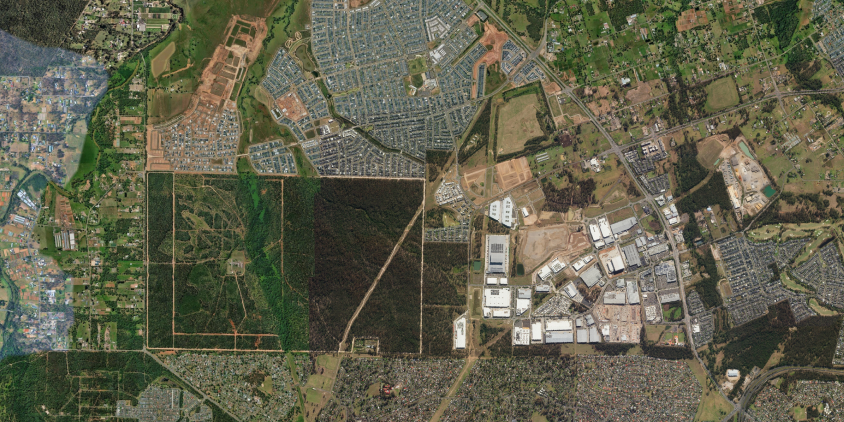
Challenge: Monitoring a fast-changing site remotely
Different parts of the site were at different stages of construction, while some systems were already active. The challenge was to determine remotely where construction was progressing, which equipment was operating, and whether any assets showed unusual behavior.
Answering these questions required several complementary sources and monitoring approaches:
- In a data-fusion workflow, optical imagery shows visible site features, SAR can add information that optical imagery may not capture, and thermal imagery can provide evidence of equipment activity, including at night.
- Site visits provide ground truth but are periodic, costly, and may be restricted at sensitive facilities.
- Progress reports come from the parties carrying out the work, creating a need for an independent source of verification.
The Marsden Park scene contained assets with very different thermal behavior, from cooling equipment and generator foundations to solar panels, modular structures, vegetation, and a gas flare. The task was to distinguish these signals and turn them into an independent assessment suitable for the client’s asset monitoring system.
Solution: SatVu thermal data and EOSDA analysis
Thermal imagery can be better suited than optical or SAR imagery to detecting changes in operational state, such as whether equipment is active or inactive. It can also be acquired both day and night . SatVu provided the thermal imagery for this project, while EOSDA combined it with optical imagery and other geospatial inputs to interpret activity across the site.
SatVu’s HotSat satellites capture mid-wave infrared (MWIR) imagery at a resolution of up to 3.5 m per pixel at nadir, with both daytime and nighttime acquisition . The scene analyzed here was captured at 16:10 UTC on August 10, 2026, or 02:10 in Sydney on August 11, when the absence of direct solar heating made operational and material-related thermal patterns easier to distinguish.
How the thermal analysis was performed
To interpret the SatVu imagery, EOSDA worked through five analytical steps:
- Measured surface brightness temperature (SBT). This showed the apparent temperature recorded by the sensor before correction for material properties.
- Applied emissivity corrections. Emissivity affects how efficiently a material emits thermal radiation, so surfaces at the same physical temperature can appear differently to a thermal sensor. EOSDA accounted for these differences where required when estimating surface temperatures.
- Calculated corrected surface temperatures. This made it possible to compare thermal behavior across different materials more meaningfully.
- Compared assets with neighboring surfaces and background conditions. Soil and vegetation around the analyzed areas provided reference values for the thermal conditions across the scene.
- Interpreted the thermal patterns in geospatial context. Site layout and optical context were used to associate individual thermal signatures with specific assets and processes.
What thermal analysis revealed at Marsden Park
The thermal scene contained several distinct patterns across the site, each linked to a different type of asset or process. By comparing corrected temperatures, material behavior, and surrounding conditions, EOSDA was able to separate operational heat from passive surfaces and natural background variation.
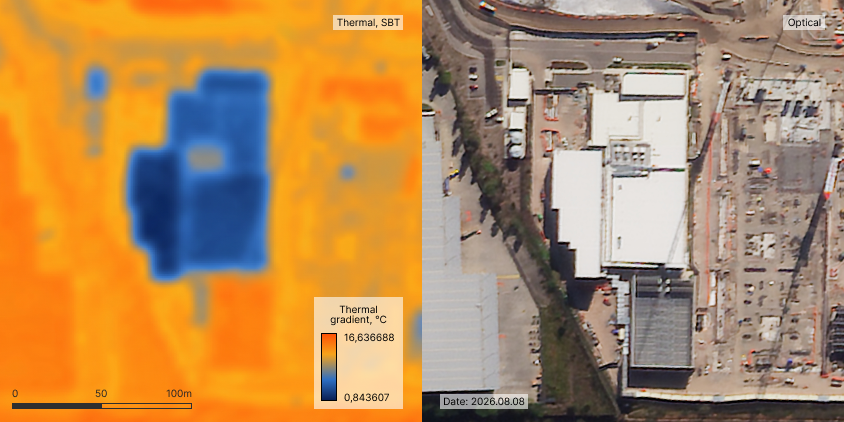
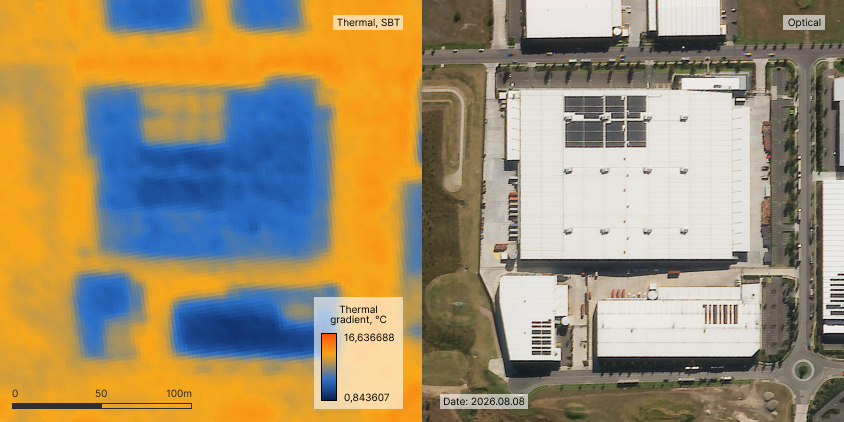
- Data center roof and chiller area. The roof registered about 5°C SBT but was estimated at 18.36°C after emissivity correction, showing how material properties can distort apparent temperature. A localized hot spot around the chiller remained after correction, indicating real equipment activity.
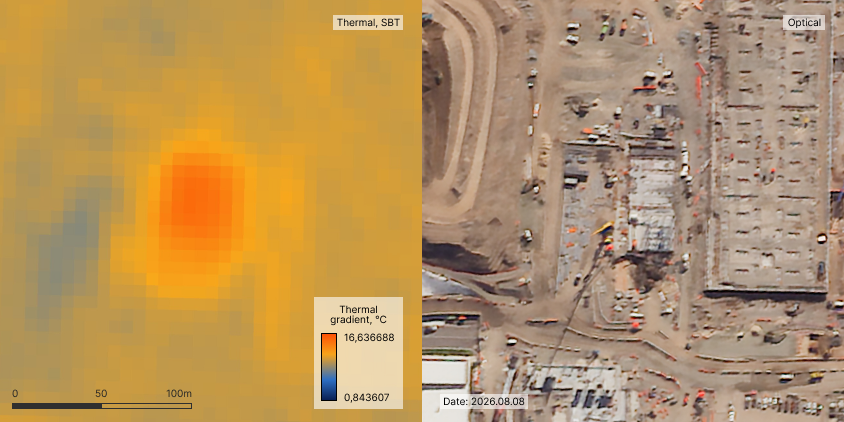
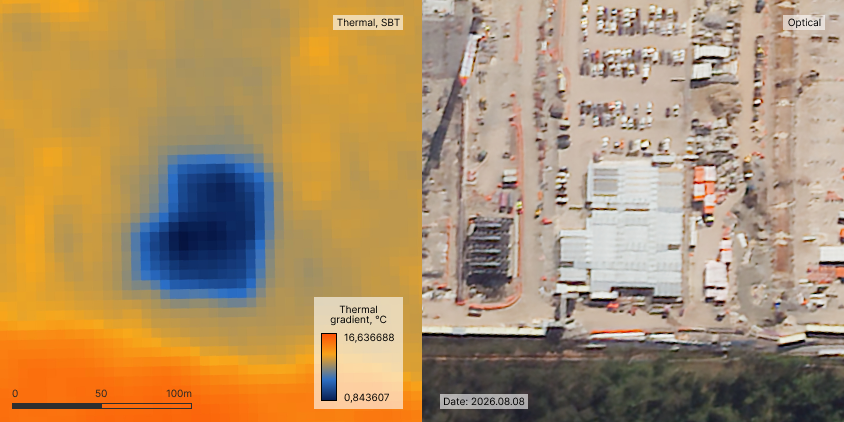
- Generator foundation platforms. Elevated temperatures around the foundations were consistent with heat from operating heavy machinery and the exothermic curing of freshly poured concrete. This provided evidence of active construction at the time of capture.
- Roof-mounted photovoltaic panels. The panels showed a different thermal pattern from the roof beneath them, reflecting differences in material properties and heat retention. Their behavior was consistent with overnight standby mode.
- Modular construction camp. Camp roofs registered lower apparent temperatures than the surrounding soil because of the roofing material’s low emissivity. No significant heat source was detected within the structures.
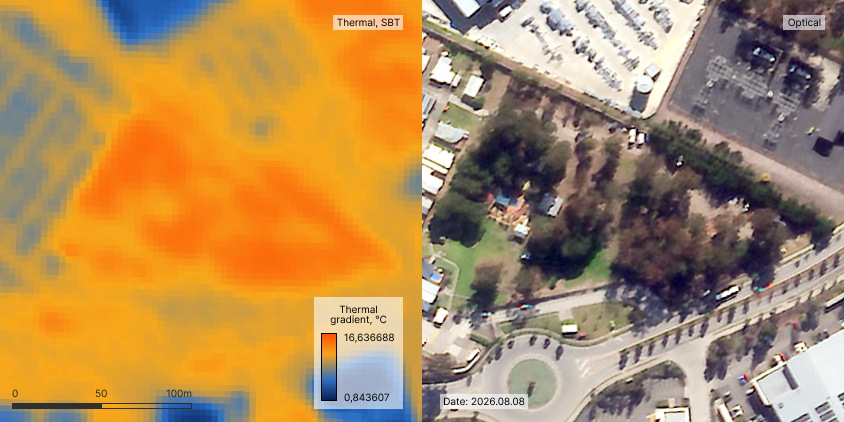
- Vegetated areas. Vegetation provided a natural thermal background shaped by moisture, heat capacity, and transpiration. Comparing this background with nearby artificial structures helps identify temperature differences within vegetated areas.
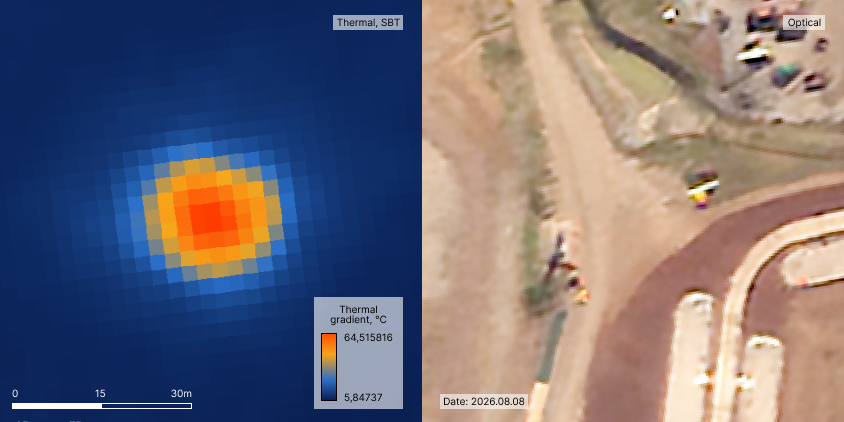
- Enclosed ground flare unit. The flare produced the strongest thermal signal in the scene, with SBT values reaching 64.52°C. Because the source was burning gas rather than a solid surface, EOSDA did not apply surface emissivity correction.
Outcome: Operational insights for remote monitoring
The analysis showed that thermal imagery can provide independent evidence of both operational activity and construction progress without a site visit. It helped distinguish active equipment from passive structures, detect ongoing construction processes, establish expected thermal behavior for assets such as photovoltaic panels, and identify high-temperature industrial activity.
Repeated acquisitions can extend this from a single-site snapshot to change detection over time, helping track equipment activity, construction progress, and deviations from established thermal patterns.
Site visits remain necessary for confirming physical milestones, commissioning, and investigating anomalies that require on-site inspection. The thermal findings can be integrated with optical imagery and other geospatial data in the client’s asset monitoring system.
Turn high-tech satellite data into actionable solutions for your business.
More news
How Crop Monitoring and Agrocentro protect and digitalize Guatemalan and Honduran farms
Agrocentro improves agricultural management and early warning systems in Guatemala and Honduras with its ACTEC technology solution, which relies on Crop Monitoring for satellite data.
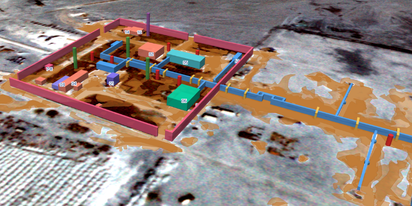
EOSDA tracks construction progress in the UAE PAD areas
Managing rapid industrial expansion in the UAE requires accurate data. See how our satellite-based solution helped a client verify construction milestones and reduce inspection costs.
Validating satellite tech for flood analysis and damage mapping in Coimbra
Can satellites improve disaster response? We explored this in the Coimbra district, showing how integrated satellite intelligence can assess flood impacts and fill critical data gaps during a crisis.