EOSDA Analyzes Land Use For Legado Green In Colombia
Legado Green, a movement dedicated to sustainable land management, oversees an area of 13 million acres in eastern Colombia. To make informed decisions about land use, they needed detailed insights into how their land had changed over the years. Additionally, they required a convenient way to visualize this data for stakeholders.
Faced with challenges like the vast size of the area, complex terrain, and the need for accessible 3D visualizations, they turned to EOS Data Analytics for a solution. The results not only met their requirements but also helped them unlock new opportunities in land management. How did this collaboration succeed? Keep reading to find out.
| Challenge | Legado Green needed detailed land use insights and 3D visualizations for 13 million acres in Colombia. |
| Solution | EOS Data Analytics delivered high-resolution maps, relief-sensitive grids, and lightweight 3D visualizations. |
| Outcome | Legado Green gained tools to manage their land sustainably, share insights effectively, and plan future projects. |
Overview: Visualizing Colombia’s Land Use
Legado Green is an organization focused on protecting the environment and promoting sustainable practices. Based in eastern Colombia, they work to preserve biodiversity and support local communities by using technology and education.
The company partners with 86 indigenous communities and helps over 2,000 families. Their work improves lives and strengthens cultural traditions, benefiting more than 8,400 people. Legado Green aims to find practical solutions to connect people with nature and ensure long-term sustainability.
Managing large areas of land, including parts of the Amazon rainforest, Legado Green leads projects that balance conservation and development. Their goal is to protect the planet while supporting the needs of the communities they serve.
Challenge: Tackling Land Use Analysis Across 13 Million Acres
Legado Green needed to understand how their land in eastern Colombia had changed over the years. This information was essential for managing resources, preserving biodiversity, and planning potential financial operations with land.
However, analyzing an area as large as 13 million acres came with its own set of challenges.
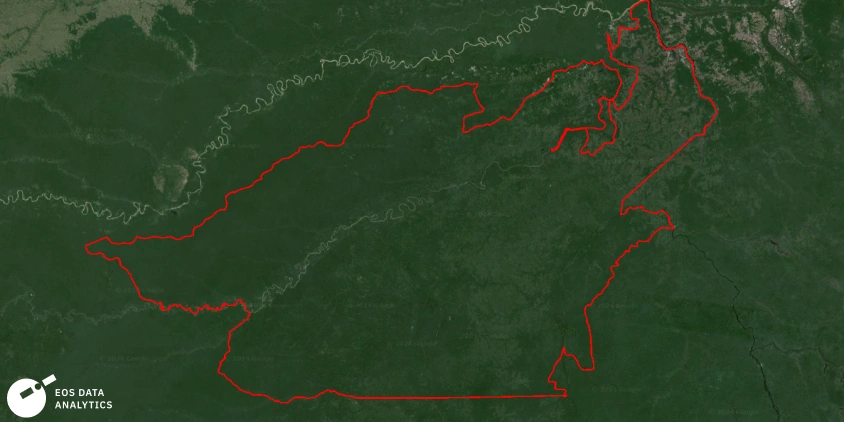
First, the land’s size made it difficult to gather and process accurate data. Simple grid systems could not account for the region’s varied terrain, which included forests, hills, and plains. Splitting the area into one-acre plots required careful consideration of elevation changes to ensure accurate mapping.
Second, Legado Green wanted the results to be easy to visualize and share. They needed a 3D representation that could show detailed land use changes, but such visualizations are complex and require large datasets to run smoothly on standard machines.
These challenges meant Legado Green needed a creative and lightweight solution that combined advanced technology with a user-friendly approach.
Solution: Advanced Analysis And Custom Visualizations
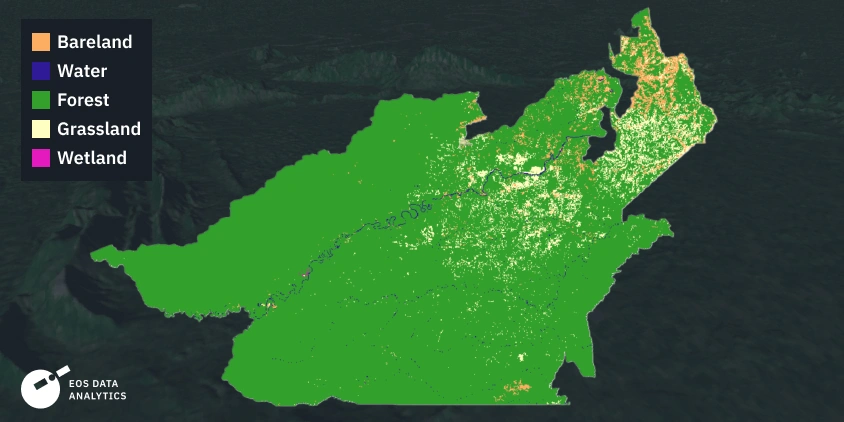
To help Legado Green, EOS Data Analytics combined its satellite data analytics with innovative visualization techniques. Custom solutions such as land cover classification and deforestation monitoring were used to meet the client’s goals.
The project involved multiple stages and a collaborative effort from a skilled team of GIS experts, data scientists, and business analysts.
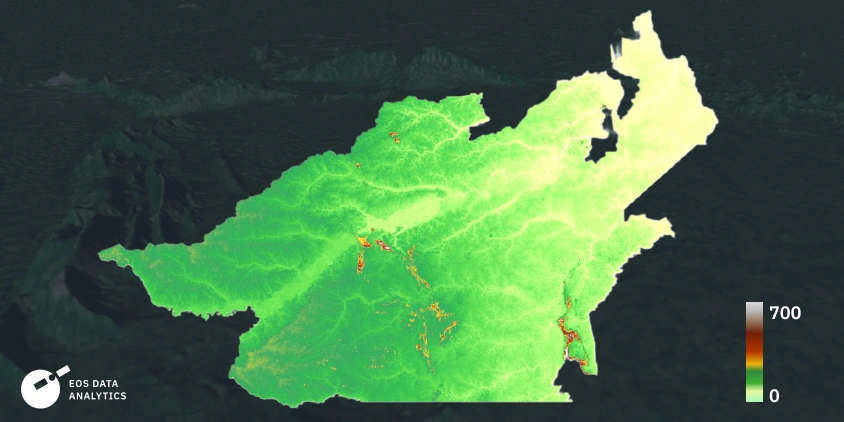
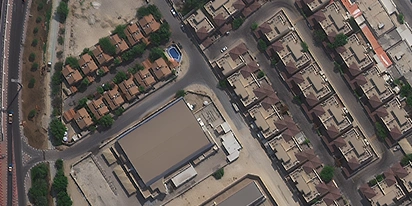
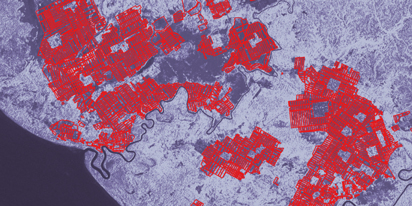
Data preparation and mapping: EOSDA used high-resolution satellite imagery to produce detailed maps of land cover and biomass. This included land cover classifications for 2016 and 2023, a biomass estimation map for 2021, and deforestation detection for 2023 compared to a baseline from 2020.
Relief-sensitive grid creation: A custom approach was used to split the 13-million-acre area into one-acre plots that accounted for elevation changes. This ensured precise mapping even in challenging terrains.
3D visualization: EOSDA provided a lightweight 3D visualization solution, enabling Legado Green to explore land use data interactively. Designed to be accessible and user-friendly, the visualization can be run even on budget machines without requiring specialized software.
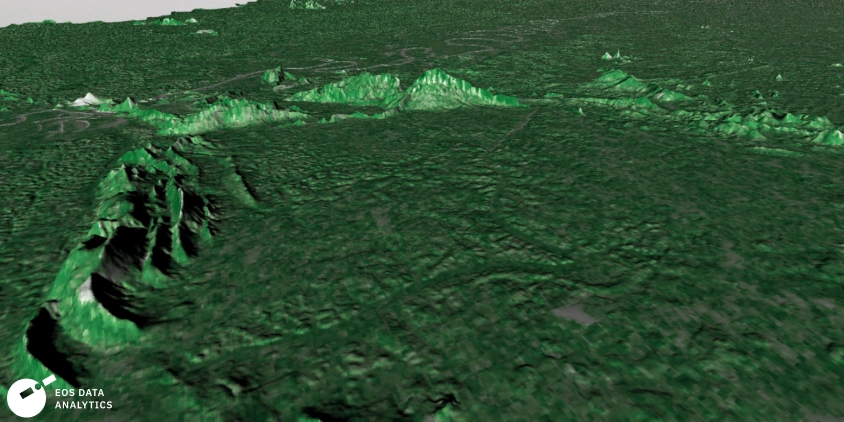
Legado Green’s request for a 3D visualization with relief mapping was unique and pushed us to find a simple yet functional solution. By hosting the visualization locally, we ensured the data was easy to access and explore interactively in a web browser.
Incremental deliveries: Recognizing the project’s complexity, EOSDA shared results in phases. This allowed Legado Green to start using the insights early while the final touches were being completed.
The project required iterative communication, with multiple rounds of discussions about data sources, coordinate systems, and how the calculations accounted for elevation. We also conducted several presentations to explain the 3D visualization tool and guide them through using it effectively.
Clear and collaborative communication between EOSDA’s experts and Legado Green ensured the delivery of high-quality, actionable data tailored to the client’s unique needs in the expected timeframe.
Outcome: Empowering Land Management And Sales
EOS Data Analytics delivered detailed land use insights and visualizations so that Legado Green could better understand and manage their vast territory. The high-resolution maps revealed how the land was used in 2016, 2021, and 2023 and provided a clear picture of changes over time. Thanks to relief-sensitive grids, the data was precise and practical for tasks like resource management and land valuation efforts.
The incremental delivery of results allowed the company to use insights early, meeting its operational needs while ensuring high-quality outcomes. The lightweight 3D visualizations now make it easy for Legado Green to share data with stakeholders.
With these tools, Legado Green is now better equipped to manage their land sustainably, make informed decisions, and plan for future projects. This collaboration reveals the potential of satellite data analytics to address complex land management challenges effectively.
About the author:
Maksym Sushchuk is at the forefront of realizing EOSDA's vision to make space tech a global driver of sustainability on Earth. He has over 15 years of experience in journalism and content creation for prominent Ukrainian startups, charitable funds and ESG businesses. As Head and Co-founder of PR Army Maxim brings attention to the human and social tolls of the aggression against Ukraine.
Recent articles
Can I See A Real-Time Live Satellite View Of My House?
Can you view live satellite images of your house? Discover how to find, preview, and buy high-resolution images of your property for planning or monitoring.
EOSDA advances rice field mapping in Indonesia with SAR
EOSDA tested a radar-based approach to improve rice field detection in Indonesia. By integrating SAR and optical data, the team ensured stable monitoring even during peak monsoon months.
From the Moon mission to practical Earth solutions
Space technology allows us to look further than ever before, but its value is twofold: as the NASA Moon mission explores new frontiers, we use that same vantage point to solve Earth problems.